Health Care · NYSE: MCK
McKesson: how the business works
McKesson buys medicines from drug makers and delivers them to pharmacies, hospitals and clinics in the US and Canada, with revenue of $403.4 billion in FY2026.
By Hardik Bhandare · Checked against filings: . Editorial policy. Corrections
Follow McKesson
Email me when McKesson's page is updated after earnings.
We'll send a confirmation email first. See our privacy policy.
McKesson Corporation · Irving, Texas · Founded 1833
Updated for Q2 FY2027 · checked
- Revenue, FY2026
- $403.4B
- Net income, FY2026
- $4.76B
- Net income per $100 of revenue, FY2026
- $1.18
- Employees, Mar 31, 2026
- More than 43,000
- Directors and officers' holding, May 27, 2026
- 0.06%
The short version
McKesson in 5 points
1 · What it sells
McKesson buys medicines from drug makers and delivers them to pharmacies, hospitals and clinics, and also sells specialty care, medical-surgical supplies and prescription technology services; FY2026 revenue was $403.4 billion.
2 · Who pays it
In FY2026, drug distribution customers in the US and Canada paid 83.4% of McKesson's revenue, specialist practices 12.0%, medical-surgical customers 2.9%, drug makers 1.4% and the sold Norway businesses 0.3%.
3 · What it keeps from $100
Of every $100 that came in during FY2026, McKesson kept $1.18 as net income, including a $480 million net gain on selling its Norway businesses; operating income was $6.2 billion.
4 · Where the operating profit comes from
North American Pharmaceutical brought 83.4% of FY2026 revenue but kept only 1.09% of it as segment profit, while Prescription Technology Solutions kept 17.98% on 1.4% of revenue.
5 · The one thing to watch
Borrowings rose from $6.5 billion at Mar 31, 2026 to $9.2 billion at Sep 30, 2026, while McKesson bought back about $3.4 billion of shares in the first half of FY2027.
Sources: From McKesson's FY2026 10-K and its Q2 FY2027 earnings release of Nov 4, 2026 · checked
01Where the money goes · FY2026
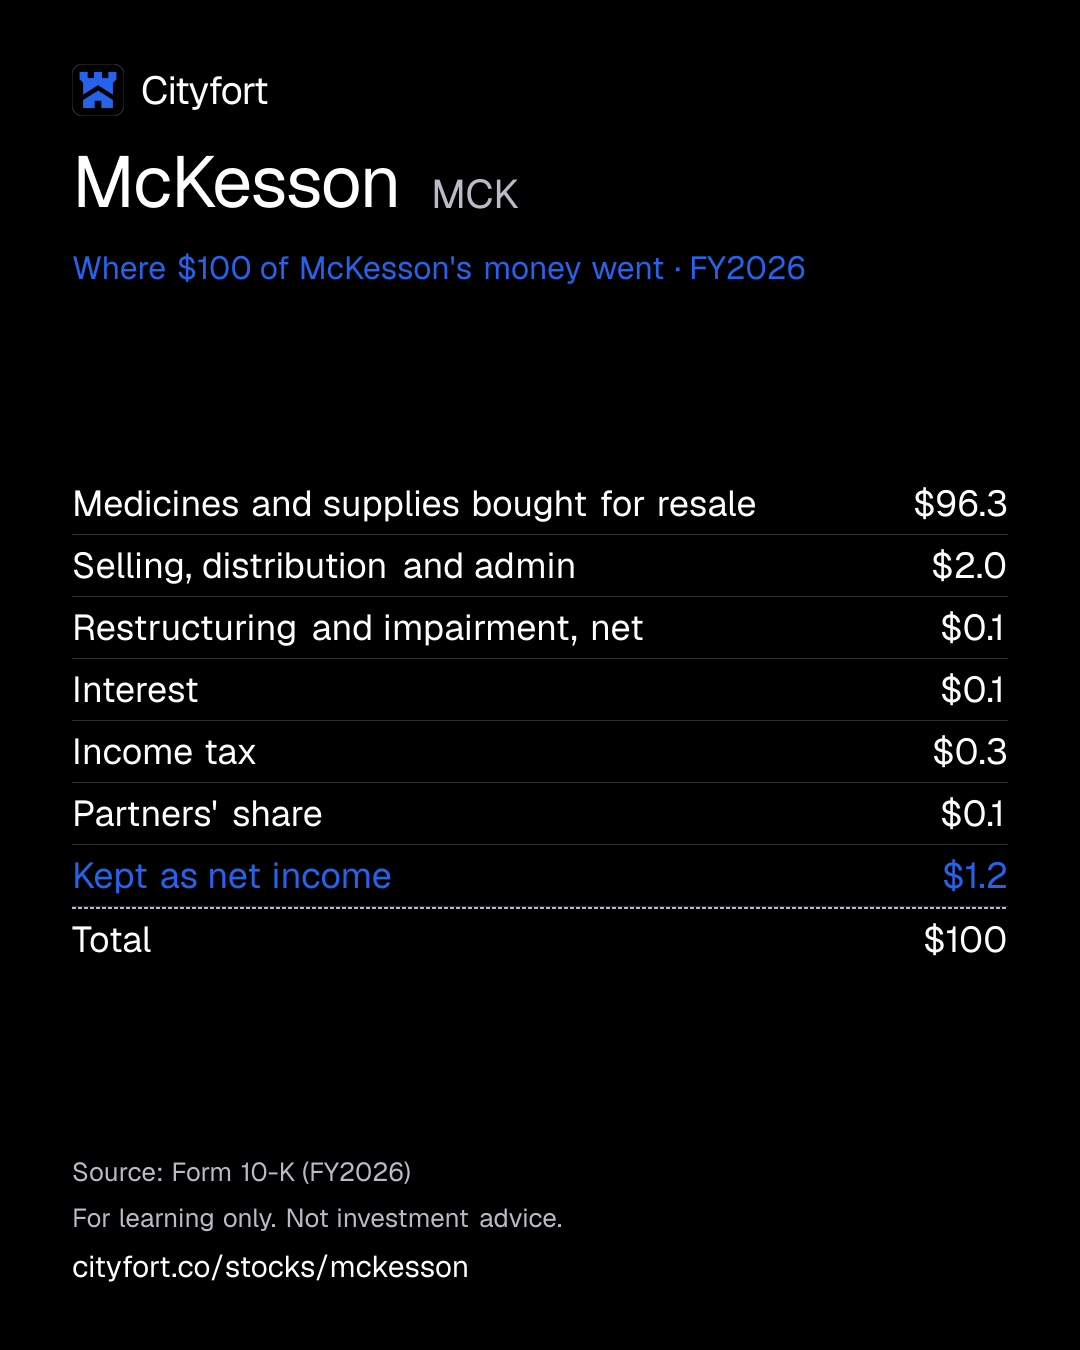
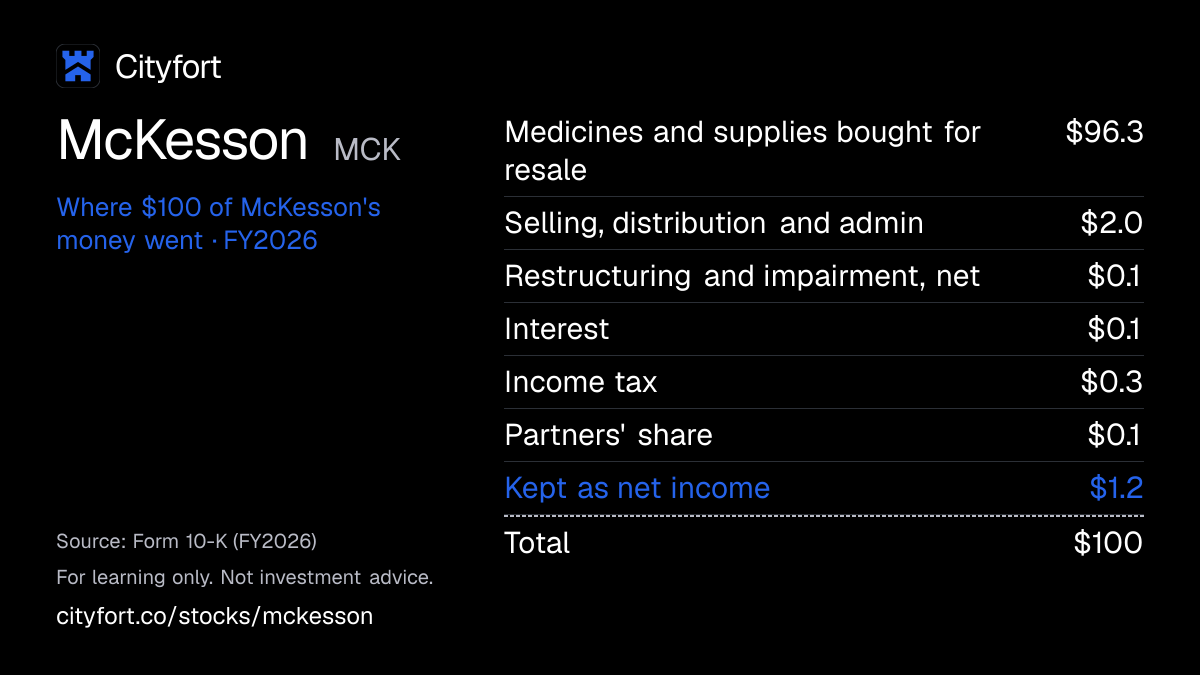
Where does $100 of McKesson's money go?
McKesson · FY2026
Receipt for every $100
| Medicines and supplies bought for resale | $96.3 |
|---|---|
| Selling, distribution and admin | $2.0 |
| Restructuring and impairment, net | $0.1 |
| Interest | $0.1 |
| Income tax | $0.3 |
| Partners' share | $0.1 |
| Kept as net income | $1.2 |
| Total | $100 |
Each line = amount ÷ total money in × 100. Lines may not add to exactly $100 because of rounding.
How this is worked out
Cityfort calculation from FY2026 10-K. Of every $100 that came in during FY2026 (revenues plus $236 million of other income), each line = line ÷ $403.7 billion × 100. "Partners" are the minority owners of businesses McKesson controls, such as the 30% of Core Ventures kept by Florida Cancer Specialists physicians.
Save this receipt as an image
Embed this receipt or the key numbers
Paste this code into a blog or website to show the card you choose, with a link back to this page.
Each week: the next company due to report earnings, explained in 5 points.
No tips. Unsubscribe anytime.
We'll send a confirmation email. See our privacy policy.
02The business in one line
What does McKesson do?
Pharmacies, hospitals and clinics pay McKesson to deliver their medicines. Almost all of that money goes back to drug makers: McKesson kept $1.18 of every $100 as net income in FY2026.
- CVS Health alone was about 24% of FY2026 revenue, and the ten largest customers about 73%.
- Cost of sales took 96.4% of FY2026 revenue. Specialty drugs and prescription software earn more per dollar than plain distribution.
03Who pays it
Who pays McKesson?
Drugstore and mail-order chains
Share of revenue not disclosed
National and regional chains, mail-order pharmacies and mass merchants buy drugs in bulk. CVS Health alone was about 24% of FY2026 revenue.
Independent pharmacies
Share of revenue not disclosed
Community pharmacies buy drugs, generics programs and reimbursement help. About 3,900 of them belong to the Health Mart franchise.
Hospitals and health systems
Share of revenue not disclosed
Hospitals, health systems and long-term care providers buy drugs, contracting help and pharmacy consulting.
Specialist doctors and cancer practices
12%
of revenue
They buy specialty drugs, group purchasing and practice services from the Oncology & Multispecialty segment, 12.0% of FY2026 revenue.
Drug makers
1.4%
of revenue
They pay Prescription Technology Solutions for prescription access and adherence services, 1.4% of FY2026 revenue.
Doctors' offices, surgery centers and nursing homes
2.9%
of revenue
They buy medical-surgical supplies from the Medical-Surgical Solutions segment, 2.9% of FY2026 revenue.
- Specialist doctors and cancer practices12%
- Drug makers1.4%
- Doctors' offices, surgery centers and nursing homes2.9%
Customer concentration
In FY2026, CVS Health was about 24% of revenue and the ten largest customers, including group purchasing organizations, about 73%. The next two largest were 11% and 10%. The Q2 FY2027 10-Q gives no update.
- Largest customer
- 24%
- Top 10 customers
- 73%
04How it makes money
How does McKesson make money?
Very large volume, very thin margin: McKesson keeps about $1 of every $100 it sells.
Most of the money passes straight through to drug makers: cost of sales was 96.4% of FY2026 revenue. Profit comes from moving very large volumes at low cost. Specialty and software services earn more per dollar: Prescription Technology Solutions kept 17.98% as segment profit, against 1.09% in drug distribution.
Net income kept per $100 of revenue
$0.4$1.2
FY2022 to FY2026
- Drug makers sell medicines to McKesson
- McKesson stores them in its distribution centers
- Pharmacies, hospitals and clinics order and receive them
- McKesson keeps a thin slice of each sale
- Specialty care and software services add higher-margin profit
- Cash from operations pays for buybacks, dividends and acquisitions
↺ Step 6 feeds back into step 1.
05Business segments · FY2026
Which businesses make up McKesson?
North American Pharmaceutical
83.4%Drug distribution to US and Canadian pharmacies and hospitals; segment profit was 1.09% of revenue.
Revenue $336.7B ($336,652M) · Operating profit $3.7B ($3,658M)
Oncology & Multispecialty
12%Specialty drugs and services for cancer, eye and other specialist practices; revenue grew 31% in FY2026.
Revenue $48.4B ($48,423M) · Operating profit $1.1B ($1,149M)
Prescription Technology Solutions
1.4%Prescription access and adherence technology sold to drug makers; segment profit was 17.98% of revenue.
Revenue $5.8B ($5,805M) · Operating profit $1.0B ($1,044M)
Medical-Surgical Solutions
2.9%Medical-surgical supplies for care outside hospitals; in its Aug 5, 2026 release, McKesson named the planned standalone company Wellverse.
Revenue $11.5B ($11,507M) · Operating profit $938M
Other
0.3%The former Norway businesses, sold on Jan 30, 2026; profit includes a $503 million gain on the sale.
Revenue $1.0B ($1,043M) · Operating profit $590M
How the mix changed
- North American Pharmaceutical
- Oncology & Multispecialty
- Prescription Technology Solutions
- Medical-Surgical Solutions
- Other
Revenue by segment, FY2024 to FY2026.
US$
See the numbers
06The numbers · Consolidated · US$
How has McKesson done?
Revenue
$403.4BFY2026
Revenue rose every year, from $264.0 billion in FY2022 to $403.4 billion in FY2026.
US$
See the numbers
Net income
$4.8BFY2026
Net income attributable to McKesson rose from $1.1 billion in FY2022 to $4.8 billion in FY2026, with a dip in FY2024.
US$
See the numbers
Net income for every $100 of revenue
$1.2FY2026
McKesson kept $1.18 of net income per $100 of revenue in FY2026, up from $0.42 in FY2022.
Net margin: $ of net income per $100 of revenue
See the numbers
Free cash flow
$5.7BFY2026
Operating cash flow was $6.2 billion in FY2026; free cash flow here deducts only property and equipment, while McKesson's own measure ($5.4 billion) also deducts capitalized software.
US$ · cash from operations minus spending on plants and equipment
See the numbers
See all yearly numbers
EBITDA here = operating income plus depreciation and amortization (from the cash flow statement). Fiscal years are the company's own: Fiscal year ends Mar 31 (FY2026 = Apr 1, 2025 to Mar 31, 2026). Net income is the share belonging to the company's owners.
Learn: Fiscal years that don't end in December: Nvidia's FY2027 explained · Stock-based compensation and dilution: pay that becomes shares
Sources (23)
- McKesson Annual report FY2022
- McKesson Annual report FY2023
- McKesson Annual report FY2024
- McKesson Annual report FY2025
- McKesson Annual report FY2026 (year ended Mar 31, 2026)
- McKesson 10-Q for Q3 FY2024
- McKesson Earnings release Q3 FY2025
- McKesson Earnings release Q4 FY2025
- McKesson 10-Q for Q1 FY2025
- McKesson Earnings release Q1 FY2026
- McKesson Quarterly report Q2 FY2025 (Sep 30, 2024)
- McKesson Earnings release Q2 FY2025
- McKesson Quarterly report Q3 FY2025 (Dec 31, 2024)
- McKesson Quarterly report Q1 FY2026 (Jun 30, 2025)
- McKesson Quarterly report Q2 FY2026 (Sep 30, 2025)
- McKesson Earnings release Q2 FY2026
- McKesson Quarterly report Q3 FY2026 (Dec 31, 2025)
- McKesson Earnings release Q3 FY2026
- McKesson Earnings release Q4 FY2026
- McKesson Quarterly report Q1 FY2027 (Jun 30, 2026)
- McKesson Earnings release Q1 FY2027
- McKesson Quarterly report Q2 FY2027 (Sep 30, 2026)
- McKesson Earnings release Q2 FY2027 (8-K Ex. 99.1)
07Who runs it
Who runs McKesson, and did they deliver?
Brian S. Tyler
Chief Executive Officer and Board Chair · since 2019
CEO since April 2019; also Chair since May 1, 2026.
Kenny Cheung
Executive Vice President and Chief Financial Officer · since 2026
Became CFO on May 29, 2026, succeeding Britt Vitalone.
Francisco J. Fraga
Chief Information Officer and Chief Technology Officer · since 2023
Michele Lau
Chief Legal Officer · since 2024
LeAnn B. Smith
Chief Human Resources Officer · since 2022
Ramesh Srinivasan
Executive Vice President and Chief Strategy Officer · since 2026
Took the role on Aug 1, 2026, when Thomas Rodgers retired.
Dominic J. Caruso
Lead Independent Director · since 2026
Lead Independent Director since May 1, 2026.
What they said, and what happened
1 delivered · 3 too early to tell
Said on Aug 6, 2025
Management guided FY2026 adjusted EPS of $37.10 to $37.90 in the Q1 FY2026 earnings release.
DeliveredWhat happened
FY2026 adjusted EPS was $39.11. The range had been raised several times, last to $38.80 to $39.20 on Feb 4, 2026.
Said on May 7, 2026
McKesson set an FY2027 adjusted EPS range of $43.80 to $44.60, 12% to 14% growth.
Too early to tellWhat happened
Raised to $44.20 to $45.00 on Aug 5, 2026 and to $45.60 to $46.40 on Nov 4, 2026. Six-month adjusted EPS was $21.59.
Said on Aug 5, 2026
McKesson plans to separate Medical-Surgical Solutions into an independent company, named Wellverse on Aug 5, 2026.
Too early to tellWhat happened
The Q2 FY2027 10-Q still reports it as a continuing segment and gives no completion date.
Said on Sep 23, 2025
McKesson set a long-term target of 13% to 16% yearly growth in adjusted EPS at its Sep 23, 2025 Investor Day.
Too early to tellWhat happened
FY2026 adjusted EPS grew 18%; the company reaffirmed the target on May 7, 2026.
Sources (10)
- McKesson Annual report FY2026 (year ended Mar 31, 2026)
- McKesson Earnings release Q4 FY2026
- McKesson 8-K Item 5.02 news release
- McKesson 8-K Item 5.02 officer departure (event Jun 29, 2026; signed Jul 1, 2026)
- McKesson Earnings release Q1 FY2026
- McKesson Earnings release Q3 FY2026
- McKesson Earnings release Q1 FY2027
- McKesson Earnings release Q2 FY2027 (8-K Ex. 99.1)
- McKesson Quarterly report Q2 FY2027 (Sep 30, 2026)
- McKesson Investor Day press release
08What could go wrong
What could go wrong for McKesson?
- Concentration
A few customers buy most of the drugs
CVS Health was about 24% of FY2026 revenue and the ten largest customers about 73%. McKesson said on Nov 4, 2026 that it had agreed to extend the CVS partnership through June 2032.
Watch Customer shares in the FY2027 10-K and any change to large distribution contracts.
- Legal
Opioid claims still open
Opioid-related litigation liabilities were $5.7 billion at Mar 31, 2026, and McKesson paid $512 million in FY2026. Some local governments did not join the settlement. An appeals court reopened the Cabell County and Huntington case on Oct 28, 2025.
Watch The opioid liability and payments in each 10-Q, and rulings in the cases left outside the settlement.
- Execution
The Medical-Surgical separation may change or slip
The FY2026 10-K describes the separation as a split-off, spin-off or both, intended to be tax-free. The 10-K warns it "may not be completed on the currently contemplated terms or timeline". Separation charges were $114 million in the first half of FY2027 ($87 million in the Medical-Surgical segment, $27 million in corporate), recorded in operating expenses.
Watch A registration statement or completion date for Wellverse, and further separation charges.
- Pricing
Very thin margins
McKesson kept $1.18 of net income per $100 of FY2026 revenue, so small cost or price changes move profit. Some drug-maker agreements pay McKesson more when manufacturers raise their prices.
Watch Gross profit per $100 of revenue and LIFO inventory adjustments in the next earnings releases.
- Concentration
Customer bankruptcies
McKesson recorded a $725 million charge in FY2024 for its customer Rite Aid's bankruptcy, and a further $189 million bad-debt provision in the first half of FY2026.
Watch Credit-loss provisions and receivables from large pharmacy customers.
- Technology
Cyber incident and data lawsuits
McKesson discovered a cybersecurity incident on Aug 25, 2026. Putative class actions filed since September 2026 allege it failed to protect patient data; no loss amount is disclosed.
Watch Any update on the incident's impact and the class actions in later 10-Qs.
- Debt
More borrowing and a stockholders' deficit
Borrowings rose from $6.5 billion at Mar 31, 2026 to $9.2 billion at Sep 30, 2026. Buybacks of $4.75 billion in FY2026 and about $3.4 billion in the first half of FY2027 left a $4.0 billion stockholders' deficit.
Watch Debt, cash and buyback amounts in each quarterly release.
09Supporters vs. critics
What do supporters and critics point to?
What supporters point to
- McKesson's revenue grew from $263,966 million in FY2022 to $403,430 million in FY2026, and net income per $100 of revenue rose from $0.42 to $1.18.
- Oncology & Multispecialty revenue grew 31% in FY2026 and 24% in Q2 FY2027. Prescription Technology Solutions kept 17.98% of its FY2026 revenue as segment profit.
- Operating cash flow was $6,155 million in FY2026. Operating income covered interest 25.1 times (Cityfort calculation from FY2026 10-K).
- McKesson paid $4.75 billion for buybacks in FY2026. It declared a quarterly dividend of $0.94 on Jul 21, 2026, up from $0.82, which the company called its tenth yearly increase in a row.
- McKesson said on Nov 4, 2026 that it had agreed to extend its CVS Health partnership through June 2032.
What critics point to
- CVS Health was about 24% of McKesson's FY2026 revenue, and the ten largest customers about 73%.
- Opioid-related litigation liabilities were $5.7 billion at Mar 31, 2026. McKesson settled with states without admitting liability, and some local governments did not join the settlement.
- Borrowings rose from $6.5 billion at Mar 31, 2026 to $9.2 billion at Sep 30, 2026, and the stockholders' deficit was $4.0 billion.
- McKesson recorded a $725 million charge in FY2024 for customer Rite Aid's bankruptcy, and a further $189 million bad-debt provision in the first half of FY2026.
- Putative class actions filed since September 2026 allege McKesson failed to protect patient data after a cybersecurity incident. McKesson said it had not determined that the incident was material.
10What to watch next
What should you watch next at McKesson?
Next event
Q3 FY2027 results
Feb 4, 2027
Expected, based on last year's date
The Medical-Surgical separation
McKesson named the planned standalone company Wellverse on Aug 5, 2026. The Q2 FY2027 10-Q gives no completion date, and the FY2026 10-K warns it may not be completed on the planned terms or timeline.
Borrowings and buybacks
Borrowings were $9.2 billion at Sep 30, 2026, up from $6.5 billion at Mar 31, 2026. McKesson bought back about $3.4 billion of shares in the first half of FY2027, and $4.3 billion of authority remained.
The Option Care Health deal
McKesson agreed in October 2026 to invest about $1.4 billion for about 49% of Option Care Health. McKesson said it expects the deal to close in the first half of calendar 2027, subject to approvals and a stockholder vote.
Adjusted EPS against the company's range
Management said in the Nov 4, 2026 earnings release that it expects FY2027 adjusted EPS of $45.60 to $46.40. Adjusted EPS for the first six months was $21.59.
11Key dates
What are the key dates for McKesson?
| Event | Date | Source |
|---|---|---|
| Fiscal 2027 endsMcKesson's fiscal year runs Apr 1 to Mar 31. | McKesson Annual report FY2026 (year ended Mar 31, 2026) | |
| Option Care Health deal expected to closeExpected in the first half of calendar 2027, subject to approvals and an Option Care stockholder vote. | Not yet stated | McKesson Press release: agreement to acquire Option Care Health with CD&R |
| CVS Health distribution partnership runs throughExtended through June 2032, as announced on Nov 4, 2026. | Not yet stated | McKesson Earnings release Q2 FY2027 (8-K Ex. 99.1) |
Learn: Fiscal years that don't end in December: Nvidia's FY2027 explained
12Key facts
Key facts about McKesson
- What does McKesson do?
- McKesson Corporation distributes prescription drugs and medical supplies to pharmacies, hospitals and doctors in the US and Canada, and sells prescription technology services to drug makers. McKesson's revenue was $403.4 billion in FY2026, the year to Mar 31, 2026.
- How does McKesson make money?
- McKesson earns a thin margin on very large drug volumes: cost of sales was 96.4% of its FY2026 revenue, and it kept $1.18 of net income per $100 of revenue. Drug distribution (the North American Pharmaceutical segment) was 83.4% of McKesson's FY2026 revenue.
- Who are McKesson's customers?
- McKesson sells to drugstore chains, independent pharmacies, hospitals, specialist practices and drug makers. CVS Health was about 24% of McKesson's FY2026 revenue, and the ten largest customers about 73%.
- How big is McKesson?
- McKesson reported FY2026 revenue of $403,430 million and net income of $4,762 million, up from $359,051 million and $3,295 million in FY2025. McKesson had more than 43,000 employees, according to its FY2026 10-K.
- Which McKesson business earns the most per dollar of sales?
- McKesson's Prescription Technology Solutions segment kept 17.98% of its FY2026 revenue as segment profit, against 1.09% for the North American Pharmaceutical drug distribution segment.
- Who owns McKesson?
- McKesson has one class of common stock. McKesson's 2026 proxy lists BlackRock at 7.9% (Schedule 13GA filing by anyone who owns more than 5% of a company's shares and does not seek control. Learn more/A, Apr 14, 2025) and Vanguard Capital Management at 7.8% (Schedule 13G, Apr 30, 2026). McKesson's directors and executive officers held 0.06% at May 27, 2026.
- Does McKesson pay dividends and buy back shares?
- McKesson declared dividends of $3.17 per share for FY2026, up from $2.75 in FY2025. McKesson paid $4.75 billion to buy back its own shares in FY2026.
- What were McKesson's latest quarterly results?
- In Q2 FY2027, the quarter to Sep 30, 2026, McKesson's revenue was $110,957 million and net income was $1,218 million, against $103,150 million and $1,110 million in Q2 FY2026.
Terms on this page
- Capital expenditures (capex)
- Customer concentration
- Earnings per share (EPS)
- EBITDA
- Free cash flow
- Interest coverage
- Net debt
- Net margin
- Revenue vs net income
- Stock buyback
Each explains the term in plain English, with the same number from other companies on Cityfort.
Go deeper
More detail from the same filings. Open any section.
13What it sells
13What it sells
What does McKesson sell?
North American Pharmaceutical
Delivers branded, generic, specialty and over-the-counter drugs to US and Canadian pharmacies and hospitals. The US business runs 27 distribution centers.
Oncology & Multispecialty
Specialty drug distribution, group buying, infusion and practice services for cancer, eye and other specialist doctors. It supports The US Oncology Network of community cancer practices.
Prescription Technology Solutions
Software and services that help patients get and afford medicines, such as electronic prior authorization (getting an insurer's approval before a prescription is filled) and patient enrollment for drug makers.
Medical-Surgical Solutions
Supplies and lab equipment for doctors' offices, surgery centers, nursing homes and home health agencies. It offers more than 270,000 national-brand products and over 4,000 of its own.
Think of it like this
Think of a wholesale warehouse for medicines: it buys from drug makers, holds the stock and delivers it to pharmacies, keeping a thin slice of each sale.
What it does
- Does: Distributes prescription drugs to drugstore chains, independent pharmacies, hospitals and clinics
- Does: Runs Health Mart, a franchise network of about 3,900 independently owned pharmacies
- Does: Sells technology and services to drug makers that help patients start and stay on medicines
- Does: Supplies medical-surgical products to care settings outside hospitals
What it does not do
- Does not: Make medicines: it buys them from drug makers and resells them
- Does not: Own the Health Mart pharmacies: they are independently owned franchisees
- Does not: Run the Norway businesses: it sold them on Jan 30, 2026, which McKesson called "the final phase to fully exit its European operations"
14How the money flows
14How the money flows · FY2026
How does money flow through McKesson?
Money in
- Revenues$403.4B
- Other income, net$236M
The company
McKesson
$403.7B came in
Money out
- Medicines and supplies bought for resale (cost of sales)$388.9B
- Selling, distribution and admin costs$8.1B
- Restructuring and impairment, less a $3M litigation credit$242M
- Interest$247M
- Income tax$1.1B
- Share of partners in part-owned businesses$337M
- Net income attributable to McKesson$4.8B
- Customers paid McKesson $403.4 billion in FY2026, and other income added $236 million.
- The medicines and supplies it resold cost $388.9 billion, leaving $14.6 billion of gross profit.
- Operating costs took $8.3 billion, after a $480 million net gain on selling the Norway businesses. That left $6.2 billion of operating income.
- Interest took $247 million and income tax $1.1 billion, leaving net income of $5.1 billion.
- Partners in businesses McKesson controls but does not fully own took $337 million. McKesson kept $4.8 billion.
15What it needs to run
15What it needs to run
What does McKesson need to run?
Medicines from drug makers
Cost of sales was $388.9 billion in FY2026. The largest supplier was 11% of purchases and the ten largest 71%.
Warehouses and delivery
The US drug business runs 27 distribution centers, including two redistribution centers of over 740,000 square feet combined.
Credit from suppliers
At Mar 31, 2026, McKesson owed $60.0 billion in drafts and accounts payable, more than its $24.2 billion of inventory.
People
More than 43,000 employees, including 1,400 part-time: about 38,000 in the US and 5,000 in Canada.
Ordering and pharmacy software
Systems such as McKesson Connect let customers look up stock and order online. Research and development cost $103 million in FY2026.
16Competitors and what protects it
16Competitors and what protects it
Who does McKesson compete with?
Cencora
NYSE: COR
Named in McKesson's FY2026 10-K as a primary competitor in distribution, wholesaling and logistics, and in specialty and provider services.
Cardinal Health
NYSE: CAH
Named in McKesson's FY2026 10-K as a primary competitor in distribution, wholesaling and logistics, and in specialty and provider services.
What protects the business
Each strength is scored 1 (weak) to 5 (strong) for the business, with the reason. It is not a rating of the share.
- Scale4 of 5
McKesson moved $403.4 billion of revenue in FY2026 through 27 US distribution centers. The 10-K names only two primary distribution rivals.
- Long customer contracts3 of 5
CVS Health was about 24% of FY2026 revenue. McKesson said on Nov 4, 2026 that it had agreed to extend the CVS distribution partnership through June 2032.
- Pharmacy and doctor networks3 of 5
Health Mart links about 3,900 independent pharmacies, and the oncology segment supports The US Oncology Network of community cancer practices.
Weak spot
Thin margins and a few big buyers
McKesson kept $1.18 of net income per $100 of FY2026 revenue, and its ten largest customers were about 73% of revenue.
17Where growth could come from
17Where growth could come from
Where could McKesson's growth come from?
Management said in the Nov 4, 2026 earnings release that it expects FY2027 adjusted EPS of $45.60 to $46.40, raised from $44.20 to $45.00. It first set $43.80 to $44.60 on May 7, 2026. McKesson does not forecast GAAP EPS.
Oncology & Multispecialty
WorkingRevenue +24%, Q2 FY2027
Revenue grew 24% from a year earlier and adjusted segment profit 8%. McKesson bought 70% of Core Ventures for $2.5 billion in June 2025 and 80% of PRISM Vision in April 2025.
Status: Working, on track against what the company said.
Prescription Technology Solutions
WorkingAdjusted profit +18%, Q2 FY2027
Revenue grew 10% and adjusted segment profit 18%, which the company linked to its access solutions.
Status: Working, on track against what the company said.
Drug distribution volumes
WorkingRevenue +6%, Q2 FY2027
North American Pharmaceutical revenue grew 6% on higher prescription volumes, and adjusted segment profit 22%.
Status: Working, on track against what the company said.
Medical-Surgical Solutions
MixedAdjusted profit -10%, Q2 FY2027
Revenue grew 5% but adjusted segment profit fell 10%, which the company linked to lower ambulatory care mix.
Status: Mixed, partly on track.
New deals in biopharma services and home infusion
New$2.25B Precision Medicine deal
McKesson completed the Precision Medicine Group purchase on Nov 2, 2026. It agreed in October 2026 to invest about $1.4 billion for about 49% of Option Care Health alongside CD&R, pending approvals.
Status: New, recently announced.
Status compares progress with what the company itself said it would do: Working = on track against what the company said; Mixed = partly on track; Behind = behind the company's own plan; New = recently announced; Early = too early to judge.
Sources (6)
18The company's own measures (non-GAAP)
18The company's own measures · FY2026
What do McKesson's own measures show?
Official (GAAP): Diluted EPS, FY2026
$38.38
Company's own measure: Adjusted EPS, FY2026
$39.11
According to McKesson's May 7, 2026 release, it leaves out amortization of acquired intangibles, LIFO inventory adjustments, restructuring, litigation charges and transaction-related items, including the $480 million net gain on the Norway sale.
Official (GAAP): Net income attributable to McKesson, FY2026
$4.8B
Company's own measure: Adjusted earnings, FY2026
$4.9B
The same exclusions in dollars, after their tax effects.
Official (GAAP): Diluted EPS, Q2 FY2027
$10.44
Company's own measure: Adjusted EPS, Q2 FY2027
$11.68
The same definition for the quarter to Sep 30, 2026.
Official (GAAP): Operating cash flow, FY2026
$6.2B
Company's own measure: Free cash flow (McKesson's measure), FY2026
$5.4B
McKesson deducts purchases of property and equipment and capitalized software ($745 million). The free cash flowCash from operations minus spending on buildings and equipment. Learn more in "The numbers" deducts only property and equipment.
These are the company's own measures, defined by the company. They are not comparable across companies, and they are not added together. Each sits beside the nearest official (GAAP) figure.
Learn: Non-GAAP measures: what a company's "adjusted" numbers leave out
19Financial strength and debt
19Financial strength · Sep 30, 2026
How much debt does McKesson have?
- Total debt$9.2B
- Cash and investments$6.5B
- Net debt (debt minus cash)$2.7B
- Net worth (shareholders' money)−$4.0B
- Interest cover
- 25.1×
- how many times operating profit covers interest
- Borrowings exclude operating leases. They rose from $6.5 billion at Mar 31, 2026; at Sep 30, 2026 they included $3.2 billion of Medical-Surgical term loans (Cityfort calculation from Q2 FY2027 10-Q).
- Shares bought back and held in treasury had cost $32.0 billion by Mar 31, 2026.
- Opioid-related litigation liabilities were $5.7 billion at Mar 31, 2026 ($601 million due within a year), down from $6.4 billion a year earlier.
- The deficit leaves out the Apollo funds' convertible preferred stake in Medical-Surgical Solutions, which is shown as a redeemable noncontrolling interest.
- Interest coverage is FY2026 operating income of $6.2 billion divided by $247 million of interest expense (Cityfort calculation from FY2026 10-K).
20Who owns it
20Who owns it · ownership as of May 27, 2026
Who owns McKesson?
- Officers and directors (as a group), shares
- 0.1%
Share classes
Holders of 5% or more
From the company's proxy statement (DEF 14A), later Schedule 13G filings and the share counts on its latest annual or quarterly report. Each holder row shows the date of its own filing.
Learn: How to read a proxy statement (DEF 14A): Nvidia's 2026 proxy · Form 4 insider filings: who files, the codes and the footnotes
21What it does with profit
21What it does with profit
What does McKesson do with its profit?
Dividend per share
$3.17FY2026
Dividend paid for each share, by financial year.
$ per share
See the numbers
Buyback · Mar 31, 2024
FY2024: paid $3.0 billion for its own shares.
$3.0B
Buyback · Mar 31, 2025
FY2025: paid $3.1 billion for 5.8 million shares.
$3.1B
Buyback · Mar 31, 2026
FY2026: paid $4.75 billion, including a $2.25 billion accelerated repurchase in March 2026.
$4.8B
Buyback · Sep 30, 2026
First half of FY2027: about $3.4 billion of repurchases.
$3.4B
22Governance signals
22Governance signals
What do McKesson's governance filings show?
- Auditor
- Deloitte & Touche LLP, since 1968
- Auditor changes
- None in the period covered
- Audit qualifications
- None reported
- Related-party dealings
- The 2026 proxy says there were no reportable related party transactions for FY2026. A written policy requires approval of such deals with directors, officers and 5% holders.
- Credit rating
- Not checked for this page
Flags to know about
regulatory
Opioid settlements and lawsuits
McKesson and two other national distributors settled opioid claims with 48 states, DC and territories, without admitting liability. The three distributors' $7.9 billion of payments run to 2038. Some local governments did not join. A Baltimore judgment against McKesson ($37 million of damages and $72 million of abatement) was vacated on Apr 24, 2026 and sent back for more proceedings.
other
Cybersecurity incident and class actions
McKesson disclosed a cybersecurity incident discovered on Aug 25, 2026 and said it had not determined that it was material. Since September 2026, putative class actions in federal court in Texas allege it failed to safeguard patients' health and personal information.
other
Chair and CEO are the same person
Brian Tyler became Board Chair on May 1, 2026 while remaining CEO, and Dominic Caruso became Lead Independent Director. Ten of the 11 nominees in the 2026 proxy are independent.
23How it got here
23How it got here
How did McKesson get here?
1833
Milestone
Business roots
McKesson says its business traces its roots to 1833; today's company was incorporated in Delaware in 1994.
2020
Business-model change
Change Healthcare split-off
On Mar 10, 2020, McKesson completed the separation of its interest in the Change Healthcare joint venture.
2022
Crisis
Opioid settlement
McKesson and two other distributors settled opioid claims with 48 states, without admitting liability.
2024
Crisis
Rite Aid charge
A $725 million charge in FY2024 for the bankruptcy of its customer Rite Aid.
2025
Milestone
Bigger in cancer and eye care
Bought 80% of PRISM Vision for $875 million (April) and 70% of Core Ventures for $2.5 billion (June).
2025
Business-model change
Four new segments
From Q2 FY2026, McKesson reports four segments: Oncology & Multispecialty is shown separately, and US and Canadian drug distribution are combined as North American Pharmaceutical.
2026
Business-model change
Europe exit completed
The sale of the Norway businesses closed on Jan 30, 2026, ending McKesson's operations in Europe.
2026
Business-model change
Medical-Surgical becomes Wellverse
Apollo funds invested about $1.25 billion for about 13% of the business on Jun 1, 2026, ahead of a planned separation.
2026
Milestone
Precision Medicine and Option Care deals
Completed the $2.25 billion Precision Medicine Group purchase on Nov 2, 2026; a 49% Option Care Health deal is pending.
Sources (7)
- McKesson Annual report FY2026 (year ended Mar 31, 2026)
- McKesson Supplemental historical segment information (new segments)
- McKesson Earnings release Q3 FY2026
- McKesson Earnings release Q1 FY2027
- McKesson Quarterly report Q2 FY2027 (Sep 30, 2026)
- McKesson Earnings release Q2 FY2027 (8-K Ex. 99.1)
- McKesson Press release: agreement to acquire Option Care Health with CD&R
24Sources and changes
Where every number on this page comes from
Sources (30 documents)
- S1McKesson Annual report FY2026 (year ended Mar 31, 2026) · SEC EDGAR · Tier 1: company or exchange filing · May 8, 2026
- S2McKesson Annual report FY2025 · SEC EDGAR · Tier 1: company or exchange filing · May 9, 2025
- S3McKesson Annual report FY2024 · SEC EDGAR · Tier 1: company or exchange filing · May 8, 2024
- S4McKesson Annual report FY2023 · SEC EDGAR · Tier 1: company or exchange filing · May 9, 2023
- S5McKesson Annual report FY2022 · SEC EDGAR · Tier 1: company or exchange filing · May 9, 2022
- S6McKesson Quarterly report Q2 FY2027 (Sep 30, 2026) · SEC EDGAR · Tier 1: company or exchange filing · Nov 4, 2026
- S7McKesson Quarterly report Q1 FY2027 (Jun 30, 2026) · SEC EDGAR · Tier 1: company or exchange filing · Aug 5, 2026
- S8McKesson Quarterly report Q3 FY2026 (Dec 31, 2025) · SEC EDGAR · Tier 1: company or exchange filing · Feb 4, 2026
- S9McKesson Quarterly report Q2 FY2026 (Sep 30, 2025) · SEC EDGAR · Tier 1: company or exchange filing · Nov 6, 2025
- S10McKesson Quarterly report Q1 FY2026 (Jun 30, 2025) · SEC EDGAR · Tier 1: company or exchange filing · Aug 6, 2025
- S11McKesson Quarterly report Q3 FY2025 (Dec 31, 2024) · SEC EDGAR · Tier 1: company or exchange filing · Feb 6, 2025
- S12McKesson Quarterly report Q2 FY2025 (Sep 30, 2024) · SEC EDGAR · Tier 1: company or exchange filing · Nov 7, 2024
- S13McKesson Proxy statement 2026 (DEF 14A) · SEC EDGAR · Tier 1: company or exchange filing · Jun 12, 2026
- S14McKesson Earnings release Q2 FY2027 (8-K Ex. 99.1) · SEC EDGAR · Tier 1: company or exchange filing · Nov 4, 2026
- S15McKesson Earnings release Q1 FY2027 · SEC EDGAR · Tier 1: company or exchange filing · Aug 5, 2026
- S16McKesson Earnings release Q4 FY2026 · SEC EDGAR · Tier 1: company or exchange filing · May 7, 2026
- S17McKesson Earnings release Q3 FY2026 · SEC EDGAR · Tier 1: company or exchange filing · Feb 4, 2026
- S18McKesson Earnings release Q2 FY2026 · SEC EDGAR · Tier 1: company or exchange filing · Nov 5, 2025
- S19McKesson Earnings release Q1 FY2026 · SEC EDGAR · Tier 1: company or exchange filing · Aug 6, 2025
- S20McKesson Earnings release Q4 FY2025 · SEC EDGAR · Tier 1: company or exchange filing · May 8, 2025
- S21McKesson Earnings release Q3 FY2025 · SEC EDGAR · Tier 1: company or exchange filing · Feb 5, 2025
- S22McKesson Earnings release Q2 FY2025 · SEC EDGAR · Tier 1: company or exchange filing · Nov 6, 2024
- S23McKesson Supplemental historical segment information (new segments) · SEC EDGAR · Tier 1: company or exchange filing · Sep 18, 2025
- S24McKesson Investor Day press release · SEC EDGAR · Tier 1: company or exchange filing · Sep 23, 2025
- S25McKesson Press release: agreement to acquire Option Care Health with CD&R · SEC EDGAR · Tier 1: company or exchange filing · Oct 6, 2026
- S29McKesson 8-K Item 5.02 officer departure (event Jun 29, 2026; signed Jul 1, 2026) · SEC EDGAR · Tier 1: company or exchange filing · Jul 1, 2026
- S30McKesson 8-K Item 7.01 · SEC EDGAR · Tier 1: company or exchange filing · Aug 28, 2026
- S31McKesson 8-K Item 5.02 news release · SEC EDGAR · Tier 1: company or exchange filing · Mar 5, 2026
- S33McKesson 10-Q for Q1 FY2025 · SEC EDGAR · Tier 1: company or exchange filing · Aug 7, 2024
- S34McKesson 10-Q for Q3 FY2024 · SEC EDGAR · Tier 1: company or exchange filing · Feb 8, 2024
Changes to this page (v1 · Nov 20, 2026)
- v1 · Nov 20, 2026First version. (first version)
Numbers come only from tier 1 and tier 2 sources. Read how we research.
Disclaimer
For learning only. Cityfort is not a registered investment adviser or broker-dealer and does not recommend buying or selling any security. Prices shown are dated and may be out of date.
Investing in securities involves risk, including loss of capital. Before making any investment decision, do your own research and consider consulting a registered investment adviser or other qualified professional.
Cityfort, its owners and contributors may or may not hold securities of companies covered. Cityfort is not paid by any company it covers. Content is not an offer or solicitation to buy or sell any security, including in any initial public offering.
Read the positions policyRead the full disclaimerHide the full disclaimer
Cityfort publishes general educational content that explains how listed companies work. Cityfort is not registered with the US Securities and Exchange Commission or any state securities regulator as an investment adviser, and is not a broker-dealer or a member of FINRA. Cityfort does not provide investment, tax or legal advice, recommendations, ratings, price targets or any opinion on whether to buy, sell or hold any security. Nothing on the site is tailored to any person's circumstances.
All information is taken from publicly available sources, mainly company filings with the SEC, which are listed on each page with dates. We work to keep it accurate and correct errors publicly, but we do not guarantee that it is complete, accurate or up to date. Any market price or price-based ratio shown is dated, may be out of date by the time you read it, and is included only to explain concepts.
Statements by company management, including forward-looking statements and guidance, are reported as the company's statements, with their date and source; they are not our forecasts. Adjusted (non-GAAP) figures are the company's own measures and are shown next to the official (GAAP) figures.