Health Care · NYSE: COR
Cencora: how the business works
Cencora buys medicines from drug makers and delivers them to pharmacies, hospitals and doctors, mostly in the US, with revenue of $337.4 billion in FY2026.
By Hardik Bhandare · Checked against filings: . Editorial policy. Corrections
Follow Cencora
Email me when Cencora's page is updated after earnings.
We'll send a confirmation email first. See our privacy policy.
Cencora, Inc. · Conshohocken, Pennsylvania
Updated for Q4 FY2026 · checked
- Revenue, FY2026
- $337.4B
- Net income, FY2026 (incl. a $1.1B one-time gain)
- $3.48B
- Net income per $100 of revenue, FY2026
- $1.03
- Employees, Sep 30, 2025
- More than 51,000
- Directors and officers' holding, Nov 30, 2025 (Cityfort calculation from 2026 proxy statement)
- 0.38%
The short version
Cencora in 5 points
1 · What it sells
Cencora buys medicines in bulk from drug makers and delivers them to pharmacies, hospitals, clinics and doctors, mostly in the US; FY2026 revenue was $337.4 billion.
2 · Who pays it
In FY2026, drug wholesale customers paid 84.3% of Cencora's revenue, specialty-drug and doctor-practice customers 13.5%, and the animal-health and other businesses 2.6%.
3 · What it keeps from $100
Of every $100 that came in during FY2026, Cencora kept $1.03 as net income, including a $1.1 billion one-time gain on OneOncology; operating income was $3.9 billion.
4 · Where the operating profit comes from
Pharmaceutical Distribution and Services brought 84.3% of FY2026 revenue but kept 0.96% of it as operating income, while Specialty Pharmaceutical and Provider Services kept 3.73% on 13.5% of revenue.
5 · The one thing to watch
Borrowings reached $11.3 billion at Sep 30, 2026 after the OneOncology deal, and on Oct 21, 2026 Cencora, which holds about 4% of American Oncology Network, agreed to buy the rest at an enterprise value of $2.4 billion.
Sources: From Cencora's FY2025 10-K, its Q4 FY2026 earnings release and segment recast of Nov 4, 2026, and its Oct 21, 2026 deal announcement · checked
01Where the money goes · FY2026
Where does $100 of Cencora's money go?
Cencora · FY2026
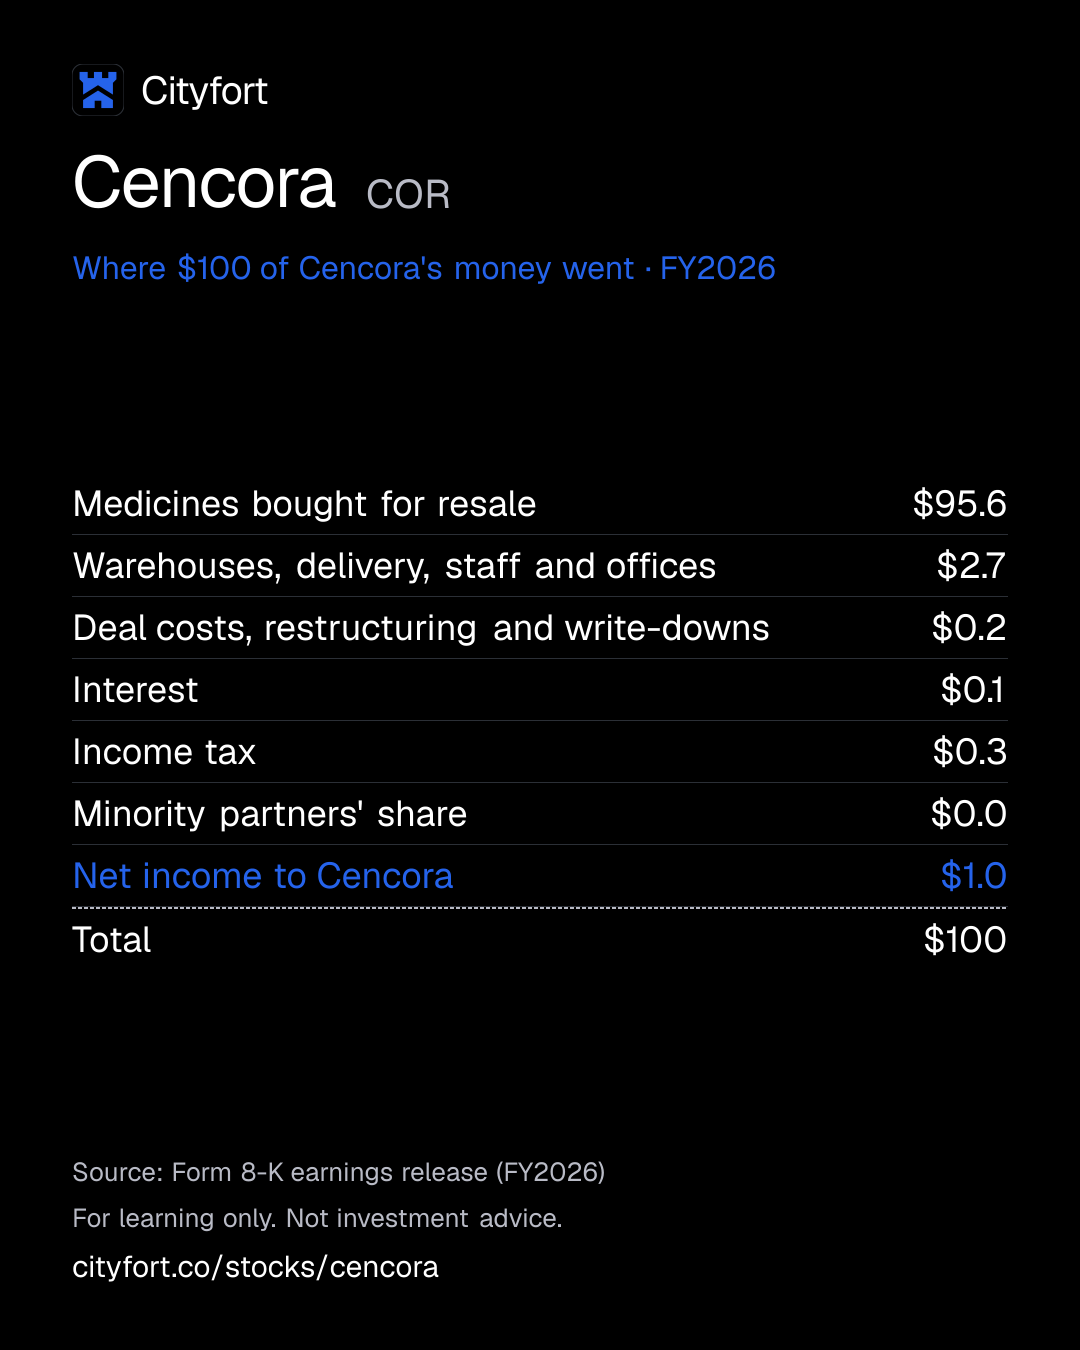
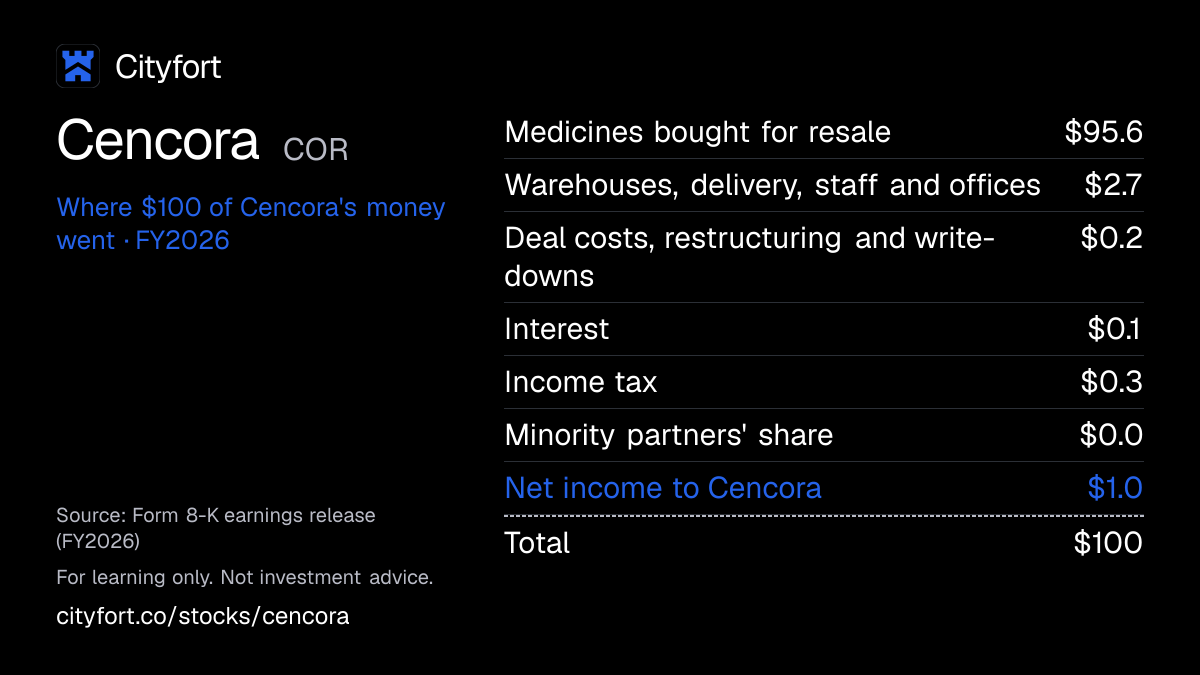
Receipt for every $100
| Medicines bought for resale | $95.6 |
|---|---|
| Warehouses, delivery, staff and offices | $2.7 |
| Deal costs, restructuring and write-downs | $0.2 |
| Interest | $0.1 |
| Income tax | $0.3 |
| Minority partners' share | $0.0 |
| Net income to Cencora | $1.0 |
| Total | $100 |
Each line = amount ÷ total money in × 100. Lines may not add to exactly $100 because of rounding.
How this is worked out
Cityfort calculation from Q4 FY2026 earnings release. Of every $100 that came in during FY2026 (revenue plus $1.1 billion of other income), each line = line ÷ $338.5 billion × 100. FY2026 figures are unaudited; the 10-K was not yet filed.
Save this receipt as an image
Embed this receipt or the key numbers
Paste this code into a blog or website to show the card you choose, with a link back to this page.
Each week: the next company due to report earnings, explained in 5 points.
No tips. Unsubscribe anytime.
We'll send a confirmation email. See our privacy policy.
02The business in one line
What does Cencora do?
Pharmacies, hospitals and doctors pay Cencora for the medicines it delivers; in FY2026, $95.57 of every $100 that came in went back to drug makers, and about $1 was left as net income.
- Drug wholesale customers paid 84.3% of FY2026 revenue, and Walgreens and Boots alone were about 25% of FY2025 revenue.
- Gross profit was $4.11 per $100 of FY2026 revenue; warehouses, delivery, staff and offices took $2.70 of it.
03Who pays it
Who pays Cencora?
Walgreens and Boots
25%
of revenue
The pharmacy chains of Walgreens Boots Alliance buy brand-name and generic medicines under a distribution agreement that runs to 2029.
Evernorth Health Services
13%
of revenue
The company's second-largest customer in FY2025, the 10-K says.
Other pharmacies, hospitals, clinics, doctors and vets
Share of revenue not disclosed
Independent and chain pharmacies, health systems, cancer and eye practices, and animal-health customers make up the rest.
- Walgreens and Boots25%
- Evernorth Health Services13%
Customer concentration
Walgreens and Boots were about 25% of FY2025 revenue and 38% of money owed to Cencora at Sep 30, 2025. The top 10 customers, including government agencies and buying groups, were about 66%.
- Largest customer
- 25%
- Top 10 customers
- 66%
04How it makes money
How does Cencora make money?
About $4 of gross profit per $100 of sales, on $337 billion of sales
Cencora resells medicines for slightly more than it pays, then spends most of that gap on warehouses and delivery. Profit grows with volume and with specialty drugs, which kept $11.76 of gross profit per $100 in FY2026 against $2.41 in drug wholesale.
Gross profit kept per $100 of revenue
$3.4$4.1
FY2023 to FY2026
- Drug makers sell medicines to Cencora in bulk
- Cencora stores them in its distribution centers
- It delivers smaller orders to pharmacies, hospitals and doctors
- Customers pay slightly more than Cencora paid
- More volume and more specialty drugs lift gross profit
- Cash funds buybacks, dividends and doctor-practice acquisitions
↺ Step 6 feeds back into step 1.
05Business segments · FY2026
Which businesses make up Cencora?
Pharmaceutical Distribution and Services
84.3%Drug wholesale, mainly in the US; operating income was 0.96% of FY2026 revenue.
Revenue $284.5B ($284,484M) · Operating profit $2.7B ($2,736M)
Specialty Pharmaceutical and Provider Services
13.5%Specialty drugs plus the RCA and OneOncology doctor platforms; operating income was 3.73% of revenue.
Revenue $45.4B ($45,391M) · Operating profit $1.7B ($1,693M)
Other
2.6%MWI Animal Health, the Profarma stake and other businesses. Cencora agreed in May 2026 to merge MWI with Covetrus and said on Nov 4, 2026 it had agreed to sell Profarma.
Revenue $8.7B ($8,740M) · Operating profit $393M
How the mix changed
- Pharmaceutical Distribution and Services
- Specialty Pharmaceutical and Provider Services
- Other
Revenue by segment, FY2025 to FY2026.
US$
See the numbers
06The numbers · Consolidated · US$
How has Cencora done?
Revenue
$337.4BFY2026
Revenue rose every year, from $214.0 billion in FY2021 to $337.4 billion in FY2026 (FY2026 from the unaudited Q4 earnings release).
US$
See the numbers
Net income
$3.5BFY2026
Net income rose to $3.5 billion in FY2026 from $1.6 billion, helped by a $1.1 billion one-time gain on its OneOncology stake.
US$
See the numbers
Net income for every $100 of revenue
$1.0FY2026
Cencora kept about $1.03 of net income per $100 of FY2026 revenue, because about $96 of every $100 pays for the medicines it resells.
Net margin: $ of net income per $100 of revenue
See the numbers
Free cash flow
$3.9BFY2026
Free cash flow was $3.9 billion in FY2026, up from $3.2 billion in FY2025, as cash from operations rose to $4.8 billion.
US$ · cash from operations minus spending on plants and equipment
See the numbers
See all yearly numbers
EBITDA here = operating income plus depreciation and amortization (from the cash flow statement). Fiscal years are the company's own: Fiscal year ends Sep 30 (it runs October to September). Net income is the share belonging to the company's owners.
Learn: Fiscal years that don't end in December: Nvidia's FY2027 explained · Stock-based compensation and dilution: pay that becomes shares
Sources (21)
- Form 10-K for FY2021
- Form 10-K for FY2022
- Form 10-K for FY2023
- Form 10-K for FY2024
- Form 10-K for FY2025
- Q4 FY2026 earnings release (8-K Exhibit 99.1)
- Form 10-Q for Q1 FY2024
- Form 10-Q for Q2 FY2024
- Form 10-Q for Q3 FY2024
- Q4 FY2025 earnings release (8-K Exhibit 99.1)
- Form 10-Q for Q1 FY2025
- Q1 FY2026 earnings release (8-K Exhibit 99.1)
- Form 10-Q for Q2 FY2025
- Q2 FY2025 earnings release (8-K Exhibit 99.1)
- Form 10-Q for Q3 FY2025
- Q3 FY2025 earnings release (8-K Exhibit 99.1)
- Form 10-Q for Q1 FY2026
- Form 10-Q for Q2 FY2026
- Q2 FY2026 earnings release (8-K Exhibit 99.1)
- Form 10-Q for Q3 FY2026
- Q3 FY2026 earnings release (8-K Exhibit 99.1)
07Who runs it
Who runs Cencora, and did they deliver?
Robert P. Mauch
President and CEO, director · since 2024
CEO since October 2024; he was chief operating officer from October 2022 to September 2024.
Eva C. Boratto
Executive Vice President and CFO · since 2026
Her appointment was announced with the Q3 FY2026 results; she signed the Aug 2026 credit agreement as CFO.
D. Mark Durcan
Independent Chair · since 2025
Chair since Oct 1, 2025, after Executive Chairman Steven H. Collis retired; lead independent director from March 2023.
What they said, and what happened
3 delivered · 1 too early to tell
Said on Nov 5, 2025
FY2026 adjusted EPS of $17.45 to $17.75.
DeliveredWhat happened
Adjusted EPS was $17.97, above the range; the company raised the range in May and August 2026.
Said on Nov 5, 2025
FY2026 adjusted free cash flowCash from operations minus spending on buildings and equipment. Learn more of $3.0 billion.
DeliveredWhat happened
Adjusted free cash flow was $3.8 billion.
Said on Nov 5, 2025
FY2026 revenue growth of 5% to 7%.
DeliveredWhat happened
Revenue grew 5.0%, at the bottom of the range. The range was raised to 7% to 9% in February 2026, then cut to 4% to 6% in May 2026.
Said on Nov 4, 2026
FY2027 adjusted EPS of $19.40 to $19.75.
Too early to tellWhat happened
FY2027 runs from Oct 1, 2026 to Sep 30, 2027.
Sources (8)
- Form 10-K for FY2025
- Q3 FY2026 earnings release (8-K Exhibit 99.1)
- Credit agreement (8-K Item 1.01, Aug 5, 2026)
- 2026 proxy statement (DEF 14A)
- Q4 FY2025 earnings release (8-K Exhibit 99.1)
- Q4 FY2026 earnings release (8-K Exhibit 99.1)
- Q2 FY2026 earnings release (8-K Exhibit 99.1)
- Q1 FY2026 earnings release (8-K Exhibit 99.1)
08What could go wrong
What could go wrong for Cencora?
- Concentration
One customer is a quarter of sales
Walgreens and Boots were about 25% of FY2025 revenue and 38% of money owed to Cencora. Sycamore Partners bought Walgreens Boots Alliance on Aug 28, 2025.
Watch Walgreens' share of revenue in the FY2026 10-K, and any change to the contracts that run to 2029.
- Pricing
Very thin margins
Gross profit was $4.11 per $100 of FY2026 revenue, and net income about $1. Small changes in drug prices or supplier terms move profit a lot.
Watch Gross profit per $100 in the next quarterly results.
- Legal
Opioid and other litigation
Long-term accrued litigation liability, mostly for opioid matters, was $3.7 billion at Sep 30, 2026.
Watch Accrued litigation liability and new verdicts in the 10-K.
- Debt
More debt and acquisition risk
Net debt rose to $6.4 billion after OneOncology (Cityfort calculation from Q4 FY2026 earnings release). It booked write-downs on PharmaLex of $418 million (FY2024) and $724 million (FY2025), and $249 million in FY2026 on its U.S. Consulting Services business, sold in April 2026.
Watch Further write-downs, and the cost of the pending American Oncology Network deal.
- Execution
Many moving parts at once
The MWI–Covetrus merger is under FTC review, Profarma is being sold, and new segments apply from Oct 1, 2026. Older segment figures do not compare directly.
Watch Closing dates for the MWI–Covetrus merger and the Profarma sale.
- Currency
Foreign currency
About 9% of FY2025 revenue came from outside the US, in currencies including the pound, euro and Turkish lira. Cencora recorded a Türkiye currency remeasurement expense of $53.9 million in FY2026.
Watch Currency effects in International results.
09Supporters vs. critics
What do supporters and critics point to?
What supporters point to
- Cencora's revenue grew every year from $214.0 billion in FY2021 to $337.4 billion in FY2026.
- Specialty Pharmaceutical and Provider Services operating income rose 23.5% in FY2026, to $1.69 billion from $1.37 billion (Cityfort calculation from the Nov 4, 2026 segment recast 8-K).
- Operating cash flow was $4.79 billion in FY2026, and operating income covered net interest 8.0 times (Cityfort calculation from Q4 FY2026 earnings release).
- Cencora paid $1.00 billion for buybacks in FY2026. On Nov 3, 2026 it declared a quarterly dividend of $0.66, up from $0.60.
- FY2026 adjusted EPS, the company's own measure, was $17.97, above the $17.45 to $17.75 range it gave on Nov 5, 2025.
What critics point to
- Walgreens and Boots were about 25% of FY2025 revenue and 38% of money owed to Cencora. Sycamore Partners bought Walgreens Boots Alliance on Aug 28, 2025.
- Margins are thin: gross profit was $4.11 per $100 of FY2026 revenue and net income about $1, including a one-time gain.
- Long-term accrued litigation liability was $3.7 billion at Sep 30, 2026.
- Net debt rose to $6.4 billion at Sep 30, 2026 from $3.3 billion a year earlier (Cityfort calculation from Q4 FY2026 earnings release). Goodwill and other intangibles were about six times equity.
- Cencora booked write-downs on PharmaLex of $418 million in FY2024 and $724 million in FY2025, and $249 million in FY2026 on its U.S. Consulting Services business, sold in April 2026.
10What to watch next
What should you watch next at Cencora?
Next event
Q1 FY2027 results
Date not announced yet.
Walgreens' share of revenue
Walgreens and Boots were about 25% of FY2025 revenue. The FY2026 10-K, not yet filed on Nov 20, 2026, will give the FY2026 share.
Deals closing
In its Nov 4, 2026 guidance Cencora assumed the Profarma sale closes in Q1 FY2027 and the MWI–Covetrus merger on Mar 31, 2027. On Oct 21, 2026 it agreed to buy the American Oncology Network shares it does not already own.
Borrowings
Borrowings were $11.3 billion at Sep 30, 2026, and net debt $6.4 billion (Cityfort calculation from Q4 FY2026 earnings release). Cencora said in its Oct 21, 2026 deal announcement that it expects to pay about $1.7 billion to raise its American Oncology Network stake to 75%, if other holders keep 25%.
Results against the company's range
Management said in the Nov 4, 2026 earnings release that it expects FY2027 revenue growth of 3% to 5% and adjusted EPS of $19.40 to $19.75.
11Key facts
Key facts about Cencora
- What does Cencora do?
- Cencora, Inc. (NYSE: COR), formerly AmerisourceBergen, buys medicines in bulk from drug makers and delivers them to pharmacies, hospitals, clinics and doctors, mostly in the US. Cencora also runs specialty-drug services for cancer and eye doctors.
- How does Cencora make money?
- Cencora resells medicines for slightly more than it pays for them. In FY2026 (the year to Sep 30, 2026) Cencora kept $4.11 of gross profit per $100 of revenue: $11.76 per $100 in specialty drugs and $2.41 in drug wholesale.
- Who are Cencora's customers?
- Walgreens and Boots were about 25% of Cencora's FY2025 revenue and Evernorth Health Services about 13%. Cencora's ten largest customers were about 66% of FY2025 revenue.
- How big is Cencora?
- Cencora's revenue was $337.4 billion in FY2026, up 5.0% from $321.3 billion in FY2025. Cencora's FY2026 net income was $3.5 billion, including a $1.1 billion one-time gain on OneOncology.
- Who owns Cencora?
- Cencora's 15 directors and executive officers held 743,823 shares at Nov 30, 2025, or 0.38% (Cityfort calculation from 2026 proxy statementThe yearly filing about shareholder votes, the board and executive pay. Learn more). The Vanguard Group held 11.6% and BlackRock 8.4%, according to the 2026 proxy.
- Who runs Cencora?
- Robert P. Mauch has been Cencora's President and CEO since October 2024. Eva C. Boratto became Cencora's CFO in 2026, and D. Mark Durcan has been independent chair since Oct 1, 2025.
- Does Cencora pay a dividend?
- Cencora paid dividends of $2.20 per share in FY2025, up from $1.94 in FY2023. On Nov 3, 2026 Cencora declared a quarterly dividend of $0.66 per share, payable Nov 30, 2026.
Terms on this page
- Capital expenditures (capex)
- Customer concentration
- Debt-to-equity
- Earnings per share (EPS)
- EBITDA
- Free cash flow
- Interest coverage
- Net debt
- Net margin
- Revenue vs net income
Each explains the term in plain English, with the same number from other companies on Cityfort.
Go deeper
More detail from the same filings. Open any section.
12What it sells
12What it sells
What does Cencora sell?
US drug wholesale
Brand-name and generic medicines delivered to pharmacies and health systems. Good Neighbor Pharmacy is its franchise program for independent pharmacies.
Specialty drugs and doctor services
Cancer, eye, plasma and vaccine products for clinics and specialists. It also owns RCA and OneOncology, which run the business side of eye and cancer practices.
International
Alliance Healthcare, a drug wholesaler in Europe, plus World Courier, which provides specialty transport and logistics for drug makers worldwide.
Other businesses
MWI Animal Health supplies vets and farms; a stake in Profarma, a Brazilian distributor, is being sold.
Think of it like this
Like a wholesale market for medicines: it buys in bulk from makers and resells in smaller lots to the places that treat patients.
What it does
- Does: Buys, stores and delivers medicines for pharmacies, hospitals and doctors
- Does: Runs the business side of some cancer and eye practices through RCA and OneOncology
- Does: Ships medicines and clinical-trial material through World Courier
What it does not do
- Does not: Does not discover drugs; it resells drug makers' products (it does run a private-label generics program)
- Does not: Does not own Walgreens, its largest customer; Walgreens is a separate company
13How the money flows
13How the money flows · FY2026
How does money flow through Cencora?
Money in
- Revenue$337.4B
- Other income (mostly a one-time OneOncology gain)$1.1B
The company
Cencora
$338.5B came in
Money out
- Medicines bought for resale$323.5B
- Warehouses, delivery, staff, offices and wear-and-tear$9.1B
- Deal costs, restructuring and write-downs, less litigation credits$814M
- Interest$490M
- Income tax$1.1B
- Minority partners' share$17.5M
- Net income to Cencora$3.5B
- Pharmacies, hospitals and doctors paid Cencora $337.4 billion in FY2026.
- About $323.5 billion went back to drug makers for the medicines it resold.
- Warehouses, delivery, staff and offices took $9.1 billion, including wear-and-tear of assets.
- Deal costs, restructuring, a write-down, interest and tax took another $2.4 billion.
- A $1.1 billion one-time gain on OneOncology helped leave $3.5 billion of net income.
14What it needs to run
14What it needs to run
What does Cencora need to run?
Drug makers' supply
The top 10 suppliers were about 57% of FY2025 purchases; none reached 10%.
Credit from suppliers
At Sep 30, 2026 it owed suppliers $58.0 billion, more than its $21.4 billion of medicines in stock.
Distribution network
A national distribution center in Columbus, Ohio, plus wholesale operations in 10 countries outside the US, from Canada to Turkey.
People
More than 51,000 employees at Sep 30, 2025, about 41% of them in the US.
Bank credit lines
A $7.0 billion multi-currency revolving credit line, amended on Aug 5, 2026, runs to July 2031.
15Where it sells
15Where it sells · FY2025
Where does Cencora sell?
- United States91%
- Outside the US (over 50 countries)9%
Sources (1)
16Competitors and what protects it
16Competitors and what protects it
Who does Cencora compete with?
McKesson
NYSE: MCK
Competes with Cencora in US drug distribution to pharmacies and health systems, according to the Cencora 10-K.
Cardinal Health
NYSE: CAH
The other national US drug distributor Cencora names in its US human-health business.
UPS Logistics
Named among Cencora's largest competitors in its FY2025 10-K.
What protects the business
Each strength is scored 1 (weak) to 5 (strong) for the business, with the reason. It is not a rating of the share.
- Scale4 of 5
Revenue was $337.4 billion in FY2026, and it buys from drug makers whose top 10 supply 57% of its purchases.
- Long customer contracts3 of 5
The Walgreens distribution agreement and generics buying arrangement both run to 2029.
- Specialty and doctor networks3 of 5
Specialty and provider services earned $11.76 of gross profit per $100 in FY2026, against $2.41 in drug wholesale.
Weak spot
Reliance on one customer
Walgreens and Boots were about 25% of FY2025 revenue. An oncology customer ended its contract in June 2025, which shows contracts can be lost.
17Where growth could come from
17Where growth could come from
Where could Cencora's growth come from?
On Nov 4, 2026, Cencora said it expects FY2027 revenue growth of 3% to 5% and adjusted EPS of $19.40 to $19.75 (its own non-GAAPThe company's own "adjusted" numbers, not the official (GAAP) ones. Always read them next to the official figure. Learn more measure). It assumes the Profarma sale closes in its first quarter and the MWI–Covetrus merger closes on Mar 31, 2027.
Specialty drugs and provider services
WorkingOperating income +23.5% in FY2026
Segment operating income rose to $1.69 billion from $1.37 billion on the recast basis (Cityfort calculation from the Nov 4, 2026 segment recast 8-K). In its Q4 FY2026 release (Nov 4, 2026), the company said it expects 18% to 21% growth in FY2027.
Status: Working, on track against what the company said.
Diabetes and weight-loss drugs (GLP-1)
MixedSales +$7.7 billion in FY2025
GLP-1 sales rose 26.9% in FY2025, the 10-K says. They carry lower margins, which offset part of the rise in US gross margin.
Status: Mixed, partly on track.
Doctor-practice platforms
NewOneOncology deal: $7.4 billion
Cencora took majority control of OneOncology on Feb 2, 2026. On Oct 21, 2026 it agreed to buy 75% of American Oncology Network, with 350+ cancer providers in 21 states, for about $1.7 billion.
Status: New, recently announced.
Narrower set of businesses
NewOther revenue: $8.7 billion in FY2026
It sold US Consulting Services in April 2026 and agreed to sell its Profarma stake. In its Q4 FY2026 release (Nov 4, 2026), the company said it expects the Other segment to bring in about $3.5 billion in FY2027.
Status: New, recently announced.
Status compares progress with what the company itself said it would do: Working = on track against what the company said; Mixed = partly on track; Behind = behind the company's own plan; New = recently announced; Early = too early to judge.
18The company's own measures (non-GAAP)
18The company's own measures · FY2026
What do Cencora's own measures show?
Official (GAAP): Diluted EPS (GAAP)
$17.95
Company's own measure: Adjusted diluted EPS, FY2026
$17.97
The two look almost equal by chance: adjusted EPS removes the $1.1 billion OneOncology gain but also adds back deal costs, restructuring and a $249 million write-down.
Official (GAAP): Operating income (GAAP)
$3.9B
Company's own measure: Adjusted operating income, FY2026
$4.8B
Equals the total of segment operating income; it leaves out amortization of acquired intangibles, LIFO inventory accounting, litigation, deal costs, restructuring and write-downs.
Official (GAAP): Cash from operations (GAAP)
$4.8B
Company's own measure: Adjusted free cash flow, FY2026
$3.8B
The company's own definition; it also reports free cash flow of $3,881 million before its adjustments.
These are the company's own measures, defined by the company. They are not comparable across companies, and they are not added together. Each sits beside the nearest official (GAAP) figure.
Learn: Non-GAAP measures: what a company's "adjusted" numbers leave out
19Financial strength and debt
19Financial strength · Sep 30, 2026
How much debt does Cencora have?
- Total debt$11.3B
- Cash and investments$4.9B
- Net debt (debt minus cash)$6.4B
- Net worth (shareholders' money)$3.7B
- Debt to equity
- 3.06×
- $ of debt for every $1 of shareholders' money
- Interest cover
- 8×
- how many times operating profit covers interest
- Net debt rose from $3.3 billion a year earlier (Cityfort calculation from Q4 FY2026 earnings release); $3.0 billion of senior notes and $1.5 billion of term loans paid for OneOncology.
- Unpaid bills to suppliers, $58.0 billion, are its largest liability and are not counted as debt.
- A further $3.7 billion was booked as long-term accrued litigation liability, also outside debt.
- Goodwill and other intangibles (the price paid for acquisitions above their asset value) reached $22.5 billion, about six times equity (Cityfort calculation from Q4 FY2026 earnings release).
- Interest coverage is FY2026 operating income of $3.9 billion divided by $490 million of net interest expense (Cityfort calculation from Q4 FY2026 earnings release).
- Equity of $3.7 billion includes minority partners; $3.9 billion of assets held for sale (businesses being sold) are not counted as cash.
20Who owns it
20Who owns it · ownership as of Nov 30, 2025
Who owns Cencora?
- Officers and directors (as a group), shares
- 0.4%
Share classes
Holders of 5% or more
From the company's proxy statement (DEF 14A), later Schedule 13G filings and the share counts on its latest annual or quarterly report. Each holder row shows the date of its own filing.
Learn: How to read a proxy statement (DEF 14A): Nvidia's 2026 proxy · Form 4 insider filings: who files, the codes and the footnotes
21What it does with profit
21What it does with profit
What does Cencora do with its profit?
Dividend per share
$2.20FY2025
Dividend paid for each share, by financial year.
$ per share
See the numbers
Buyback · Sep 30, 2023
FY2023: paid $1.18 billion for its own shares.
$1.2B
Buyback · Sep 30, 2024
FY2024: paid $1.49 billion for its own shares.
$1.5B
Buyback · Sep 30, 2025
FY2025: paid $435 million for 1.9 million shares.
$436M
Buyback · Sep 30, 2026
FY2026: paid $1.00 billion, finishing the March 2024 program and starting a new $2.0 billion one approved in May 2026.
$1.0B
22Governance signals
22Governance signals
What do Cencora's governance filings show?
- Auditor
- Ernst & Young LLP, since 1985
- Auditor changes
- None in the period covered
- Audit qualifications
- None reported
- Related-party dealings
- Walgreens Boots Alliance held over 5% of Cencora until June 2025, so its deals were related-party deals; they were about 25% of FY2025 revenue. Its board nominee, Ornella Barra, served from January 2015 to May 27, 2025.
- Credit rating
- No public credit rating found in a search of rating agency sites on Nov 20, 2026
Flags to know about
regulatory
Opioid settlement and lawsuits
Cencora is part of the national opioid Distributor Settlement Agreement, effective Apr 2, 2022. Its accrued litigation liability was $4.3 billion at Sep 30, 2025. A Baltimore jury verdict on Nov 12, 2024 put its share of compensatory damages at about $74 million, which the court later reduced. On Apr 24, 2026 the Maryland Supreme Court vacated the judgment and sent the case back, and on May 8, 2026 the City of Baltimore dismissed all claims against the company with prejudice.
regulatory
Federal investigations
Since July 2017 US Attorneys in New Jersey and New York have sent subpoenas. On Mar 3, 2022, prosecutors in Virginia told the company of a criminal investigation into MWI Veterinary Supply, its animal-health subsidiary.
23How it got here
23How it got here
How did Cencora get here?
2022
Crisis
National opioid settlement
The Distributor Settlement Agreement with US states took effect on Apr 2, 2022.
2023
Milestone
Renamed Cencora
AmerisourceBergen became Cencora on Aug 30, 2023 and its NYSE symbol became COR.
2024
Milestone
New CEO
Robert Mauch, previously chief operating officer, became CEO in October 2024.
2025
Business-model change
Bought into eye-care practices
It bought 85% of Retina Consultants of America on Jan 2, 2025 for $4.04 billion in cash plus other payments.
2025
Crisis
PharmaLex write-down
Cencora booked a $723.9 million goodwill write-down on PharmaLex in Q4 FY2025, a quarter with a $339.7 million net loss.
2025
Milestone
Walgreens changes hands
Sycamore Partners bought Walgreens Boots Alliance, its largest customer, on Aug 28, 2025.
2026
Business-model change
OneOncology
It took majority control of OneOncology, a cancer-practice platform, on Feb 2, 2026, valued at $7.39 billion in total.
2026
Business-model change
New segments and another cancer deal
From Oct 1, 2026 it reports drug distribution and specialty services separately. On Oct 21, 2026 it agreed to buy American Oncology Network.
Sources (7)
- Form 10-K for FY2025
- Form 10-K for FY2023
- Q4 FY2025 earnings release (8-K Exhibit 99.1)
- Form 10-Q for Q3 FY2026
- Revised reportable segments, FY2025 and FY2026 recast (8-K Exhibit 99.1, Nov 4, 2026)
- Q4 FY2026 earnings release (8-K Exhibit 99.1)
- American Oncology Network acquisition announcement (8-K Exhibit 99.1, Oct 21, 2026)
24Sources and changes
Where every number on this page comes from
Sources (25 documents)
- S1Form 10-Q for Q3 FY2026 · SEC EDGAR · Tier 1: company or exchange filing · Aug 5, 2026
- S2Form 10-Q for Q2 FY2026 · SEC EDGAR · Tier 1: company or exchange filing · May 6, 2026
- S3Form 10-Q for Q1 FY2026 · SEC EDGAR · Tier 1: company or exchange filing · Feb 4, 2026
- S4Form 10-K for FY2025 · SEC EDGAR · Tier 1: company or exchange filing · Nov 25, 2025
- S5Form 10-Q for Q3 FY2025 · SEC EDGAR · Tier 1: company or exchange filing · Aug 6, 2025
- S6Form 10-Q for Q2 FY2025 · SEC EDGAR · Tier 1: company or exchange filing · May 7, 2025
- S7Form 10-Q for Q1 FY2025 · SEC EDGAR · Tier 1: company or exchange filing · Feb 5, 2025
- S8Form 10-K for FY2024 · SEC EDGAR · Tier 1: company or exchange filing · Nov 26, 2024
- S9Form 10-Q for Q3 FY2024 · SEC EDGAR · Tier 1: company or exchange filing · Jul 31, 2024
- S10Form 10-Q for Q2 FY2024 · SEC EDGAR · Tier 1: company or exchange filing · May 1, 2024
- S11Form 10-Q for Q1 FY2024 · SEC EDGAR · Tier 1: company or exchange filing · Jan 31, 2024
- S12Form 10-K for FY2023 · SEC EDGAR · Tier 1: company or exchange filing · Nov 21, 2023
- S13Form 10-K for FY2022 · SEC EDGAR · Tier 1: company or exchange filing · Nov 22, 2022
- S14Form 10-K for FY2021 · SEC EDGAR · Tier 1: company or exchange filing · Nov 23, 2021
- S15Q4 FY2026 earnings release (8-K Exhibit 99.1) · SEC EDGAR · Tier 1: company or exchange filing · Nov 4, 2026
- S16Q3 FY2026 earnings release (8-K Exhibit 99.1) · SEC EDGAR · Tier 1: company or exchange filing · Aug 5, 2026
- S17Q2 FY2026 earnings release (8-K Exhibit 99.1) · SEC EDGAR · Tier 1: company or exchange filing · May 6, 2026
- S18Q1 FY2026 earnings release (8-K Exhibit 99.1) · SEC EDGAR · Tier 1: company or exchange filing · Feb 4, 2026
- S19Q4 FY2025 earnings release (8-K Exhibit 99.1) · SEC EDGAR · Tier 1: company or exchange filing · Nov 5, 2025
- S20Q3 FY2025 earnings release (8-K Exhibit 99.1) · SEC EDGAR · Tier 1: company or exchange filing · Aug 6, 2025
- S21Q2 FY2025 earnings release (8-K Exhibit 99.1) · SEC EDGAR · Tier 1: company or exchange filing · May 7, 2025
- S22Revised reportable segments, FY2025 and FY2026 recast (8-K Exhibit 99.1, Nov 4, 2026) · SEC EDGAR · Tier 1: company or exchange filing · Nov 4, 2026
- S23American Oncology Network acquisition announcement (8-K Exhibit 99.1, Oct 21, 2026) · SEC EDGAR · Tier 1: company or exchange filing · Oct 21, 2026
- S24Credit agreement (8-K Item 1.01, Aug 5, 2026) · SEC EDGAR · Tier 1: company or exchange filing · Aug 5, 2026
- S252026 proxy statement (DEF 14A) · SEC EDGAR · Tier 1: company or exchange filing · Jan 22, 2026
Changes to this page (v1 · Nov 20, 2026)
- v1 · Nov 20, 2026First version. (first version)
Numbers come only from tier 1 and tier 2 sources. Read how we research.
Disclaimer
For learning only. Cityfort is not a registered investment adviser or broker-dealer and does not recommend buying or selling any security. Prices shown are dated and may be out of date.
Investing in securities involves risk, including loss of capital. Before making any investment decision, do your own research and consider consulting a registered investment adviser or other qualified professional.
Cityfort, its owners and contributors may or may not hold securities of companies covered. Cityfort is not paid by any company it covers. Content is not an offer or solicitation to buy or sell any security, including in any initial public offering.
Read the positions policyRead the full disclaimerHide the full disclaimer
Cityfort publishes general educational content that explains how listed companies work. Cityfort is not registered with the US Securities and Exchange Commission or any state securities regulator as an investment adviser, and is not a broker-dealer or a member of FINRA. Cityfort does not provide investment, tax or legal advice, recommendations, ratings, price targets or any opinion on whether to buy, sell or hold any security. Nothing on the site is tailored to any person's circumstances.
All information is taken from publicly available sources, mainly company filings with the SEC, which are listed on each page with dates. We work to keep it accurate and correct errors publicly, but we do not guarantee that it is complete, accurate or up to date. Any market price or price-based ratio shown is dated, may be out of date by the time you read it, and is included only to explain concepts.
Statements by company management, including forward-looking statements and guidance, are reported as the company's statements, with their date and source; they are not our forecasts. Adjusted (non-GAAP) figures are the company's own measures and are shown next to the official (GAAP) figures.