Technology · NYSE: INFY
Infosys: how the business works
Infosys, an Indian company, builds and runs software and technology systems for large businesses, mostly in North America and Europe, with revenue of $20.2 billion in FY2026 (year ended Mar 31, 2026).
By Hardik Bhandare · Checked against filings: . Editorial policy. Corrections
Follow Infosys
Email me when Infosys's page is updated after earnings.
We'll send a confirmation email first. See our privacy policy.
Infosys Limited · Bengaluru, India · Founded 1981
Updated for Q2 FY2027 · checked
- Revenue, FY2026
- $20.16B
- Net profit, FY2026
- $3.31B
- Revenue, Q2 FY2027 ($5.08B a year earlier)
- $5.15B
- Employees, Sep 30, 2026
- 332,542
- Founded
- 1981
The short version
Infosys in 5 points
1 · What it sells
Infosys sells technology services, building and running software for 2,060 active clients at Sep 30, 2026, and earned $20.16 billion of revenue in FY2026, 54% of it from fixed-price contracts.
2 · Who pays it
Clients based in North America paid 56.1% of Infosys's FY2026 revenue, Europe 32.1%, the rest of the world 8.9% and India 2.9%.
3 · What it keeps from $100
Of every $100 that came in during FY2026, including $468 million of other income (mostly interest), Infosys kept $16.1 as net profit, while its operating profit was $20.3 per $100 of revenue.
4 · Where the operating profit comes from
Financial Services earned the most segment profit of Infosys's eight segments in FY2026, ahead of Retail at $799 million and Manufacturing at $726 million, out of $4,780 million before $695 million of costs not assigned to segments.
5 · The one thing to watch
Infosys lowered its FY2027 revenue growth range in constant currency twice, from 1.5% to 3.5% on Apr 23, 2026 to 1% to 2% on Oct 23, 2026, while large deals signed in Q2 FY2027 reached $5.2 billion.
Sources: From Infosys's Form 20-Fs for FY2026 and FY2024 and its Form 6-K results · checked
01Where the money goes · FY2026
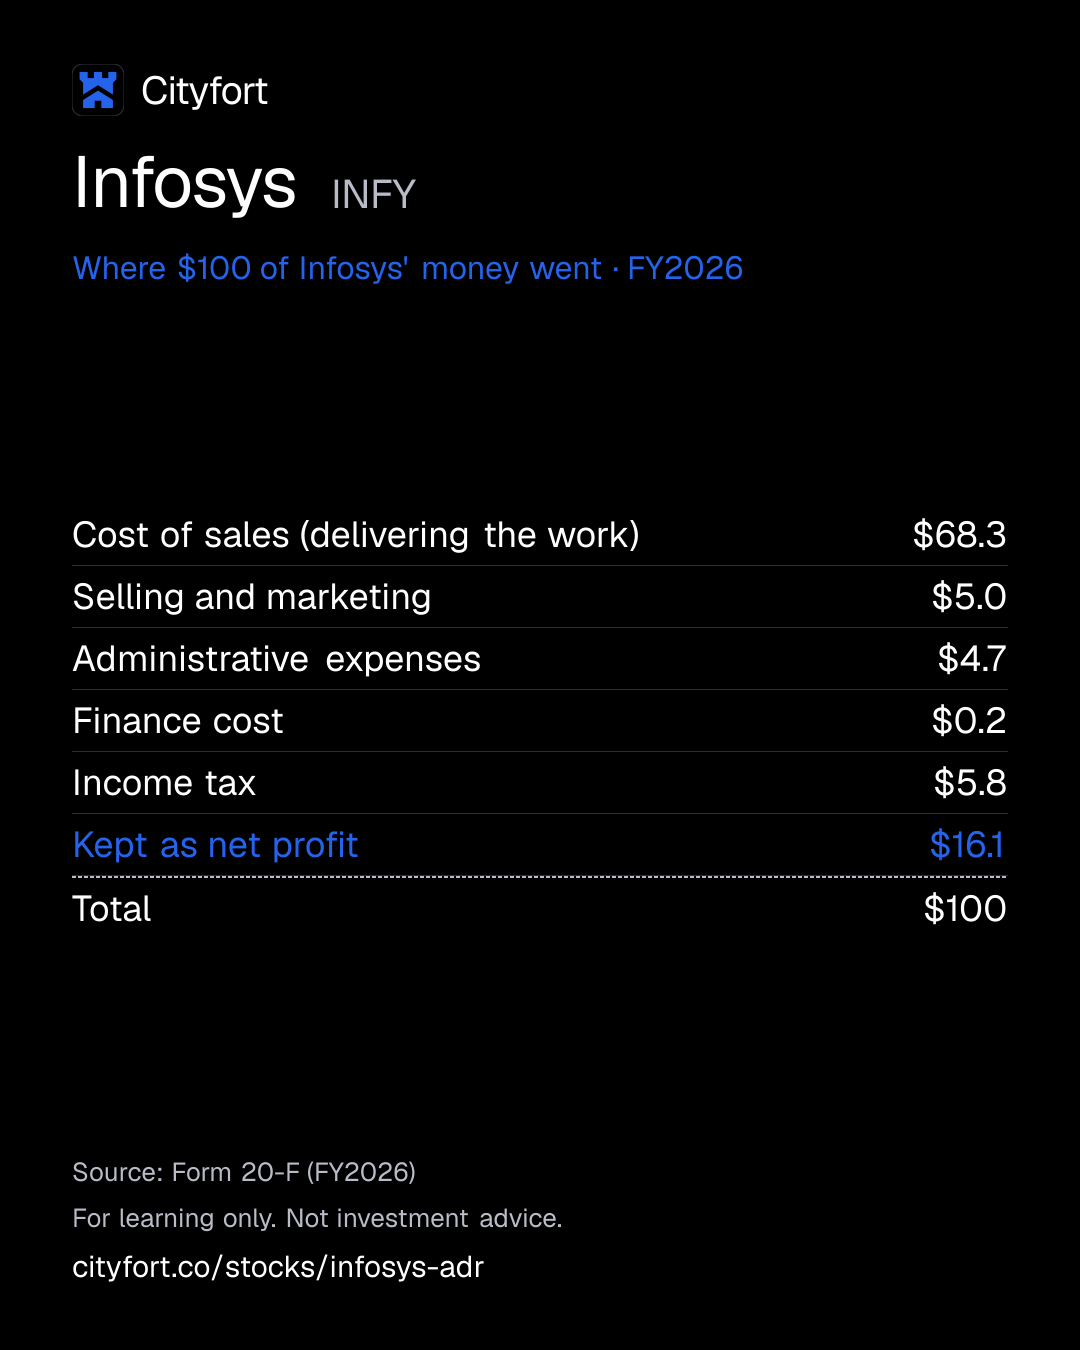
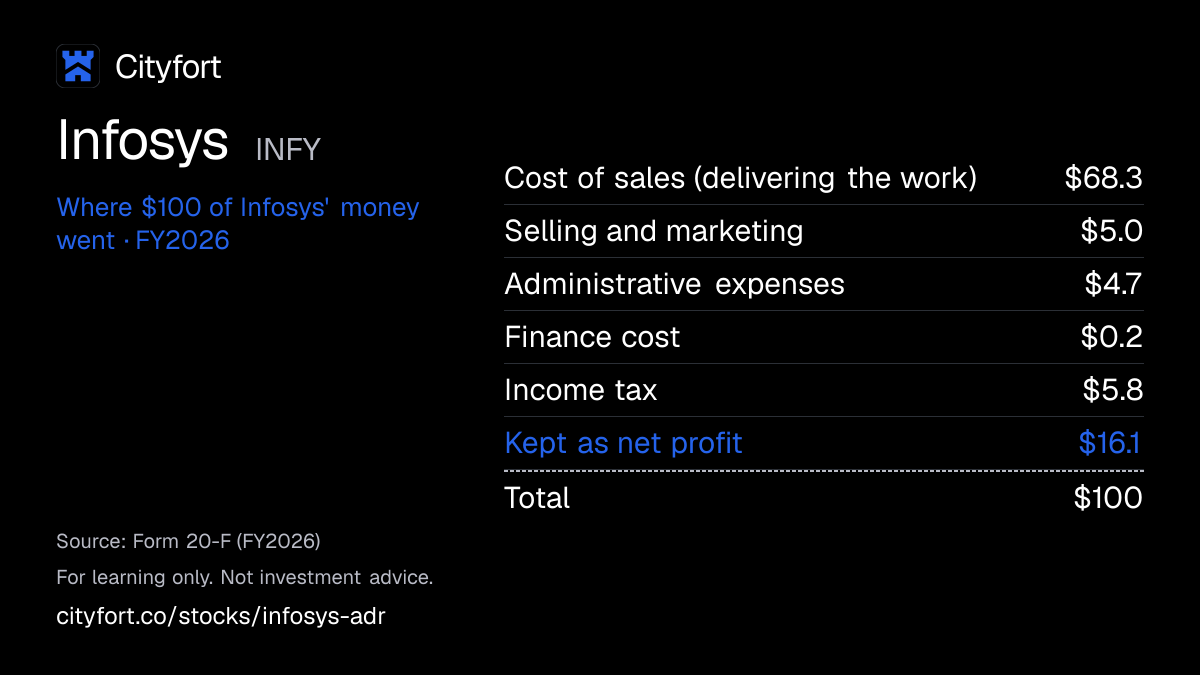
Where does $100 of Infosys' money go?
Infosys · FY2026
Receipt for every $100
| Cost of sales (delivering the work) | $68.3 |
|---|---|
| Selling and marketing | $5.0 |
| Administrative expenses | $4.7 |
| Finance cost | $0.2 |
| Income tax | $5.8 |
| Kept as net profit | $16.1 |
| Total | $100 |
Each line = amount ÷ total money in × 100. Lines may not add to exactly $100 because of rounding.
How this is worked out
Cityfort calculation from the FY2026 20-F. Of every $100 that came in during FY2026 (revenue of $20,158 million plus $468 million of other income): each line = line ÷ $20,626 million × 100. The $3 million share of minority owners rounds to zero and is left out; rounding makes the lines add to 100.1.
Save this receipt as an image
Embed this receipt or the key numbers
Paste this code into a blog or website to show the card you choose, with a link back to this page.
Each week: the next company due to report earnings, explained in 5 points.
No tips. Unsubscribe anytime.
We'll send a confirmation email. See our privacy policy.
02The business in one line
What does Infosys do?
Large companies pay Infosys to build and run their technology; most of that money goes on delivering the work, and in FY2026 Infosys kept $16.1 of every $100 that came in as net profit.
- Clients based in North America paid 56.1% of FY2026 revenue and clients in Europe 32.1%. No single client paid more than 10%.
- Revenue grew 4.6% in US dollars to $20.16 billion in FY2026, and net profit rose from $3.16 billion to $3.31 billion.
03Who pays it
Who pays Infosys?
Clients in North America
56.1%
of revenue
$11.30 billion of FY2026 revenue, by where the client is based. The share was 54.6% in Q2 FY2027.
Clients in Europe
32.1%
of revenue
$6.48 billion of FY2026 revenue, up from $5.75 billion in FY2025.
Clients in the rest of the world
8.9%
of revenue
$1.80 billion of FY2026 revenue.
Clients in India
2.9%
of revenue
$576 million of FY2026 revenue.
- Clients in North America56.1%
- Clients in Europe32.1%
- Clients in the rest of the world8.9%
- Clients in India2.9%
How spread out the customers are
No client paid more than 10% of revenue in FY2024, FY2025 or FY2026. The five largest clients paid 12.9% of FY2026 revenue and the ten largest about 20.5%. The Q2 FY2027 fact sheet gives 12.2% for the top five and 19.8% for the top ten, with 2,060 active clients at Sep 30, 2026.
- Top 5 customers
- 13%
- Top 10 customers
- 21%
04How it makes money
How does Infosys make money?
Infosys bills clients abroad for work done mostly away from their sites, and keeps about $20 to $23 of operating profit per $100 of revenue.
Delivering the work took $69.8 of every $100 of FY2026 revenue. Infosys's eight industry segments earned $4,780 million of segment profit in FY2026. Costs not assigned to segments, $695 million including depreciation and the $143 million labor code charge, left operating profit of $4,085 million.
Operating profit per $100 of revenue
$23.0$20.3
FY2022 to FY2026
- Clients sign project and multi-year contracts, including $14.9 billion of large deals in FY2026
- Infosys staffs them, with 77.4% of the work effort offshore in Q2 FY2027
- High utilization (85.4% excluding trainees) spreads costs over more billed work
- Operating profit was $20.3 per $100 of revenue in FY2026
- Cash from operations, $4.04 billion in FY2026, pays for dividends, buybacks and acquisitions
↺ Step 5 feeds back into step 1.
05Business segments · FY2026
Which businesses make up Infosys?
Financial Services
27.9%Banks, insurers and other financial firms. Segment profit was a 25.3% margin, and revenue grew 2.3% year on year in Q2 FY2027.
Revenue $5.6B ($5,631M) · Operating profit $1.4B ($1,427M)
Manufacturing
16.3%Manufacturing companies, at a 22.1% segment margin. Revenue fell 1.4% year on year in Q2 FY2027; the CFO cited lower revenue from a large client.
Revenue $3.3B ($3,282M) · Operating profit $726M
Energy, Utilities, Resources and Services
13.3%Energy, utility, natural resources and services companies, at a 25.1% segment margin. Revenue grew 7.4% year on year in Q2 FY2027.
Revenue $2.7B ($2,688M) · Operating profit $675M
Retail
12.9%Retail clients, at the highest segment margin, 30.7%. Revenue fell 8.1% year on year in Q2 FY2027, with lower third-party revenue and project ramp-downs, the CFO said.
Revenue $2.6B ($2,605M) · Operating profit $799M
Communication
12.2%Communication clients, at a 17.7% segment margin. Revenue grew 4.4% year on year in Q2 FY2027.
Revenue $2.5B ($2,455M) · Operating profit $434M
Hi-Tech
7.8%Technology companies, at a 23.1% segment margin. Revenue fell 17.5% year on year in Q2 FY2027.
Revenue $1.6B ($1,572M) · Operating profit $363M
Life Sciences
6.9%Life sciences clients, at a 20.0% segment margin. Revenue grew 32.5% year on year in Q2 FY2027. Infosys bought Optimum Healthcare IT on May 4, 2026.
Revenue $1.4B ($1,383M) · Operating profit $276M
All other
2.7%Other businesses, at a 14.8% segment margin.
Revenue $542M · Operating profit $80M
How the mix changed
- Financial Services
- Manufacturing
- Energy, Utilities, Resources and Services
- Retail
- Communication
- Hi-Tech
- Life Sciences
- All other
Revenue by segment, FY2024 to FY2026.
US$
See the numbers
06The numbers · Consolidated · US$
How has Infosys done?
Infosys files a Form 20-FThe annual report a foreign company listed in the US files with the SEC, in place of a 10-K. Learn more each year and furnishes quarterly results on Form 6-KHow a foreign company listed in the US furnishes the SEC with reports it publishes at home, such as quarterly results. It is not a 10-Q. Learn more, as a foreign private issuerA non-US company that the SEC lets file a 20-F instead of a 10-K. It files no US proxy statement. Learn more. Its financial statements follow IFRSInternational Financial Reporting Standards: accounting rules set by the International Accounting Standards Board. The SEC accepts them from foreign companies in place of US GAAP. (International Financial Reporting Standards, as issued by the IASB) and are reported in US dollars. Quarterly figures: IFRS as issued by the IASB, in US dollars, from the audited interim condensed statements (IAS 34) furnished on Form 6-K, audited under Indian auditing standards.
Infosys's 20-F statements use IFRS as issued by the IASB and are in US dollars, so the figures on this page are shown as filed, not converted. Its filings in India use another standard and are not used here.
Revenue
$20.2BFY2026
Revenue rose every year, from $16.3 billion in FY2022 to $20.2 billion in FY2026; Q2 FY2027 revenue of $5.15 billion compared with $5.08 billion a year earlier.
US$
See the numbers
Net income
$3.3BFY2026
Net profit for shareholders rose from $2.96 billion in FY2022 to $3.31 billion in FY2026. It dipped to $747 million in Q3 FY2026, the quarter with a one-time $143 million charge for India's new labor codes.
US$
See the numbers
Net income for every $100 of revenue
$16.4FY2026
EBITDA per $100 of revenue fell from $25.9 in FY2022 to $23.0 in FY2026; EBITDA is a Cityfort calculation from the Form 20-Fs (operating profit plus depreciation and amortization), as Infosys reports none.
Net margin: $ of net income per $100 of revenue
See the numbers
Free cash flow
$3.7BFY2026
Free cash flow (cash from operations minus capital spending) was $3.73 billion in FY2026, 1.1 times net profit; stock-based compensation was $108 million, about 0.5% of revenue.
US$ · cash from operations minus spending on plants and equipment
See the numbers
See all yearly numbers
EBITDA here = operating income plus depreciation and amortization (from the cash flow statement). Fiscal years are the company's own: Mar 31 (fiscal 2026 = Apr 1, 2025 to Mar 31, 2026). EPS is per equity share, as filed. One American depositary share (ADS) represents one equity share. Deutsche Bank Trust Company Americas is the depositary, and the ADSs trade on the New York Stock Exchange. So earnings per ADS equal earnings per share. Net income is the share belonging to the company's owners.
Learn: Fiscal years that don't end in December: Nvidia's FY2027 explained · Stock-based compensation and dilution: pay that becomes shares
Sources (6)
- Form 20-F for FY2024 (year ended March 31, 2024)
- Form 20-F for FY2026 (year ended March 31, 2026)
- Form 6-K: Q3 FY2026 audited interim condensed financial statements, IFRS, US$ (Exhibit 99.7)
- Form 6-K: Q4 FY2026 audited condensed financial statements, IFRS, US$ (Exhibit 99.7)
- Form 6-K: Q1 FY2027 audited interim condensed financial statements, IFRS, US$ (Exhibit 99.7)
- Form 6-K: Q2 FY2027 audited interim condensed financial statements, IFRS, US$ (Exhibit 99.7)
07Who runs it
Who runs Infosys, and did they deliver?
Nandan M. Nilekani
Chairman (non-executive) · since 2017
Co-founded Infosys in 1981 and became chairman on Aug 24, 2017. He took no pay in FY2026.
Salil Parekh
Chief Executive Officer and Managing Director · since 2018
CEO since Jan 2, 2018; his current term ends Mar 31, 2027. FY2026 pay: salary of $900,984, bonus and incentive of $2,589,044, and 361,575 restricted stock units granted, valued at $6,498,878.
Jayesh Sanghrajka
Chief Financial Officer
What they said, and what happened
2 delivered · 2 too early to tell
Said on Jan 14, 2026
Infosys guided FY2026 revenue growth of 3.0% to 3.5% in constant currency, after revising its range.
DeliveredWhat happened
Revenue grew 3.1% in constant currency in FY2026, within the range.
Said on Jan 14, 2026
Infosys guided an FY2026 operating margin of 20% to 22%.
DeliveredWhat happened
The reported operating margin was 20.3%, and 21.0% without the labor code charge.
Said on Apr 23, 2026
Infosys guided FY2027 revenue growth of 1.5% to 3.5% in constant currency and an operating margin of 20% to 22%.
Too early to tellWhat happened
Infosys lowered the growth range to 1.5% to 3.0% on Jul 23, 2026 and to 1% to 2% on Oct 23, 2026, keeping the margin range. Fiscal 2027 ends Mar 31, 2027.
Said on Oct 23, 2026
Management said the deal worth over $2 billion signed in Q2 FY2027 is expected to add over 1% to revenue growth in the next fiscal yearThe company's own 12-month year, which may not end in December. Learn more, with the transition starting late in Q4 FY2027.
Too early to tellWhat happened
The next fiscal year is FY2028, which starts Apr 1, 2027.
Sources (6)
- Form 20-F for FY2026 (year ended March 31, 2026)
- Form 6-K: Q3 FY2026 results press release (Exhibit 99.2)
- Form 6-K: Q4 FY2026 and FY2026 results press release (Exhibit 99.2)
- Form 6-K: Q1 FY2027 results press release (Exhibit 99.2)
- Form 6-K: Q2 FY2027 results press release (Exhibit 99.2)
- Form 6-K: Q2 FY2027 earnings call transcript, Oct 23, 2026 (Exhibit 99.5)
08What could go wrong
What could go wrong for Infosys?
- Concentration
A few large clients matter
The 20-F lists losing a large client or contract as a risk. The five largest clients paid 12.9% of FY2026 revenue, though none paid more than 10%.
Watch The top-five client share in each quarter's fact sheet: 12.2% in Q2 FY2027.
- Pricing
Prices under pressure
The 20-F names intense competition and commitments to pass AI-driven productivity gains to clients as risks. On Oct 23, 2026 the CFO cited pricing pressure from competitive intensity.
Watch Operating margin against the 20% to 22% range Infosys gave for FY2027.
- Technology
AI spending may not pay off
Infosys's AI investments may not succeed, the 20-F says, and AI carries legal and reputational risks. AI-related work was 10.5% of Q2 FY2027 revenue, a company measure.
Watch The AI revenue share Infosys reports each quarter.
- Execution
Wage costs
Costs are hard to predict, the 20-F says, citing wage pressure and reliance on subcontractors. The CFO said on Oct 23, 2026 that pay increases would weigh on second-half margins.
Watch Operating margin in Q3 and Q4 FY2027.
- Currency
Rupee and dollar swings
The 20-F lists currency moves, chiefly the Indian rupee against the US dollar, as a risk, and says the ADSA certificate a US bank (the depositary) issues for shares of a foreign company that it holds. It trades in US dollars on a US exchange, and one may stand for more than one share. Learn more price and US$ dividends move with that exchange rate. Exports were 97.1% of FY2026 revenue.
Watch Growth in constant currency against growth in US dollars: 3.1% against 4.6% in FY2026.
- Execution
Fixed-price work can overrun
Fixed-price contracts brought in 54% of FY2026 revenue. The 20-F says cost overruns on such contracts can cut profit.
Watch The fixed-price share in the next 20-F.
- Demand
Clients can walk away
Clients can typically end contracts without cause, according to the 20-F. In Q2 FY2027 revenue from Hi-Tech clients fell 17.5% and from Retail clients 8.1% year on year.
Watch Revenue change by industry in each quarter's fact sheet.
- Technology
Cyber incidents
The 20-F lists data and cybersecurity incidents as a risk. It reports a November 2023 ransomware incident at its subsidiary Infosys McCamish Systems, and a $17.5 million class action settlement accrued in FY2025.
Watch Incident disclosures in Form 6-K filings.
- Regulation
US visa rules and an investigation
The 20-F lists changes to US immigration rules for H-1B and L-1 visas as a risk. It also reports a Department of Justice investigation into how certain H-1B employees were classified.
Watch Updates on the investigation in the next 20-F.
- Governance
ADS holders have fewer rights
The 20-F says ADS holders have limited voting rights. They could join the December 2025 buyback only by first converting ADSs into equity shares.
Watch The terms for ADS holders in any future buyback.
Sources (5)
09Supporters vs. critics
What do supporters and critics point to?
What supporters point to
- Revenue rose every year from FY2022 to FY2026, to $20.16 billion, and net profit reached $3.31 billion.
- Infosys had no borrowings at Sep 30, 2026, and free cash flow was $3.73 billion in FY2026.
- No client paid more than 10% of revenue in FY2024 to FY2026.
- Large deals signed in Q2 FY2027 were worth $5.2 billion by the company's count, 62% net new work.
- It returned $4,139 million to shareholders in FY2026 through dividends and a buyback.
What critics point to
- Infosys lowered its FY2027 growth range twice, to 1% to 2% in constant currency on Oct 23, 2026.
- Operating profit per $100 of revenue fell from $23.0 in FY2022 to $20.3 in FY2026.
- In Q2 FY2027 revenue from Hi-Tech clients fell 17.5% and from Retail clients 8.1% year on year.
- The CFO cited pricing pressure and the sharing of AI-driven productivity gains with clients on Oct 23, 2026.
- Its own cash and investments measure fell from $6,173 million at Sep 30, 2025 to $4,720 million at Sep 30, 2026. Its FY2026 dividends and buyback came to 111% of FY2026 free cash flow.
10What to watch next
What should you watch next at Infosys?
Next event
Q3 FY2027 results (quarter ending Dec 31, 2026)
Date not announced yet.
FY2027 against Infosys's range
Infosys said on Oct 23, 2026 that it expects FY2027 revenue growth of 1% to 2% in constant currency. Growth was 1.5% in Q2 FY2027.
Margins after pay rises
The CFO named pay increases and the ramp-up of large deals as pressures on second-half margins on Oct 23, 2026. Infosys's FY2027 operating margin range is 20% to 22%.
The deal worth over $2 billion
Management said on Oct 23, 2026 that the transition starts late in Q4 FY2027, and that it expects the deal to add over 1% to growth in the following fiscal year.
11Key dates
What are the key dates for Infosys?
| Event | Date | Source |
|---|---|---|
| Fiscal 2027 endsInfosys's fiscal year runs from Apr 1 to Mar 31. | Form 20-F for FY2026 (year ended March 31, 2026) | |
| Salil Parekh's current term as CEO and managing director endsTerm end as shown in the FY2026 20-F's table of directors. | Form 20-F for FY2026 (year ended March 31, 2026) |
Learn: Fiscal years that don't end in December: Nvidia's FY2027 explained
12Key facts
Key facts about Infosys
- What does Infosys do?
- Infosys is an Indian IT services company based in Bengaluru. It builds, changes and runs software and technology systems for large businesses, and had 2,060 active clients and 332,542 employees at Sep 30, 2026.
- How does Infosys make money?
- Infosys makes money by charging clients for its staff's work, on fixed-price contracts or for the time spent. Fixed-price contracts brought in 54% of its FY2026 revenue of $20.16 billion.
- Who are Infosys's customers?
- Infosys's customers are large businesses. In FY2026 clients in North America paid 56.1% of its revenue, Europe 32.1%, the rest of the world 8.9% and India 2.9%; financial services firms were its largest industry group at 27.9%.
- How big is Infosys?
- Infosys had revenue of $20.16 billion and net profit of $3.31 billion in FY2026 (year ended Mar 31, 2026), with 328,594 employees at Mar 31, 2026.
- Is Infosys profitable?
- Yes. Infosys's net profit was $3.31 billion in FY2026, $16.4 for every $100 of revenue, and it has been profitable in every year from FY2022 to FY2026.
- What is an Infosys ADS?
- An Infosys American depositary share (ADS) trades on the New York Stock Exchange under the ticker INFY. Each ADS represents one Infosys equity share, held by the depositary, Deutsche Bank Trust Company Americas, according to the FY2026 20-F.
- Who owns Infosys?
- On May 20, 2026, Life Insurance Corporation of India held 10.81% of Infosys's equity shares and its directors and officers 2.53% as a group. Foreign institutional and portfolio investors and non-resident Indians held 26.10% combined, according to the FY2026 20-F.
- Does Infosys have debt?
- Infosys had no borrowings at Sep 30, 2026. Its cash and investments were $4.85 billion and its lease liabilities $890 million (Cityfort calculation from the Q2 FY2027 Form 6-K).
- What were Infosys's latest quarterly results?
- In Q2 FY2027 (quarter ended Sep 30, 2026), Infosys's revenue was $5.15 billion, up from $5.08 billion a year earlier, and net profit was $817 million, down from $839 million.
- Does Infosys pay dividends?
- Yes. Infosys recognized dividends of $0.52 per share in FY2026, and declared an interim dividend of $0.27 per share with its Q2 FY2027 results. One ADS represents one share.
Sources (5)
- Form 20-F for FY2026 (year ended March 31, 2026)
- Form 6-K: Q2 FY2027 fact sheet (Exhibit 99.4)
- Form 20-F for FY2024 (year ended March 31, 2024)
- Form F-6 POS (post-effective amendment no. 1) filed by Deutsche Bank Trust Company Americas for the Infosys ADSs
- Form 6-K: Q2 FY2027 audited interim condensed financial statements, IFRS, US$ (Exhibit 99.7)
Terms on this page
- Capital expenditures (capex)
- Customer concentration
- Debt-to-equity
- Earnings per share (EPS)
- EBITDA
- Free cash flow
- Market cap
- Net debt
- Net margin
- Operating margin
Each explains the term in plain English, with the same number from other companies on Cityfort.
Go deeper
More detail from the same filings. Open any section.
13What it sells
13What it sells
What does Infosys sell?
Technology services by industry
Work organized around eight client industries. Financial services firms were the largest, paying $5.63 billion of FY2026 revenue.
Large multi-year deals
Contracts Infosys counts as large deals were worth $14.9 billion in FY2026, a company measure. In Q2 FY2027 they included a 7-year deal worth over $2 billion with a financial services client.
AI work
Infosys said AI-related work made up 10.5% of its Q2 FY2027 revenue, a company measure.
Acquired specialist firms
In FY2027 it bought Stratus Global, a US insurance technology firm, for $74 million, and Optimum Achieve Holdings (Optimum Healthcare IT) for $365 million, including $66 million of contingent payments.
Think of it like this
Like a very large contractor that companies hire to build and look after their technology, paid by the project or by the hour.
What it does
- Does: Builds and maintains software for clients
- Does: Does 77.4% of its work effort offshore, away from client sites (Q2 FY2027)
- Does: Takes fixed-price contracts, 54% of FY2026 revenue
What it does not do
- Does not: Depend on one client for more than 10% of revenue (none in FY2024 to FY2026)
- Does not: Borrow money: it reported no borrowings at Mar 31, 2026
- Does not: Earn much in India: clients there paid 2.9% of FY2026 revenue
14How the money flows
14How the money flows · FY2026
How does money flow through Infosys?
Money in
- Revenue from clients$20.2B
- Other income, net (mostly interest on investments)$468M
The company
Infosys
$20.6B came in
Money out
- Cost of sales (delivering the work, including staff costs and depreciation)$14.1B
- Selling and marketing$1.0B
- Administrative expenses$969M
- Finance cost$47M
- Income tax$1.2B
- Share of minority owners$3M
- Net profit attributable to Infosys shareholders$3.3B
- Clients paid Infosys $20.16 billion in FY2026 for technology services.
- Delivering the work, including staff costs and depreciation, cost $14.08 billion.
- Selling and marketing took $1.03 billion and administration $969 million, leaving operating profit of $4.09 billion.
- Other income, mostly interest on investments, added $468 million. Finance cost took $47 million and income tax $1.19 billion.
- What was left, $3.31 billion, was net profit for Infosys's shareholders.
15What it needs to run
15What it needs to run
What does Infosys need to run?
People
332,542 employees at Sep 30, 2026. Utilization, the share of staff time billed to clients excluding trainees, was 85.4% in Q2 FY2027, and voluntary attrition in IT services was 12.7% over the last 12 months.
A hiring system
In FY2026 Infosys received 5,884,480 job applications, interviewed 450,901 people and made 87,286 offers.
Long client relationships
42 clients were in its $100 million-plus revenue band at Sep 30, 2026, and 1,048 in the $1 million-plus band (company counts).
Research and patents
Research and development expense was $207 million in FY2026, up from $153 million in FY2025. Infosys had 973 patents pending or registered.
16Where growth could come from
16Where growth could come from
Where could Infosys' growth come from?
Infosys said on Oct 23, 2026 that it expects FY2027 revenue growth of 1% to 2% in constant currency (at the previous year's exchange rates) and an operating margin of 20% to 22%. It had given 1.5% to 3.5% on Apr 23, 2026 and lowered that to 1.5% to 3.0% on Jul 23, 2026. The CFO said the cut reflected softer-than-expected results in the first half.
Large deals
Working$5.2B signed in Q2 FY2027
19 large deals in Q2 FY2027, 62% net new work, including a 7-year deal worth over $2 billion with a financial services client. Management said on Oct 23, 2026 it expects that deal to add over 1% to revenue growth next fiscal year.
Status: Working, on track against what the company said.
AI work
Early10.5% of Q2 FY2027 revenue
Infosys's own measure of AI-related revenue rose from 8.2% in Q1 FY2027 to 10.5% in Q2 FY2027.
Status: Early, too early to judge.
Financial services and energy clients
Working+2.3% and +7.4% in Q2 FY2027
The CFO said on Oct 23, 2026 that Financial Services and Energy, Utilities, Resources and Services are expected to grow faster than the company average.
Status: Working, on track against what the company said.
Acquisitions
New$340M spent in the half to Sep 30, 2026
Infosys bought Stratus Global and Optimum Healthcare IT in FY2027. A deal for 75% of Telstra Purple in Australia, worth up to AUD 233 million, was still awaiting approvals.
Status: New, recently announced.
Retail, Hi-Tech and Manufacturing
Behind-8.1%, -17.5% and -1.4% in Q2 FY2027
Revenue from these three industry groups fell year on year in Q2 FY2027. The CFO also named tight discretionary spending by communication clients.
Status: Behind, behind the company's own plan.
Status compares progress with what the company itself said it would do: Working = on track against what the company said; Mixed = partly on track; Behind = behind the company's own plan; New = recently announced; Early = too early to judge.
Sources (6)
- Form 6-K: Q2 FY2027 results press release (Exhibit 99.2)
- Form 6-K: Q2 FY2027 earnings call transcript, Oct 23, 2026 (Exhibit 99.5)
- Form 6-K: Q1 FY2027 results press release (Exhibit 99.2)
- Form 6-K: Q4 FY2026 and FY2026 results press release (Exhibit 99.2)
- Form 6-K: Q2 FY2027 fact sheet (Exhibit 99.4)
- Form 6-K: Q2 FY2027 audited interim condensed financial statements, IFRS, US$ (Exhibit 99.7)
17The company's own measures (non-GAAP)
17The company's own measures · FY2026 (year ended Mar 31, 2026), unless stated
What do Infosys' own measures show?
Official (IFRS): Operating profit (IFRS), FY2026
$4.1B
Company's own measure: Adjusted operating profit, FY2026
$4.2B
Infosys leaves out a one-time $143 million increase in gratuity and leave liabilities after India notified new labor codes on Nov 21, 2025.
Official (IFRS): Operating margin (IFRS), FY2026
20.3%
Company's own measure: Adjusted operating margin, FY2026
21.0%
Same adjustment: the labor code charge is left out.
Official (IFRS): Operating margin (IFRS), Q3 FY2026
18.4%
Company's own measure: Adjusted operating margin, Q3 FY2026
21.2%
The whole $143 million labor code charge fell in Q3 FY2026, the quarter ended Dec 31, 2025.
Official (IFRS): Revenue growth in US dollars (IFRS), FY2026
4.6%
Company's own measure: Revenue growth in constant currency, FY2026
3.1%
Infosys restates this year's revenue at the previous year's exchange rates, so currency moves are left out. Its guidance uses this measure.
Official (IFRS): Revenue (IFRS), FY2026
$20.2B
Company's own measure: Large deal total contract value, FY2026
$14.9B
Infosys's own count of the value of large deals signed in the year, 55% of it net new work. It is not revenue and is never added to it.
Official (IFRS): Net cash from operating activities (IFRS), FY2026
$4.0B
Company's own measure: Free cash flow (Infosys's definition), FY2026
$3.7B
Infosys subtracts $306 million of spending on property, plant and equipment and intangibles, the same method as "The numbers"; it reported "$3.7 billion".
These are the company's own measures, defined by the company. They are not comparable across companies, and they are not added together. Each sits beside the nearest official (IFRS) figure.
Learn: Non-GAAP measures: what a company's "adjusted" numbers leave out
18Financial strength and debt
18Financial strength · Sep 30, 2026
How much debt does Infosys have?
- Total debt$0M
- Cash and investments$4.9B
- Net cash (cash minus debt)$4.9B
- Net worth (shareholders' money)$10.3B
- Debt to equity
- 0×
- $ of debt for every $1 of shareholders' money
- Cash and investments is a Cityfort calculation from the Q2 FY2027 Form 6-K: cash of $2,541 million plus current investments of $1,436 million and non-current investments of $875 million. Infosys's own measure, "consolidated cash and investments", was $4,720 million; it leaves out some holdings such as equity and preference shares.
- Infosys's own measure was $6,173 million a year earlier, at Sep 30, 2025. In between, it paid $2,006 million for a share buyback completed on Dec 4, 2025.
- Lease liabilities of $890 million are not counted as debt here. At Mar 31, 2026 they were $967 million, and cash and investments $4,648 million on the same basis as above (Cityfort calculation from the FY2026 20-F).
- Goodwill rose from $1,278 million at Mar 31, 2026 to $1,551 million at Sep 30, 2026, after two acquisitions. Total assets were $17,060 million and equity attributable to shareholders $10,333 million.
19Who owns it
19Who owns it · ownership as of May 20, 2026
Who owns Infosys?
- Officers and directors (as a group), shares
- 2.5%
Share classes
Holders of 5% or more
One American depositary share (ADS) represents one equity share. Deutsche Bank Trust Company Americas is the depositary, and the ADSs trade on the New York Stock Exchange. Each ADS holder owns the shares through the depositary, so the ADSs are not a separate share class.
From the company's annual report on Form 20-F (Items 6.E and 7.A), later Schedule 13G filings and the share count in that report. Each holder row shows the date of its own filing.
Insider trades · Form 4 data as of Nov 17, 2026
What did Infosys' insiders report trading?
Infosys' insiders made 8 Form 4A filing an insider must make within two business days of buying or selling the company's shares. Learn more filings in the 12 months to Nov 17, 2026.
They reported no purchases and 4 sales (108,576 shares) in the open market or privately (codes P and S).
None of the sales were on forms with the Rule 10b5-1 plan box checked.
The same filings report 4 other share transactions (M: 4).
They also report 10 transactions in options, stock units or other derivatives.
Insiders are a company's officers, directors and owners of more than 10% of a class of its shares. Most changes in their holdings must be reported to the SEC on a Form 4 within two business days. Source: SEC Form 4 filings on EDGAR.
- P
- a purchase in the open market or privately
- S
- a sale in the open market or privately
- M
- exercise or conversion of an option or other derivative, exempt under Rule 16b-3
Code meanings: General Instruction 8 of Form 4 (SEC).
All 8 transactions
Shares: A = acquired, D = disposed of. A price the filing gives only in a footnote shows as “See filing”. The 10b5-1 box is checked when at least one trade on the form was made under a Rule 10b5-1 plan. A Form 4/A replaces the form it amends. See all of Infosys' Form 4 filings on EDGAR.
Learn: Form 4 insider filings: who files, the codes and the footnotes · Rule 10b5-1 trading plans: how insiders pre-schedule their trades
20What it does with profit
20What it does with profit
What does Infosys do with its profit?
Dividend per share
$0.52FY2026
Dividend paid for each share, by financial year.
$ per share
See the numbers
Buyback · Mar 31, 2022
Paid $1,503 million for share buybacks in FY2022 (cash flow statement).
$1.5B
Buyback · Mar 31, 2023
Paid $1,398 million for share buybacks in FY2023 (cash flow statement).
$1.4B
Buyback · Dec 4, 2025
Completed a tender offer for 100,000,000 shares, about 2.41% of the total, for $2,006 million including costs. ADS holders could take part only by first converting their ADSs into equity shares.
$2.0B
21Governance signals
21Governance signals
What do Infosys' governance filings show?
- Auditor
- Deloitte Haskins & Sells LLP
- Auditor changes
- Apr 23, 2026: Deloitte Haskins & Sells LLP → KPMG Assurance and Consulting Services LLP (for SEC filings) and BSR & Co. LLP (statutory auditor), proposed (The FY2026 20-F says the rotation of the statutory auditor is mandatory under Indian company law, with BSR & Co. LLP proposed from the year ending Mar 31, 2028. The board intends KPMG to be its certifying accountant for SEC filings from the same year. Deloitte audits fiscal 2027. The board approved the BSR proposal on Apr 23, 2026.)
- Audit qualifications
- None reported
- Related-party dealings
- This page does not summarize related-party transactions; the FY2026 20-F reports them under Item 7.B. The 20-F says no government, company or person owns or controls Infosys.
- Credit rating
- No public credit rating found in a search of rating agency sites on Nov 17, 2026
Flags to know about
regulatory
US Department of Justice investigation
The FY2026 20-F reports a US Department of Justice investigation into how certain employees holding H-1B visas were classified in immigration filings. Infosys says it cannot predict the outcome.
other
Trade-secret lawsuit by Cognizant TriZetto
The FY2026 20-F reports a lawsuit filed by Cognizant TriZetto on Aug 23, 2024, asserting misappropriation of trade secrets, breach of contract and unfair competition. Infosys filed counterclaims alleging antitrust violations.
22What the market paid
22What the market paid · price as of Nov 16, 2026
What did the market pay for Infosys on Nov 16, 2026?
Price as of Nov 16, 2026 (shown for education; prices change daily).
ADS price (NYSE) as of Nov 16, 2026: $12.31, the closing price in Nasdaq.com's historical price table for INFY; the ADSs are listed on the New York Stock Exchange. One ADS represents one equity share, so with 4,050.36 million shares outstanding at Sep 30, 2026, the market value is about $49.86 billion (Cityfort calculation from the Nov 16, 2026 closing price and the Q2 FY2027 Form 6-K). P/E per ADS is the ADS price ÷ FY2026 diluted earnings per share of $0.80: 15.4. P/B is market value ÷ equity attributable to shareholders of $10.33 billion at Sep 30, 2026: 4.8. EV/EBITDA subtracts net cash of $4.85 billion from market value, then divides by FY2026 EBITDA of $4.64 billion: 9.7.
- ADS price (NYSE)
- $12.31
- Market value (market cap)
- $49.9B
- P/E
- 15.4×
- P/B
- 4.8×
- EV/EBITDA
- 9.7×
More price-based ratios · as of Nov 16, 2026
Each ratio divides a number from the company's filings by the market value or share price on Nov 16, 2026. Prices change daily, so these ratios do too.
Price to sales (P/S)
2.4×
$49.9B market value ÷ $20.4B revenue (four quarters to Sep 30, 2026) = 2.4×
Cityfort calculation from the Nov 16, 2026 closing price and the Q3 FY2026 to Q2 FY2027 filings. Source: INFY historical daily prices, Nov 2 to Nov 16, 2026 (Nasdaq.com table for the NYSE-listed ADS; close of Nov 16, 2026: $12.31); Form 6-K: Q2 FY2027 audited interim condensed financial statements, IFRS, US$ (Exhibit 99.7); Form 20-F for FY2026 (year ended March 31, 2026) and 3 more
How price ratios workDividend yield
4.22%
$0.52 dividends per share (FY2026) ÷ $12.31 share price = 4.22%
Cityfort calculation from the FY2026 filing and the Nov 16, 2026 closing price. Source: INFY historical daily prices, Nov 2 to Nov 16, 2026 (Nasdaq.com table for the NYSE-listed ADS; close of Nov 16, 2026: $12.31); Form 6-K: Q2 FY2027 audited interim condensed financial statements, IFRS, US$ (Exhibit 99.7); Form 20-F for FY2026 (year ended March 31, 2026)
What dividend yield meansFree cash flow yield
7.5%
$3.7B free cash flow (FY2026) ÷ $49.9B market value = 7.5%
Cityfort calculation from the FY2026 filing and the Nov 16, 2026 closing price. Source: INFY historical daily prices, Nov 2 to Nov 16, 2026 (Nasdaq.com table for the NYSE-listed ADS; close of Nov 16, 2026: $12.31); Form 6-K: Q2 FY2027 audited interim condensed financial statements, IFRS, US$ (Exhibit 99.7); Form 20-F for FY2026 (year ended March 31, 2026)
What free cash flow means
Shares used for the market value: 4,056.36 million ($12.31 × 4,056.36 million shares ≈ $49.9B). Source: Form 20-F for FY2026 (year ended March 31, 2026); Form 6-K: Q2 FY2027 audited interim condensed financial statements, IFRS, US$ (Exhibit 99.7)
Source: INFY historical daily prices, Nov 2 to Nov 16, 2026 (Nasdaq.com table for the NYSE-listed ADS; close of Nov 16, 2026: $12.31); Form 6-K: Q2 FY2027 audited interim condensed financial statements, IFRS, US$ (Exhibit 99.7); Form 20-F for FY2026 (year ended March 31, 2026)
Sources (6)
- INFY historical daily prices, Nov 2 to Nov 16, 2026 (Nasdaq.com table for the NYSE-listed ADS; close of Nov 16, 2026: $12.31)
- Form 6-K: Q2 FY2027 audited interim condensed financial statements, IFRS, US$ (Exhibit 99.7)
- Form 20-F for FY2026 (year ended March 31, 2026)
- Form 6-K: Q3 FY2026 audited interim condensed financial statements, IFRS, US$ (Exhibit 99.7)
- Form 6-K: Q4 FY2026 audited condensed financial statements, IFRS, US$ (Exhibit 99.7)
- Form 6-K: Q1 FY2027 audited interim condensed financial statements, IFRS, US$ (Exhibit 99.7)
23How it got here
23How it got here
How did Infosys get here?
1981
Milestone
Founded in Pune
Incorporated on Jul 2, 1981 as Infosys Consultants Private Limited. It is now based in Bengaluru.
1999
Milestone
ADSs listed in the US
Its ADSs began trading on Nasdaq on Mar 11, 1999.
2012
Milestone
Move to the New York Stock Exchange
The ADSs moved from Nasdaq to the New York Stock Exchange on Dec 12, 2012.
2017
Milestone
Co-founder returns as chairman
Nandan M. Nilekani became non-executive chairman on Aug 24, 2017.
2018
Milestone
Salil Parekh becomes CEO
Salil Parekh took over as CEO and managing director on Jan 2, 2018.
2025
Milestone
Labor code charge and a buyback
A one-time $143 million charge after India notified new labor codes on Nov 21, 2025, then a $2,006 million buyback completed on Dec 4, 2025.
2026
Milestone
Two acquisitions and a deal worth over $2 billion
Bought Stratus Global and Optimum Healthcare IT, and signed a 7-year deal worth over $2 billion with a financial services client in Q2 FY2027.
24Sources and changes
Where every number on this page comes from
Sources (16 documents)
- S1Form 20-F for FY2026 (year ended March 31, 2026) · Infosys Limited (SEC EDGAR) · Tier 1: company or exchange filing · Jun 15, 2026
- S2Form 20-F for FY2024 (year ended March 31, 2024) · Infosys Limited (SEC EDGAR) · Tier 1: company or exchange filing · Jun 24, 2024
- S3Form 6-K: Q2 FY2027 results press release (Exhibit 99.2) · Infosys Limited (SEC EDGAR) · Tier 1: company or exchange filing · Oct 23, 2026
- S4Form 6-K: Q2 FY2027 audited interim condensed financial statements, IFRS, US$ (Exhibit 99.7) · Infosys Limited (SEC EDGAR) · Tier 1: company or exchange filing · Oct 28, 2026
- S5Form 6-K: Q2 FY2027 fact sheet (Exhibit 99.4) · Infosys Limited (SEC EDGAR) · Tier 1: company or exchange filing · Oct 28, 2026
- S6Form 6-K: Q2 FY2027 earnings call transcript, Oct 23, 2026 (Exhibit 99.5) · Infosys Limited (SEC EDGAR) · Tier 1: company or exchange filing · Oct 28, 2026
- S7Form 6-K: Q1 FY2027 results press release (Exhibit 99.2) · Infosys Limited (SEC EDGAR) · Tier 1: company or exchange filing · Jul 23, 2026
- S8Form 6-K: Q1 FY2027 audited interim condensed financial statements, IFRS, US$ (Exhibit 99.7) · Infosys Limited (SEC EDGAR) · Tier 1: company or exchange filing · Jul 28, 2026
- S9Form 6-K: Q4 FY2026 and FY2026 results press release (Exhibit 99.2) · Infosys Limited (SEC EDGAR) · Tier 1: company or exchange filing · Apr 23, 2026
- S10Form 6-K: Q4 FY2026 audited condensed financial statements, IFRS, US$ (Exhibit 99.7) · Infosys Limited (SEC EDGAR) · Tier 1: company or exchange filing · Apr 29, 2026
- S11Form 6-K: Q3 FY2026 results press release (Exhibit 99.2) · Infosys Limited (SEC EDGAR) · Tier 1: company or exchange filing · Jan 14, 2026
- S12Form 6-K: Q3 FY2026 audited interim condensed financial statements, IFRS, US$ (Exhibit 99.7) · Infosys Limited (SEC EDGAR) · Tier 1: company or exchange filing · Jan 20, 2026
- S13Schedule 13G filed by BlackRock, Inc. (event date Sep 30, 2024) · SEC EDGAR · Tier 1: company or exchange filing · Oct 24, 2024
- S14Schedule 13G/A filed by BlackRock, Inc. (event date Mar 31, 2025) · SEC EDGAR · Tier 1: company or exchange filing · Apr 25, 2025
- S15INFY historical daily prices, Nov 2 to Nov 16, 2026 (Nasdaq.com table for the NYSE-listed ADS; close of Nov 16, 2026: $12.31) · Nasdaq, Inc. · Tier 1: company or exchange filing · Nov 17, 2026
- S16Form F-6 POS (post-effective amendment no. 1) filed by Deutsche Bank Trust Company Americas for the Infosys ADSs · SEC EDGAR · Tier 1: company or exchange filing · Aug 28, 2026
Changes to this page (v2 · Nov 18, 2026)
- v2 · Nov 18, 2026Reworded the profit-source point so every number in it is also shown on the page (the release build checks this). (editorial update, Q2 FY2027)
- v1 · Nov 17, 2026First version. (first version)
Numbers come only from tier 1 and tier 2 sources. Read how we research.
Disclaimer
For learning only. Cityfort is not a registered investment adviser or broker-dealer and does not recommend buying or selling any security. Prices shown are dated and may be out of date.
Investing in securities involves risk, including loss of capital. Before making any investment decision, do your own research and consider consulting a registered investment adviser or other qualified professional.
Cityfort, its owners and contributors may or may not hold securities of companies covered. Cityfort is not paid by any company it covers. Content is not an offer or solicitation to buy or sell any security, including in any initial public offering.
Read the positions policyRead the full disclaimerHide the full disclaimer
Cityfort publishes general educational content that explains how listed companies work. Cityfort is not registered with the US Securities and Exchange Commission or any state securities regulator as an investment adviser, and is not a broker-dealer or a member of FINRA. Cityfort does not provide investment, tax or legal advice, recommendations, ratings, price targets or any opinion on whether to buy, sell or hold any security. Nothing on the site is tailored to any person's circumstances.
All information is taken from publicly available sources, mainly company filings with the SEC, which are listed on each page with dates. We work to keep it accurate and correct errors publicly, but we do not guarantee that it is complete, accurate or up to date. Any market price or price-based ratio shown is dated, may be out of date by the time you read it, and is included only to explain concepts.
Statements by company management, including forward-looking statements and guidance, are reported as the company's statements, with their date and source; they are not our forecasts. Adjusted (non-GAAP) figures are the company's own measures and are shown next to the official (GAAP) figures.