Technology · NYSE: JBL
Jabil: how the business works
Jabil builds other companies’ products, from AI data center gear to car parts, and had $35.95 billion of revenue in FY2026.
By Hardik Bhandare · Checked against filings: . Editorial policy. Corrections
Follow Jabil
Email me when Jabil's page is updated after earnings.
We'll send a confirmation email first. See our privacy policy.
Jabil Inc. · St. Petersburg, Florida
Updated for Q4 FY2026 · checked
- Revenue, FY2026
- $35.95B
- Net income, FY2026
- $1.04B
- Locations, FY2026
- About 120 in 30 countries
- Largest customer, FY2026
- 20% of revenue
- Largest holder, 2026 proxy
- Vanguard, 14.11%
The short version
Jabil in 5 points
1 · What it sells
Jabil designs, buys the parts for, builds and ships products for other companies from about 120 locations in 30 countries, with net revenue of $35,954 million in FY2026.
2 · Who pays it
In FY2026, cloud, data center and network companies paid 49.7% of Jabil’s revenue, regulated industries such as cars and health care 35.3%, and consumer device and digital commerce companies 15%.
3 · What it keeps from $100
Of every $100 that came in during FY2026, parts, factory labor and plant costs took $90.78 and Jabil kept $2.89 as net income, while operating income was $4.74.
4 · Where the operating profit comes from
Intelligent Infrastructure earned $1,069 million of FY2026 segment income, Regulated Industries $699 million and Connected Living and Digital Commerce $301 million, before costs that brought operating income to $1,704 million.
5 · The one thing to watch
Jabil’s largest customer, which the 10-K does not name, was 20% of FY2026 revenue, up from 16% in FY2025, and 33% of the money customers owed Jabil (receivables) on Aug 31, 2026.
Sources: From Jabil’s FY2026 10-K and its Q4 FY2026 earnings release of Sep 30, 2026 · checked
Sources (1)
01Where the money goes · FY2026
Where does $100 of Jabil's money go?
Jabil · FY2026
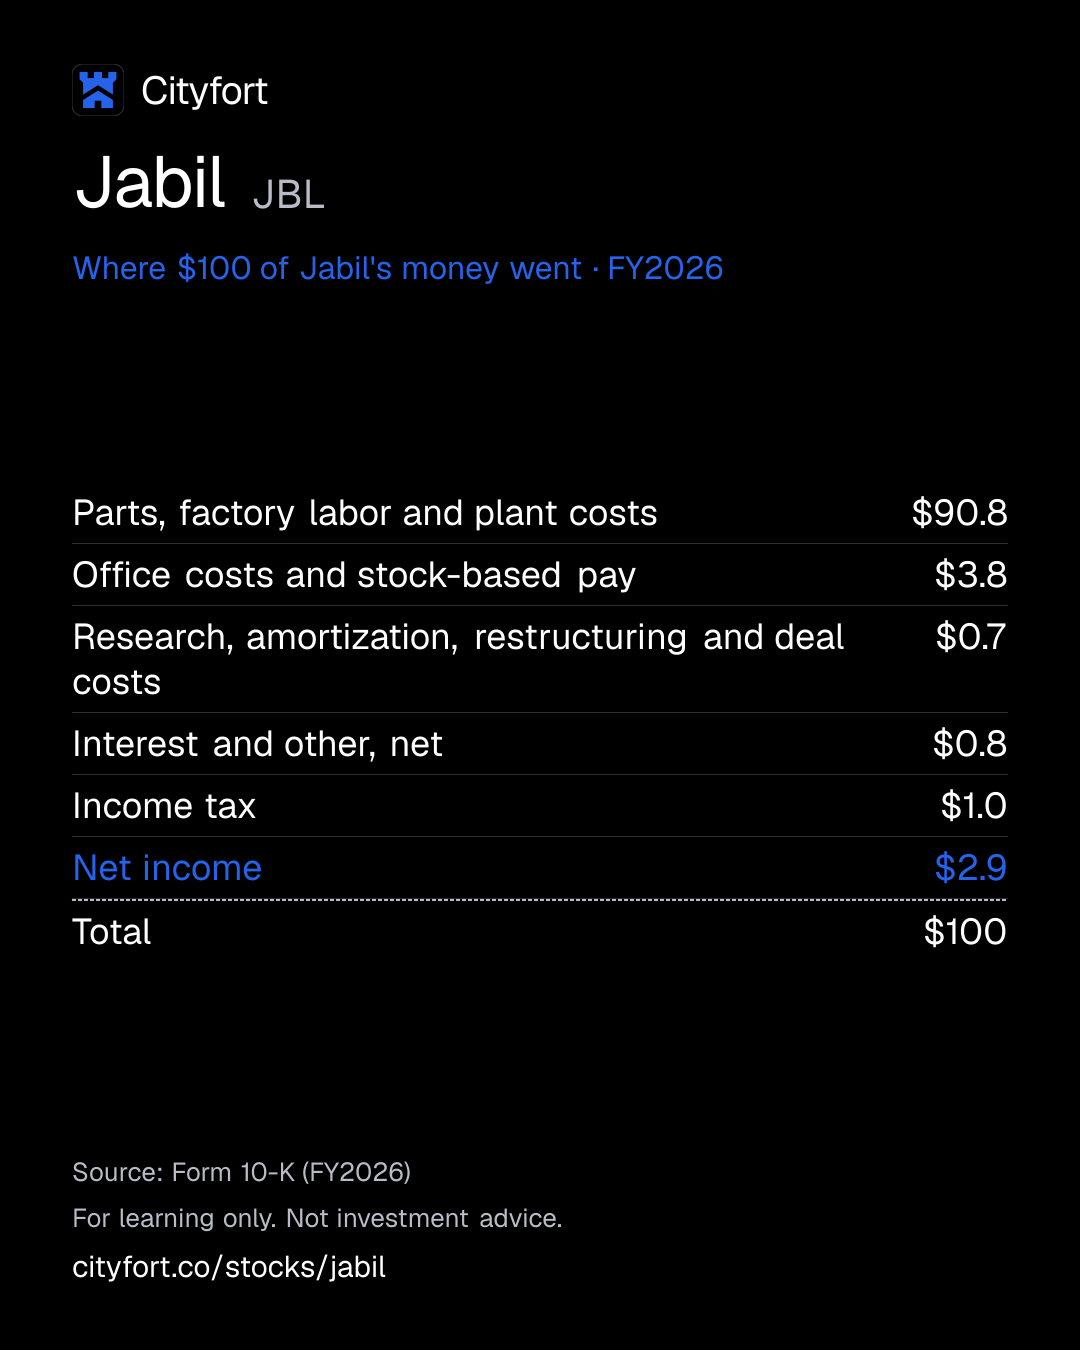
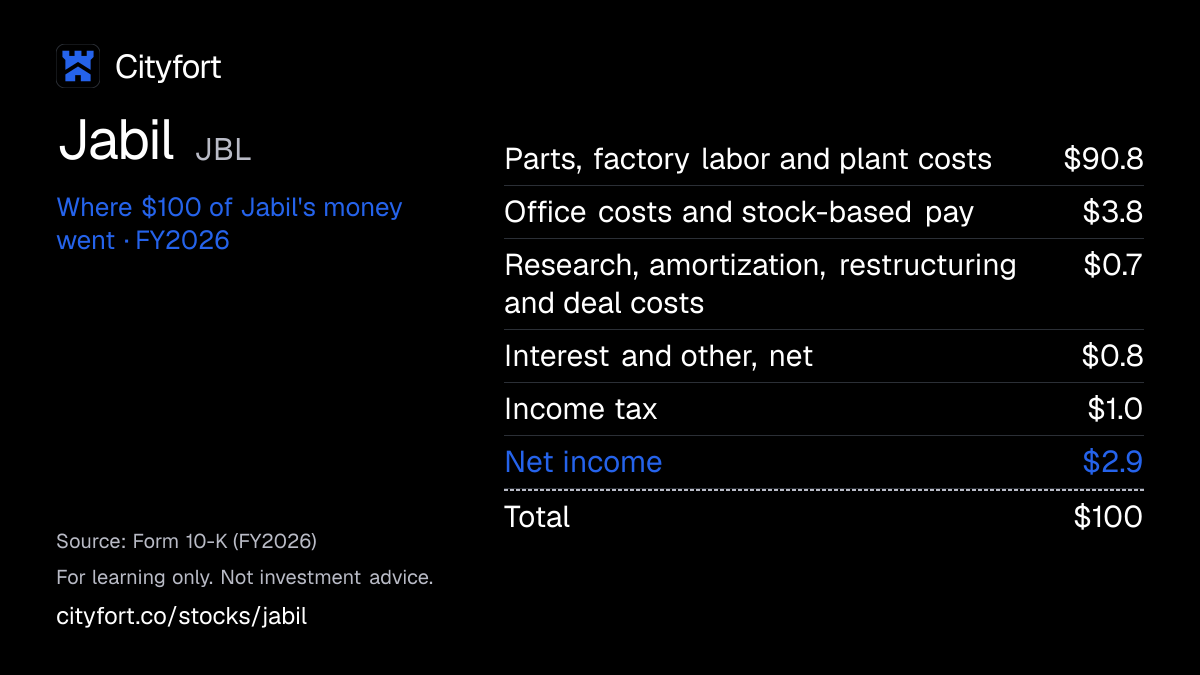
Receipt for every $100
| Parts, factory labor and plant costs | $90.8 |
|---|---|
| Office costs and stock-based pay | $3.8 |
| Research, amortization, restructuring and deal costs | $0.7 |
| Interest and other, net | $0.8 |
| Income tax | $1.0 |
| Net income | $2.9 |
| Total | $100 |
Each line = amount ÷ total money in × 100. Lines may not add to exactly $100 because of rounding.
How this is worked out
Cityfort calculation from FY2026 10-K. Of every $100 that came in during FY2026: each line = line ÷ $35,954 million net revenue × 100. Operating income was $1,704 million, or $4.74 of each $100. Net income here is total net income of $1,040 million, before a $2 million loss of minority partners.
Save this receipt as an image
Embed this receipt or the key numbers
Paste this code into a blog or website to show the card you choose, with a link back to this page.
Each week: the next company due to report earnings, explained in 5 points.
No tips. Unsubscribe anytime.
We'll send a confirmation email. See our privacy policy.
02The business in one line
What does Jabil do?
Brands pay Jabil to design, source, build and ship their products; parts, factory labor and plant costs take about $91 of every $100, and $2.89 was left as net income in FY2026.
- Cloud and data center companies paid 49.7% of FY2026 revenue, and one unnamed customer alone paid 20%.
- Operating income (profit from running the business, before interest and tax) was $1,704 million in FY2026, or $4.74 of every $100 of revenue.
03Who pays it
Who pays Jabil?
Cloud, data center and network companies
49.7%
of revenue
Buy cloud and data center infrastructure, including AI infrastructure, networking and communications gear, and capital equipment (the Intelligent Infrastructure segment).
Companies in regulated industries
35.3%
of revenue
Car and transport makers, health care and packaging firms, and renewable and energy infrastructure companies (the Regulated Industries segment).
Consumer device and digital commerce companies
15%
of revenue
Buy connected home devices and digital commerce gear, including warehouse automation and robotics (Connected Living and Digital Commerce).
- Cloud, data center and network companies49.7%
- Companies in regulated industries35.3%
- Consumer device and digital commerce companies15%
Customer concentration
Jabil’s largest customer, which the 10-K calls Customer A and does not name, was 20% of FY2026 revenue (16% in FY2025) and 33% of receivables on Aug 31, 2026. The five largest customers were about 37% of revenue, and 76 customers about 90%.
- Largest customer
- 20%
- Top 5 customers
- 37%
Sources (1)
04How it makes money
How does Jabil make money?
Jabil earns a few dollars on every $100 of products it builds, so volume and cost control decide profit.
Most of what customers pay goes straight back out on parts and factory costs. In FY2026 cost of revenue was about $91 of every $100. Profit depends on running many programs through the same factories without costs rising as fast.
Operating income per $100 of revenue
$4.2$4.7
FY2022 to FY2026
- A brand hires Jabil to design and build a product
- Jabil buys the parts and builds it in a dedicated business unit
- Customers pay for each unit shipped
- More volume spreads factory and office costs over more revenue
- Operating income was $4.74 per $100 of revenue in FY2026
↺ Step 5 feeds back into step 1.
05Business segments · FY2026
Which businesses make up Jabil?
Regulated Industries
35.3%Builds products for car and transport makers, health care and packaging firms, and renewable and energy infrastructure companies. Revenue rose 7% in FY2026.
Revenue $12.7B ($12,694M) · Operating profit $699M
Intelligent Infrastructure
49.7%Builds cloud and data center equipment, including AI infrastructure, plus networking gear and capital equipment. Revenue rose 45% in FY2026.
Revenue $17.9B ($17,872M) · Operating profit $1.1B ($1,069M)
Connected Living and Digital Commerce
15%Builds connected home devices and digital commerce gear, including warehouse automation and robotics. Renamed Intelligent Devices and Robotics from Sep 1, 2026.
Revenue $5.4B ($5,388M) · Operating profit $301M
How the mix changed
- Regulated Industries
- Intelligent Infrastructure
- Connected Living and Digital Commerce
Revenue by segment, FY2024 to FY2026.
US$
See the numbers
06The numbers · Consolidated · US$
How has Jabil done?
Revenue
$36.0BFY2026
Revenue was $28,883 million in FY2024, the year Jabil sold its Mobility business, and $35,954 million in FY2026.
US$
See the numbers
Net income
$1.0BFY2026
Net income of $1,388 million in FY2024 includes a $942 million pre-tax gain on the Mobility sale; FY2026 net income was $1,042 million.
US$
See the numbers
Net income for every $100 of revenue
$2.9FY2026
Jabil kept $2.90 of net income per $100 of revenue in FY2026, up from $2.20 in FY2025.
Net margin: $ of net income per $100 of revenue
See the numbers
Free cash flow
$1.4BFY2026
Free cash flow (operating cash minus equipment spending) rose each year from $266 million in FY2022 to $1,374 million in FY2026.
US$ · cash from operations minus spending on plants and equipment
See the numbers
See all yearly numbers
EBITDA here = operating income plus depreciation and amortization (from the cash flow statement). Fiscal years are the company's own: Fiscal year ends Aug 31. Net income is the share belonging to the company's owners.
Learn: Fiscal years that don't end in December: Nvidia's FY2027 explained · Stock-based compensation and dilution: pay that becomes shares
Sources (16)
- Form 10-K for FY2022
- Form 10-K for FY2023
- Form 10-K for FY2024
- Form 10-K for FY2025
- Form 10-K for FY2026
- Form 10-Q for Q1 FY2024
- Form 10-Q for Q2 FY2024
- Form 10-Q for Q3 FY2024
- Q4 FY2025 earnings release (8-K Ex. 99.1)
- Form 10-Q for Q1 FY2025
- Form 10-Q for Q2 FY2025
- Form 10-Q for Q3 FY2025
- Q4 FY2026 earnings release (8-K Ex. 99.1) with FY2027 outlook
- Form 10-Q for Q1 FY2026
- Form 10-Q for Q2 FY2026
- Form 10-Q for Q3 FY2026
07Who runs it
Who runs Jabil, and did they deliver?
Michael Dastoor
Chief Executive Officer · since 2024
CEO since May 2024; Chief Financial Officer from April 2018 to May 2024. Joined Jabil in 2000.
Gregory B. Hebard
Chief Financial Officer · since 2024
CFO since May 2024; joined Jabil in 2009.
Andrew D. Priestley
Executive Vice President and Chief Operations Officer · since 2026
In the role since January 2026; joined Jabil in 1996.
Steven Raymund
Chairman of the Board · since 2026
Director since 1996 and retired Chairman and CEO of Tech Data. Named Chairman when the board grew from seven to nine members in January 2026.
What they said, and what happened
2 delivered · 1 too early to tell
Said on Sep 25, 2025
Jabil said in its Sep 25, 2025 earnings release that it expected FY2026 revenue of about $31.3 billion, a core operating margin of 5.6% and core diluted EPS of $11.00.
DeliveredWhat happened
FY2026 revenue was $35,954 million, the core operating margin 5.8% and core diluted EPS $13.09.
Said on Jun 17, 2026
Jabil said in its Jun 17, 2026 earnings release that it expected Q4 FY2026 revenue of $9.2 billion to $10.0 billion and core diluted EPS of $3.80 to $4.20.
DeliveredWhat happened
Q4 FY2026 revenue was $10,616 million and core diluted EPS $4.40, both above the ranges.
Said on Sep 30, 2026
Jabil said in its Sep 30, 2026 earnings release that it expects FY2027 revenue of $44.5 billion and core diluted EPS of $17.55.
Too early to tellWhat happened
FY2027 ends on Aug 31, 2027.
08What could go wrong
What could go wrong for Jabil?
- Concentration
One customer is a fifth of revenue
Customer A, which the 10-K does not name, was 20% of FY2026 revenue and 33% of receivables on Aug 31, 2026. The five largest customers were about 37% of revenue.
Watch Customer A’s share of revenue in the FY2027 10-K.
- Demand
Cloud customers buy in different cycles
The 10-K says cloud-based service providers are cyclically different from Jabil’s traditional customers, changing revenue patterns and making working capital harder to manage. Intelligent Infrastructure was 49.7% of FY2026 revenue.
Watch Intelligent Infrastructure revenue in each quarterly 10-Q.
- Pricing
Thin margins and price pressure
Operating income was $4.74 per $100 of revenue in FY2026. The 10-K says large competitors’ purchasing power adds pricing pressure, and some customers have moved work to their own factories.
Watch GAAP operating margin in the quarterly results.
- Regulation
Tariffs and trade disputes
Jabil locations in Mexico, Malaysia and China booked 43.6% of FY2026 revenue. The 10-K says tariffs have increased and could increase the cost of components and materials.
Watch Tariff changes on goods made in Mexico, China and Malaysia.
- Execution
Parts from a single source
The 10-K says many products need components available from only one supplier, and shortages can sharply cut production of every assembly that uses that part.
Watch Component shortages named in the quarterly 10-Qs.
- Debt
Borrowing and credit ratings
Borrowings were $3,379 million on Aug 31, 2026, with $499 million due in May 2027. The 10-K says a lower credit rating could make new capital more expensive; revolving credit pricing is tied to S&P, Moody’s and Fitch ratings.
Watch Repayment or refinancing of the May 2027 notes.
09Supporters vs. critics
What do supporters and critics point to?
What supporters point to
- Intelligent Infrastructure revenue rose 45% to $17,872 million in FY2026; the 10-K says AI-related growth came mainly from demand for certain AI infrastructure programs.
- FY2026 revenue of $35,954 million was above the about $31.3 billion Jabil said it expected in its Sep 25, 2025 earnings release.
- Free cash flow was $1,374 million in FY2026, up from $266 million in FY2022.
- Jabil spent $1,060 million buying back shares in FY2026, and shares outstanding fell to 102,974,470 on Oct 20, 2026.
What critics point to
- One customer, which the 10-K does not name, was 20% of FY2026 revenue and 33% of receivables on Aug 31, 2026.
- Operating income was $4.74 per $100 of revenue in FY2026, and the 10-K says large competitors’ purchasing power adds pricing pressure.
- Jabil locations in Mexico, Malaysia and China booked 43.6% of FY2026 revenue, and the 10-K says tariffs have raised, and could raise, the cost of components and raw materials.
- Borrowings were $3,379 million on Aug 31, 2026, against stockholders’ equity of $1,613 million, with $499 million of notes due in May 2027.
10What to watch next
What should you watch next at Jabil?
Next event
Q1 FY2027 results
Date not announced yet.
The FY2027 outlook
Jabil said in its Sep 30, 2026 earnings release that it expects FY2027 revenue of $44.5 billion and core diluted EPS of $17.55, a non-GAAPThe company's own "adjusted" numbers, not the official (GAAP) ones. Always read them next to the official figure. Learn more measure. FY2026 revenue was $35,954 million.
The largest customer’s share
Jabil’s largest customer, which the 10-K does not name, was 20% of FY2026 revenue, up from 16% in FY2025. The FY2027 10-K will show the next figure.
AI and data center revenue
Intelligent Infrastructure was 49.7% of FY2026 revenue. The 10-K says cloud customers buy in different cycles from Jabil’s traditional customers.
The May 2027 notes
$499 million of 4.250% notes fall due on May 15, 2027. Jabil had $4.4 billion of unused borrowing capacity on Aug 31, 2026.
11Key facts
Key facts about Jabil
- What does Jabil do?
- Jabil Inc. designs, builds and ships products for other companies, such as data center and AI infrastructure gear, car parts, health care products and home devices. It runs about 120 locations in 30 countries.
- How does Jabil make money?
- Jabil is paid by brands to design products, buy the parts, assemble them and deliver them. In FY2026, Jabil kept $2.89 of every $100 of revenue as net income, after parts, factory labor and plant costs of $90.78.
- Who are Jabil's customers?
- Jabil's customers are companies, not shoppers. In FY2026, Jabil's largest customer, which its 10-K does not name, paid 20% of revenue, the five largest about 37% and 76 customers about 90%.
- How big is Jabil?
- Jabil had net revenue of $35,954 million in FY2026, the year to Aug 31, 2026, up from $29,802 million in FY2025. Net income attributable to Jabil was $1,042 million, or $9.75 per diluted share.
- Which Jabil segment is the largest?
- Jabil's Intelligent Infrastructure segment, which builds cloud, data center and AI infrastructure equipment, had revenue of $17,872 million in FY2026. That was 49.7% of Jabil's revenue and 45% more than in FY2025.
- Who owns Jabil?
- Jabil has one class of common stock with one vote per share. In Jabil's 2026 proxy statementThe yearly filing about shareholder votes, the board and executive pay. Learn more, The Vanguard Group was listed with 14.11% and BlackRock with 9.62% (from Schedule 13GA filing by anyone who owns more than 5% of a company's shares and does not seek control. Learn more/A filings reporting Dec 2023 holdings; percentages of shares outstanding on the Nov 28, 2025 record date); directors and executive officers held 1.35% on the record date.
- How much debt does Jabil have?
- On Aug 31, 2026, Jabil had $3,379 million of notes and borrowings, without lease liabilities, and $1,739 million of cash. Its FY2026 operating cash flow was $2,002 million.
- Does Jabil pay a dividend?
- Jabil declared four quarterly dividends of $0.08 a share in FY2026. It paid $35 million of dividends in FY2026 and spent $1,060 million buying back its own shares.
Terms on this page
- Capital expenditures (capex)
- Customer concentration
- Debt-to-equity
- Earnings per share (EPS)
- EBITDA
- Free cash flow
- Interest coverage
- Market cap
- Net debt
- Net margin
Each explains the term in plain English, with the same number from other companies on Cityfort.
Go deeper
More detail from the same filings. Open any section.
12What it sells
12What it sells
What does Jabil sell?
Design and engineering
Electronic, mechanical and optical design, so a product can be built at scale. Each customer usually has its own Jabil business unit team.
Manufacturing and assembly
Making parts and assembling finished products on highly automated lines in China, Malaysia, Mexico, the US and other countries.
Supply chain and delivery
Buying components, managing inventory and shipping finished goods, including direct-order fulfillment and configure-to-order work.
Think of it like this
Think of a contract bakery that bakes bread sold under a supermarket’s own label: the name on the package is the customer’s, not Jabil’s.
What it does
- Does: Designs, builds and ships products for other companies
- Does: Runs about 120 locations in 30 countries
- Does: Builds data center and AI infrastructure gear, car parts, health care products and home devices
What it does not do
- Does not: Does not sell to shoppers; its customers are companies
- Does not: Does not spend much on its own research: R&D was $30 million in FY2026, about 0.1% of revenue
- Does not: Does not name its largest customers in its 10-K
Sources (1)
13How the money flows
13How the money flows · FY2026
How does money flow through Jabil?
Money in
- Net revenue$36.0B
The company
Jabil
$36.0B came in
Money out
- Parts, factory labor and plant costs (cost of revenue)$32.6B
- Office costs and stock-based pay$1.4B
- Research, amortization, restructuring and deal costs$251M
- Interest and other, net$296M
- Income tax$368M
- Net income (total, before a $2 million loss of minority partners)$1.0B
- In FY2026, customers paid Jabil $35,954 million to design, build and ship their products.
- Parts, factory labor and plant costs took $32,637 million, about $91 of every $100.
- Office costs, stock-based pay, research, restructuring and deal costs took $1,613 million more, leaving operating income of $1,704 million.
- Interest and other items cost $296 million, and income tax $368 million.
- Net income was $1,040 million; Jabil’s shareholders got $1,042 million after a $2 million loss of minority partners.
Sources (1)
14What it needs to run
14What it needs to run
What does Jabil need to run?
Parts from suppliers
Cost of revenue was $32,637 million in FY2026. The 10-K says many products need components available from only a single source, and shortages can halt production.
Factories around the world
About 40 million square feet in about 120 locations in 30 countries (20 million in Asia, 15 million in the Americas, 5 million in Europe); 15 million owned, 25 million leased.
Workers
About 140,000 people on Aug 31, 2026, counting permanent, temporary and contingent workers: 72,000 in Asia, 52,000 in the Americas and 16,000 in Europe.
Cash to carry inventory
Inventories were $7,413 million on Aug 31, 2026. Jabil also sells some unpaid customer bills (receivables) for cash under a program: $4,532 million in FY2026.
Sources (1)
15Where it sells
15Where it sells · FY2026
Where does Jabil sell?
- United States (by Jabil location)26.9%
- Mexico (by Jabil location)20%
- Malaysia (by Jabil location)12.2%
- China (by Jabil location)11.4%
- Other countries (by Jabil location)29.5%
Sources (1)
16Competitors and what protects it
16Competitors and what protects it
Who does Jabil compete with?
Celestica Inc.
Named in Jabil’s FY2026 10-K as part of the peer group for its five-year stock performance comparison.
Flex Ltd.
Named in Jabil’s FY2026 10-K as part of the peer group for its five-year stock performance comparison.
Hon Hai Precision Industry Co. Ltd
Named in Jabil’s FY2026 10-K as part of the peer group for its five-year stock performance comparison.
Plexus Corp.
Named in Jabil’s FY2026 10-K as part of the peer group for its five-year stock performance comparison.
Sanmina Corp.
Named in Jabil’s FY2026 10-K as part of the peer group for its five-year stock performance comparison.
What protects the business
Each strength is scored 1 (weak) to 5 (strong) for the business, with the reason. It is not a rating of the share.
- Global scale3 of 5
About 120 locations in 30 countries let customers build the same product in several regions at once, as the 10-K describes.
- Customer ties3 of 5
Business unit teams act as a single point of contact for each customer; 76 customers made up about 90% of FY2026 revenue.
- Pricing power1 of 5
Operating income was $4.74 per $100 of revenue in FY2026, and the 10-K says competitors’ purchasing power adds pricing pressure.
Weak spot
Customers can take work back
The 10-K says some customers have moved part of their manufacturing from Jabil to use their own spare factory capacity.
Sources (1)
17Where growth could come from
17Where growth could come from
Where could Jabil's growth come from?
Jabil said in its Sep 30, 2026 earnings release that it expects FY2027 revenue of $44.5 billion, a core operating margin of 6.1%, core diluted EPS of $17.55 and adjusted free cash flowCash from operations minus spending on buildings and equipment. Learn more of about $1.6 billion. "Core" and "adjusted" figures are Jabil’s own non-GAAP measures.
AI and data center infrastructure
Working+45% segment revenue, FY2026
Intelligent Infrastructure revenue rose to $17,872 million in FY2026 from $12,317 million. The 10-K says AI-related growth came mainly from demand for certain AI infrastructure programs.
Status: Working, on track against what the company said.
Regulated industries
Mixed+7% segment revenue, FY2026
Revenue fell to $11,879 million in FY2025 from $12,261 million, then rose to $12,694 million in FY2026. Automotive and transportation grew 4%.
Status: Mixed, partly on track.
Connected devices and digital commerce
Mixed−4% segment revenue, FY2026
Revenue was $5,388 million in FY2026, down from $7,425 million in FY2024. Connected living fell 11% in FY2026, while digital commerce grew 7%.
Status: Mixed, partly on track.
Energy and data center power
New$752 million deal, Jan 2026
Jabil bought Hanley Energy Group, which provides energy management and critical power systems for data centers, on Jan 2, 2026.
Status: New, recently announced.
Status compares progress with what the company itself said it would do: Working = on track against what the company said; Mixed = partly on track; Behind = behind the company's own plan; New = recently announced; Early = too early to judge.
18The company's own measures (non-GAAP)
18The company's own measures · FY2026
What do Jabil's own measures show?
Official (GAAP): Operating income, FY2026
$1.7B
Company's own measure: Core operating income, FY2026
$2.1B
Leaves out amortization of intangibles, stock-based payPay given as shares instead of cash, which spreads ownership more thinly. Learn more, restructuring, and acquisition and divestiture charges. Jabil reports the same total as segment income.
Official (GAAP): Operating margin, FY2026
4.7%
Company's own measure: Core operating margin, FY2026
5.8%
Core operating income as a share of revenue, as Jabil states it.
Official (GAAP): Diluted EPS, FY2026
$9.75
Company's own measure: Core diluted EPS, FY2026
$13.09
Earnings per share without the items left out of core operating income, after tax, as Jabil defines it.
Official (GAAP): Net cash from operating activities, FY2026
$2.0B
Company's own measure: Adjusted free cash flow, FY2026
$1.5B
Operating cash flow minus equipment spending, plus proceeds from selling equipment ($158 million in FY2026).
These are the company's own measures, defined by the company. They are not comparable across companies, and they are not added together. Each sits beside the nearest official (GAAP) figure.
Learn: Non-GAAP measures: what a company's "adjusted" numbers leave out · Stock-based compensation and dilution: pay that becomes shares
19Financial strength and debt
19Financial strength · Aug 31, 2026
How much debt does Jabil have?
- Total debt$3.4B
- Cash and investments$1.7B
- Net debt (debt minus cash)$1.6B
- Net worth (shareholders' money)$1.6B
- Debt to equity
- 2.1×
- $ of debt for every $1 of shareholders' money
- Interest cover
- 9.4×
- how many times operating profit covers interest
- Total debt is Jabil’s notes and borrowings as listed in Note 7 of the FY2026 10-K, without lease liabilities. It was $2,885 million on Aug 31, 2025.
- Net debt of $1,640 million is total debt minus cash of $1,739 million (Cityfort calculation from the FY2026 10-K).
- Debt to equity of 2.1 uses Jabil stockholders’ equity of $1,613 million. Equity is reduced by $9,020 million of treasury stock, the shares Jabil has bought back.
- Interest cover of 9.4 is FY2026 operating income of $1,704 million ÷ net interest expense of $181 million (Cityfort calculation from the FY2026 10-K).
- In January 2026 Jabil sold $500 million of 4.200% notes due 2029 and $500 million of 4.750% notes due 2033. Its $499 million of 1.700% notes due April 2026 were repaid.
- The next maturity is $499 million of 4.250% notes due May 15, 2027. Jabil had $4.4 billion of unused borrowing capacity on Aug 31, 2026, including its $3.2 billion revolving credit facility, which runs to June 2030.
- Accounts payable rose to $14,444 million on Aug 31, 2026 from $7,937 million, and inventories to $7,413 million from $4,681 million. Total assets were $27,435 million, up from $18,543 million.
20Who owns it
20Who owns it · ownership as of Nov 28, 2025
Who owns Jabil?
- Officers and directors (as a group), shares
- 1.4%
Share classes
Holders of 5% or more
From the company's proxy statement (DEF 14A), later Schedule 13G filings and the share counts on its latest annual or quarterly report. Each holder row shows the date of its own filing.
Learn: How to read a proxy statement (DEF 14A): Nvidia's 2026 proxy · Form 4 insider filings: who files, the codes and the footnotes
21What it does with profit
21What it does with profit
What does Jabil do with its profit?
Dividend per share
$0.32FY2026
Dividend paid for each share, by financial year.
$ per share
See the numbers
Buyback · Aug 31, 2024
Treasury stock purchased in FY2024.
$2.5B
Buyback · Aug 31, 2025
Treasury stock purchased in FY2025.
$1.0B
Buyback · Aug 31, 2026
Treasury stock purchased in FY2026.
$1.1B
Sources (1)
22Governance signals
22Governance signals
What do Jabil's governance filings show?
- Auditor
- Ernst & Young LLP, since 2010
- Auditor changes
- None in the period covered
- Audit qualifications
- None reported
- Related-party dealings
- The 2026 proxy says director James Siminoff returned to Amazon in April 2025 as Vice President of Product. Jabil’s FY2025 revenue from Amazon’s home security business was under $20 million, and the proxy says these ordinary-course transactions were not material.
- Credit rating
- Not checked for this page
Flags to know about
other · Apr 22, 2026
Two directors did not get a majority vote
Jabil’s Apr 22, 2026 8-K says directors John Plant and Tiger Tyagarajan did not receive a majority of votes cast at the 2026 annual meeting. Both tendered conditional resignations; the board rejected them on its Nominating and Corporate Governance Committee’s recommendation, and both remain directors.
other · Dec 27, 2024
Warrant issued to Amazon
On Dec 27, 2024, Jabil issued Amazon.com NV Investment Holdings LLC a warrant for up to 1,158,539 Jabil shares at $137.7671 each. It vests as Amazon buys products and services over seven years and expires Dec 27, 2031.
23What the market paid
23What the market paid · price as of Oct 20, 2026
What did the market pay for Jabil on Oct 20, 2026?
Price as of Oct 20, 2026 (shown for education; prices change daily).
Price as of Oct 20, 2026: a $277.18 closing price on the NYSE, as stated in Jabil's FY2026 10-K. Market value = $277.18 × 102,974,470 shares (10-K cover, Oct 20, 2026) = $28,542 million (Cityfort calculation from the FY2026 10-K). P/E is price ÷ earnings per share: 28.4 on FY2026 diluted EPS of $9.75 (Cityfort calculation from the FY2026 10-K).
- Share price
- $277.18
- Market value (market cap)
- $28.5B
- P/E
- 28.4×
More price-based ratios · as of Oct 20, 2026
Each ratio divides a number from the company's filings by the market value or share price on Oct 20, 2026. Prices change daily, so these ratios do too.
Price to sales (P/S)
0.8×
$28.5B market value ÷ $36.0B revenue (four quarters to Aug 31, 2026) = 0.8×
Cityfort calculation from the Oct 20, 2026 closing price and the Q1 FY2026 to Q4 FY2026 10-Qs and 8-Ks. Source: Form 10-K for FY2026; Form 10-Q for Q1 FY2026; Form 10-Q for Q2 FY2026 and 2 more
How price ratios workDividend yield
0.12%
$0.32 dividends per share (FY2026) ÷ $277.18 share price = 0.12%
Cityfort calculation from the FY2026 10-K and the Oct 20, 2026 closing price. Source: Form 10-K for FY2026
What dividend yield meansFree cash flow yield
4.8%
$1.4B free cash flow (FY2026) ÷ $28.5B market value = 4.8%
Cityfort calculation from the FY2026 10-K and the Oct 20, 2026 closing price. Source: Form 10-K for FY2026
What free cash flow means
Shares used for the market value: 102.97 million ($277.18 × 102.97 million shares ≈ $28.5B). Source: Form 10-K for FY2026
Source: Form 10-K for FY2026
24How it got here
24How it got here
How did Jabil get here?
1992
Milestone
Incorporated in Delaware
Jabil Inc. was incorporated in Delaware in 1992; its offices are in St. Petersburg, Florida.
2023
Business-model change
Sold its Mobility business
Jabil agreed on Sep 26, 2023 to sell its Mobility business in Chengdu and Wuxi to BYD Electronic for about $2.2 billion; the FY2024 pre-tax gain was $942 million.
2024
Milestone
Joined the S&P 500
Jabil was added to the S&P 500 index during FY2024, having been in the S&P 400.
2024
Milestone
New CEO
Michael Dastoor, Chief Financial Officer since 2018, became CEO in May 2024.
2024
Business-model change
Reorganized into three segments
From Sep 1, 2024, Jabil reports Regulated Industries, Intelligent Infrastructure, and Connected Living and Digital Commerce.
2024
Milestone
Warrant issued to Amazon
Amazon got a warrant on Dec 27, 2024 for up to 1,158,539 Jabil shares, vesting as it buys from Jabil.
2026
Milestone
Bought Hanley Energy Group
Jabil paid $752 million on Jan 2, 2026 for Hanley Energy, which provides energy management and critical power systems for data centers.
2026
Milestone
New Chairman
Executive Chairman Mark Mondello did not stand for re-election; Steven Raymund became Chairman in January 2026.
2026
Milestone
Segment renamed
From Sep 1, 2026, Connected Living and Digital Commerce is called Intelligent Devices and Robotics; its makeup did not change.
25Sources and changes
Where every number on this page comes from
Sources (23 documents)
- S1Form 10-K for FY2026 · SEC EDGAR · Tier 1: company or exchange filing · Oct 23, 2026
- S2Form 10-Q for Q3 FY2026 · SEC EDGAR · Tier 1: company or exchange filing · Jun 30, 2026
- S3Form 10-Q for Q2 FY2026 · SEC EDGAR · Tier 1: company or exchange filing · Apr 8, 2026
- S4Form 10-Q for Q1 FY2026 · SEC EDGAR · Tier 1: company or exchange filing · Jan 9, 2026
- S5Form 10-K for FY2025 · SEC EDGAR · Tier 1: company or exchange filing · Oct 17, 2025
- S6Form 10-Q for Q3 FY2025 · SEC EDGAR · Tier 1: company or exchange filing · Jun 30, 2025
- S7Form 10-Q for Q2 FY2025 · SEC EDGAR · Tier 1: company or exchange filing · Apr 8, 2025
- S8Form 10-Q for Q1 FY2025 · SEC EDGAR · Tier 1: company or exchange filing · Jan 10, 2025
- S9Form 10-K for FY2024 · SEC EDGAR · Tier 1: company or exchange filing · Oct 28, 2024
- S10Form 10-Q for Q3 FY2024 · SEC EDGAR · Tier 1: company or exchange filing · Jul 9, 2024
- S11Form 10-Q for Q2 FY2024 · SEC EDGAR · Tier 1: company or exchange filing · Apr 5, 2024
- S12Form 10-Q for Q1 FY2024 · SEC EDGAR · Tier 1: company or exchange filing · Jan 9, 2024
- S13Form 10-K for FY2023 · SEC EDGAR · Tier 1: company or exchange filing · Oct 20, 2023
- S14Form 10-K for FY2022 · SEC EDGAR · Tier 1: company or exchange filing · Oct 25, 2022
- S15Proxy statement (DEF 14A) for the 2026 annual meeting · SEC EDGAR · Tier 1: company or exchange filing · Dec 12, 2025
- S16Q4 FY2026 earnings release (8-K Ex. 99.1) with FY2027 outlook · SEC EDGAR · Tier 1: company or exchange filing · Sep 30, 2026
- S17Q3 FY2026 earnings release (8-K Ex. 99.1) · SEC EDGAR · Tier 1: company or exchange filing · Jun 17, 2026
- S18Q4 FY2025 earnings release (8-K Ex. 99.1) · SEC EDGAR · Tier 1: company or exchange filing · Sep 25, 2025
- S19Form 8-K filed Apr 22, 2026: director resignations rejected · SEC EDGAR · Tier 1: company or exchange filing · Apr 22, 2026
- S20Form 8-K filed Jan 23, 2026: $1.0 billion of senior notes · SEC EDGAR · Tier 1: company or exchange filing · Jan 23, 2026
- S21Form 8-K filed Jan 28, 2026: board changes and new Chairman · SEC EDGAR · Tier 1: company or exchange filing · Jan 28, 2026
- S22Form 8-K filed Oct 21, 2025: Executive Chairman and two directors not standing for re-election · SEC EDGAR · Tier 1: company or exchange filing · Oct 21, 2025
- S23Form 8-K filed Jun 24, 2025: $3.2 billion revolving credit agreement · SEC EDGAR · Tier 1: company or exchange filing · Jun 24, 2025
Changes to this page (v1 · Nov 20, 2026)
- v1 · Nov 20, 2026First version. (first version)
Numbers come only from tier 1 and tier 2 sources. Read how we research.
Disclaimer
For learning only. Cityfort is not a registered investment adviser or broker-dealer and does not recommend buying or selling any security. Prices shown are dated and may be out of date.
Investing in securities involves risk, including loss of capital. Before making any investment decision, do your own research and consider consulting a registered investment adviser or other qualified professional.
Cityfort, its owners and contributors may or may not hold securities of companies covered. Cityfort is not paid by any company it covers. Content is not an offer or solicitation to buy or sell any security, including in any initial public offering.
Read the positions policyRead the full disclaimerHide the full disclaimer
Cityfort publishes general educational content that explains how listed companies work. Cityfort is not registered with the US Securities and Exchange Commission or any state securities regulator as an investment adviser, and is not a broker-dealer or a member of FINRA. Cityfort does not provide investment, tax or legal advice, recommendations, ratings, price targets or any opinion on whether to buy, sell or hold any security. Nothing on the site is tailored to any person's circumstances.
All information is taken from publicly available sources, mainly company filings with the SEC, which are listed on each page with dates. We work to keep it accurate and correct errors publicly, but we do not guarantee that it is complete, accurate or up to date. Any market price or price-based ratio shown is dated, may be out of date by the time you read it, and is included only to explain concepts.
Statements by company management, including forward-looking statements and guidance, are reported as the company's statements, with their date and source; they are not our forecasts. Adjusted (non-GAAP) figures are the company's own measures and are shown next to the official (GAAP) figures.