Technology · NASDAQ: LRCX
Lam Research: how the business works
Lam Research makes the machines chipmakers use to deposit, etch and clean the layers of a chip, and services them, with FY2026 revenue of $23.2 billion.
By Hardik Bhandare · Checked against filings: . Editorial policy. Corrections
Follow Lam Research
Email me when Lam Research's page is updated after earnings.
We'll send a confirmation email first. See our privacy policy.
Lam Research Corporation · Fremont, California · Founded 1980
Updated for Q1 FY2027 · checked
- Revenue, FY2026 (year ended Jun 28, 2026)
- $23.2B
- Net income, FY2026
- $7.27B
- Revenue, Q1 FY2027 (quarter ended Sep 27, 2026)
- $8.22B
- Share of FY2026 revenue from China
- About 34%
- Employees, Aug 4, 2026
- About 23,300
The short version
Lam Research in 5 points
1 · What it sells
Lam makes machines that deposit, etch and clean the thin layers of a chip, which brought in $14.9 billion of FY2026 revenue of $23.2 billion, and service, spares and upgrades brought in $8.3 billion.
2 · Who pays it
By where the customer's plant is, FY2026 revenue came 34% from China, 23% from Taiwan, 19% from Korea, 9% from Japan, 7% from the US, 5% from Southeast Asia and 3% from Europe.
3 · What it keeps from $100
Of every $100 that came in during FY2026, Lam kept $31.2 as net income, while operating income, before interest and tax, was $35.3 per $100 of revenue.
4 · Where the operating profit comes from
Lam reports one business segment, so it does not split profit between new machines and service, and across the company FY2026 gross margin was 50.5% and operating income $8.20 billion.
5 · The one thing to watch
China was about 34% of Lam's FY2026 revenue and 42% of FY2024 revenue, and Lam's 10-K says US export rules restrict sales to some customers in China.
Sources: From Lam Research's FY2026 10-K · checked
See the full receipt and the management scorecard below
01Where the money goes · FY2026
Where does $100 of Lam Research's money go?
Lam Research · FY2026
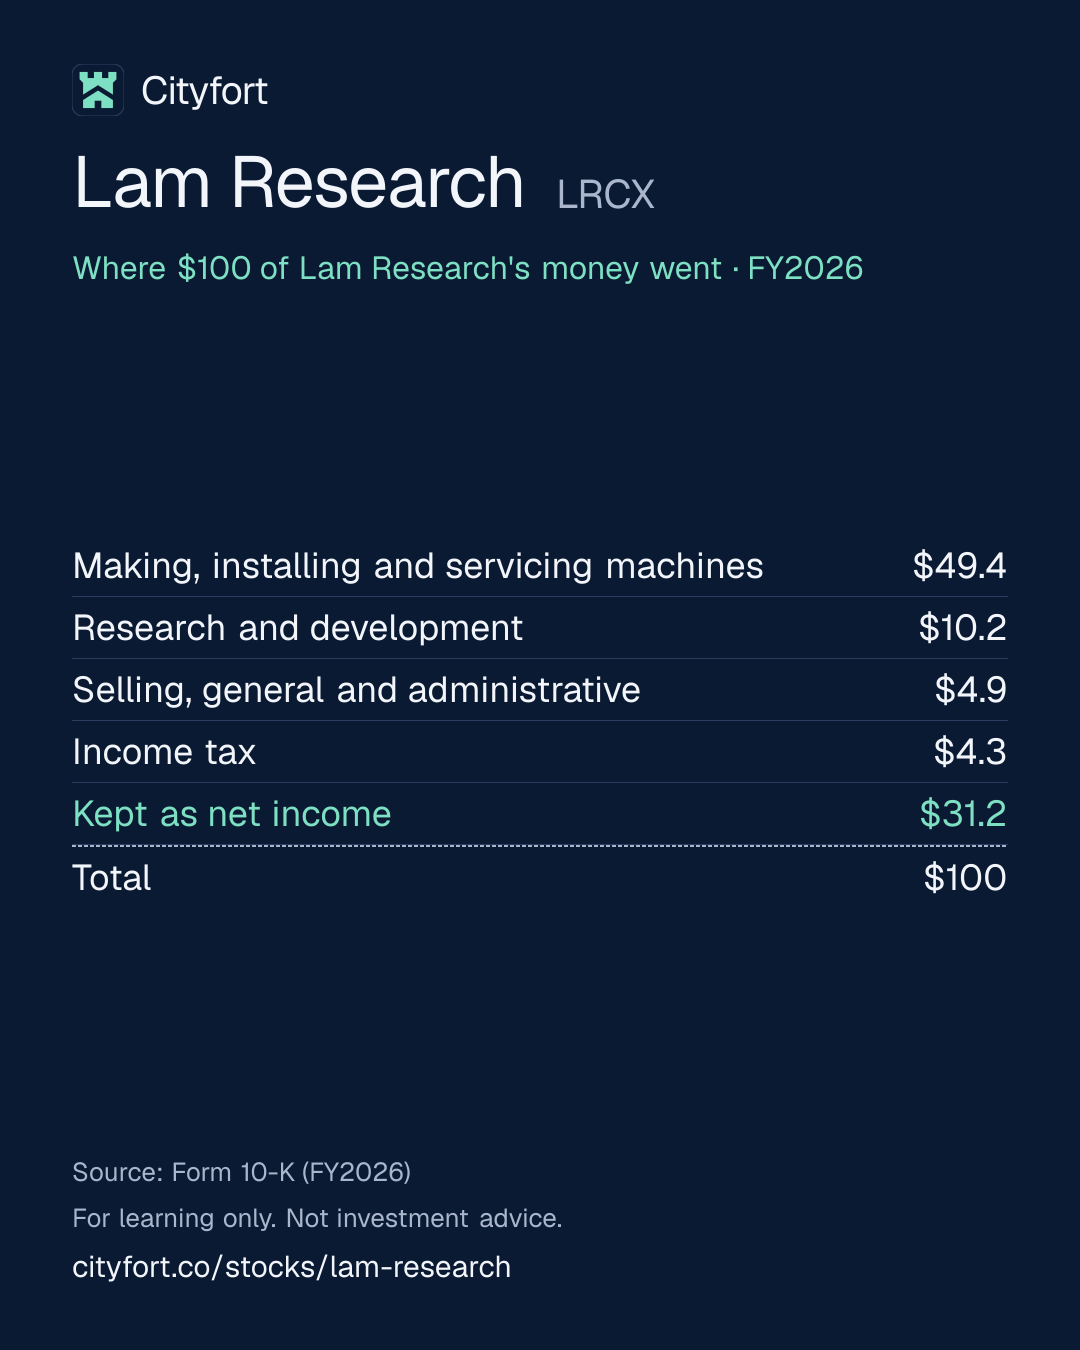
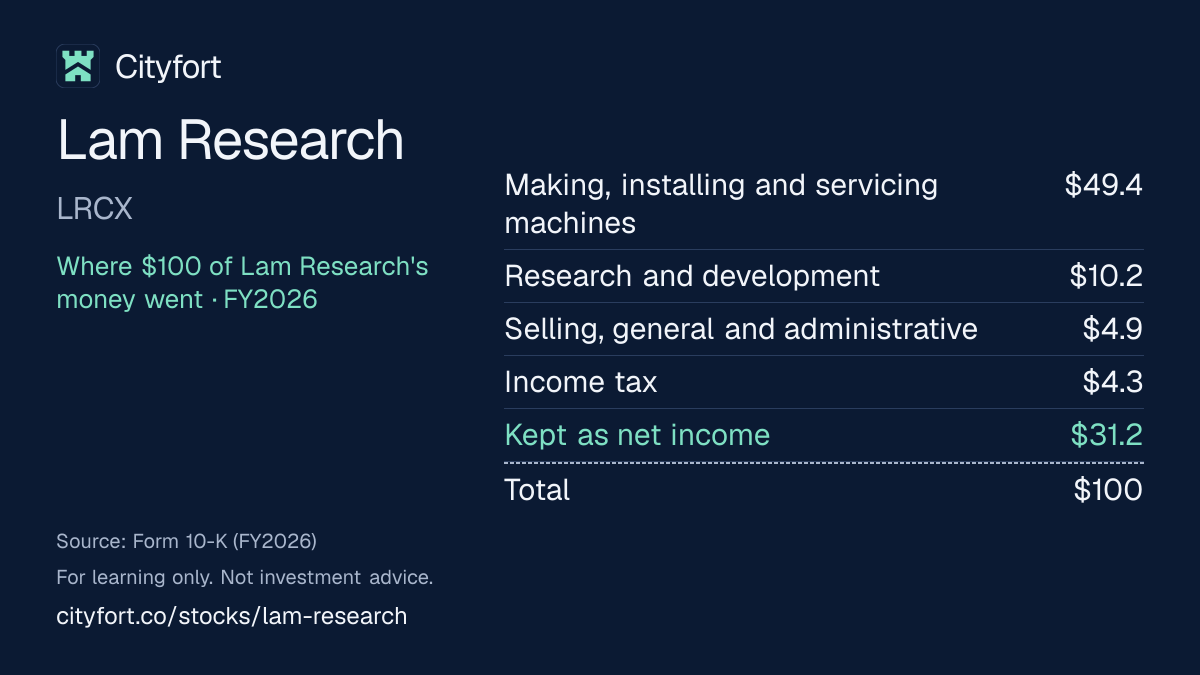
Receipt for every $100
| Making, installing and servicing machines | $49.4 |
|---|---|
| Research and development | $10.2 |
| Selling, general and administrative | $4.9 |
| Income tax | $4.3 |
| Kept as net income | $31.2 |
| Total | $100 |
Each line = amount ÷ total money in × 100. Lines may not add to exactly $100 because of rounding.
How this is worked out
Cityfort calculation from FY2026 10-K. Of every $100 that came in during FY2026 (revenue plus net other income): each line = line ÷ $23.3 billion × 100.
Save this receipt as an image:
1080 × 1350 PNG for Instagram, LinkedIn1200 × 675 PNG for X
Embed this receipt
Paste this code into a blog or website to show the receipt, with a link back to this page:
Each week: one company explained in 5 points, picked by earnings date.
Free, no tips, unsubscribe anytime.
We'll send a confirmation email. See our privacy policy.
02The business in one line
What does Lam Research do?
Chipmakers such as TSMC, Samsung, SK hynix and Micron pay Lam Research for chipmaking machines and their upkeep; in FY2026 making, installing and servicing them took $49.4 of every $100 that came in, and $31.2 was left as net income.
- In FY2026, new machines (systems) brought in $14.9 billion, 64.1% of revenue. Service, spare parts, upgrades and older-generation tools brought in $8.3 billion, 35.9%.
- Revenue fell 14.5% in FY2024, then rose 23.7% in FY2025 and 26.0% in FY2026. Q1 FY2027 revenue was $8.22 billion, up 54.4% from a year earlier.
03Who pays it
Who pays Lam Research?
Chipmakers buying new machines (systems)
64%
of revenue
Foundries that make chips for other companies, memory makers, and logic chipmakers buying advanced equipment. Of FY2026 equipment and upgrade revenue, foundries were 54%, memory 39% and logic and other chipmakers 7%.
Chipmakers paying for service, spares, upgrades and older tools
36%
of revenue
Customer support-related revenue and other: service and spare parts for installed machines, upgrades, and Reliant older-generation tools.
- Chipmakers buying new machines (systems)64%
- Chipmakers paying for service, spares, upgrades and older tools36%
Customer concentration
Four customers each brought in at least 10% of FY2026 revenue: about 16%, 15%, 12% and 12%, together about 55% (Cityfort calculation from FY2026 10-K). Lam names Micron, Samsung, SK hynix and TSMC as its most significant customers in FY2024 to FY2026, but does not link names to percentages. At Jun 28, 2026, five customers held about 20%, 16%, 15%, 11% and 10% of receivables.
- Largest customer
- 16%
04Why it makes money
Why does Lam Research make money?
Lam's costs grow more slowly than its sales in upswings, and every machine it installs keeps earning service revenue.
When revenue fell 14.5% in FY2024, operating income per $100 of revenue fell to $28.6. When revenue rose 26.0% in FY2026, it reached $35.3, and gross margin reached 50.5%. Service, spares and upgrades were 35.9% of FY2026 revenue.
Operating income per $100 of revenue
$28.6$35.3
FY2024 to FY2026
- Lam spends on research to build machines for new chip designs
- Chipmakers pick a Lam machine for a step on a production line
- They tend to keep using it for that step for a long time
- Each installed machine brings service, spare parts and upgrade revenue
- In upswings, revenue grows faster than research and overhead costs
- Profit pays for more research, dividends and share buybacks
↺ Step 6 feeds back into step 1.
05Business segments · FY2026
Which businesses make up Lam Research?
Systems
64%New advanced deposition, etch, clean and other machines. Revenue rose 29.5% in FY2026, which Lam's 10-K attributes mainly to foundry customers' spending. Lam reports one business segment, so profit is not split by revenue type.
Revenue $14.9B
Customer support and other
36%Service, spares, upgrades and older-generation Reliant tools. Revenue rose 20.2% in FY2026, which the 10-K attributes mainly to spares and older-generation equipment.
Revenue $8.3B
How the mix changed
- Systems
- Customer support and other
Revenue by segment, FY2022 to FY2026.
US$
See the numbers
06The numbers · Consolidated · US$
How has Lam Research done?
Revenue
$23.2BFY2026
Revenue fell 14.5% to $14.9 billion in FY2024, a 53-week year, then rose to $23.2 billion in FY2026, and Q1 FY2027 revenue was $8.22 billion.
US$
See the numbers
Net profit
$7.3BFY2026
Net income fell to $3.83 billion in FY2024, then rose to $7.27 billion in FY2026; per-share figures reflect the 10-for-1 stock split of Oct 2, 2024.
US$
See the numbers
Profit kept per $100 of revenue
$31.3FY2026
Net income per $100 of revenue was $31.3 in FY2026, up from $25.7 in FY2024, and operating income per $100 was $35.3.
$ of profit per $100 of revenue (net margin)
See the numbers
Free cash flow
$4.9BFY2026
Cash from operations minus capital spending was $4.89 billion in FY2026, down from $5.41 billion, as money customers owed rose by $1.96 billion.
US$ · cash from operations minus spending on plants and equipment
See the numbers
See all yearly numbers
EBITDA here = operating income plus depreciation and amortization (from the cash flow statement). Fiscal years are the company's own (Last Sunday of June. FY2026 ended Jun 28, 2026; FY2024 had 53 weeks and the other years 52). Net profit is the share belonging to the company's owners.
Download Lam Research's yearly and quarterly numbers (CSV, with source ids)
Learn: Fiscal years that don't end in December: Nvidia's FY2027 explained · Stock-based compensation and dilution: pay that becomes shares
Sources (14)
- Form 10-K, fiscal 2024 (year ended Jun 30, 2024)
- Form 10-K, fiscal 2025 (year ended Jun 29, 2025)
- Form 10-K, fiscal 2026 (year ended Jun 28, 2026)
- Q1 fiscal 2025 earnings release (8-K Exhibit 99.1)
- Q1 fiscal 2026 earnings release (8-K Exhibit 99.1)
- Q2 fiscal 2025 earnings release (8-K Exhibit 99.1)
- Q3 fiscal 2025 earnings release (8-K Exhibit 99.1)
- Q4 fiscal 2025 earnings release (8-K Exhibit 99.1)
- Q2 fiscal 2026 earnings release (8-K Exhibit 99.1)
- Q3 fiscal 2026 earnings release (8-K Exhibit 99.1)
- Form 10-Q, Q3 fiscal 2026 (quarter ended Mar 29, 2026)
- Q4 fiscal 2026 earnings release (8-K Exhibit 99.1)
- Q1 fiscal 2027 earnings release (8-K Exhibit 99.1)
- Form 10-Q, Q1 fiscal 2027 (quarter ended Sep 27, 2026)
07Who runs it
Who runs Lam Research, and did they deliver?
Timothy Archer
President and Chief Executive Officer · since 2018
CEO since December 2018. FY2026 total pay was $40.4 million, up from $28.3 million in FY2025, and 500 times the median employee's $80,764. The Nov 3, 2026 pay vote drew 93.12% support.
Douglas Bettinger
Chief Financial Officer · since 2013
CFO since 2013.
Sesha Varadarajan
Chief Operating Officer · since 2026
COO since March 2026, part of operations leadership changes announced in February 2026.
Abhijit Talwalkar
Independent Chair of the Board
Re-elected on Nov 3, 2026 with 87.99% of votes for, the lowest of the 10 directors. The board went from 12 to 10 members after two directors retired on Nov 2, 2026.
What they said, and what happened
5 delivered · 1 too early to tell
Said on Jul 30, 2025
Lam guided Q1 FY2026 revenue of $5.20 billion, plus or minus $300 million.
DeliveredWhat happened
Reported revenue of $5.32 billion, within the range and above the midpoint.
Said on Oct 22, 2025
Lam guided Q2 FY2026 revenue of $5.20 billion, plus or minus $300 million.
DeliveredWhat happened
Reported revenue of $5.34 billion, within the range and above the midpoint.
Said on Jan 28, 2026
Lam guided Q3 FY2026 revenue of $5.70 billion, plus or minus $300 million.
DeliveredWhat happened
Reported revenue of $5.84 billion, within the range and above the midpoint.
Said on Apr 22, 2026
Lam guided Q4 FY2026 revenue of $6.60 billion, plus or minus $400 million.
DeliveredWhat happened
Reported revenue of $6.72 billion, within the range and above the midpoint.
Said on Jul 29, 2026
Lam guided Q1 FY2027 revenue of $8.10 billion, plus or minus $400 million.
DeliveredWhat happened
Reported revenue of $8.22 billion, within the range and above the midpoint.
Said on Oct 21, 2026
Lam guided Q2 FY2027 revenue of $8.60 billion, plus or minus $400 million.
Too early to tellWhat happened
Q2 FY2027 ends on Dec 27, 2026; results are not out yet.
Sources (11)
- Form 10-K, fiscal 2026 (year ended Jun 28, 2026)
- 2026 proxy statement (DEF 14A)
- Form 8-K, Items 5.07 and 8.01: 2026 annual meeting votes, $25 billion buyback authorization and $0.33 dividend
- Form 8-K, Item 5.02: new director Anirudh Devgan; COO and operations leadership transitions
- Form 8-K, Item 5.02: directors Sohail Ahmed and Michael Cannon to retire
- Q4 fiscal 2025 earnings release (8-K Exhibit 99.1)
- Q1 fiscal 2026 earnings release (8-K Exhibit 99.1)
- Q2 fiscal 2026 earnings release (8-K Exhibit 99.1)
- Q3 fiscal 2026 earnings release (8-K Exhibit 99.1)
- Q4 fiscal 2026 earnings release (8-K Exhibit 99.1)
- Q1 fiscal 2027 earnings release (8-K Exhibit 99.1)
08What could go wrong
What could go wrong for Lam Research?
- Regulation
China sales and US export controls
China was about 34% of FY2026 revenue and 42% of FY2024 revenue, measured by where the customer's plant is. Lam's 10-K says US export controls, including entity listings of multiple customers, restrict sales of equipment and spare parts to some customers in China.
Watch China's share of revenue each quarter (35% in Q1 FY2027) and new export rules.
- Concentration
A few customers bring in most revenue
Four customers each brought in about 12% or more of FY2026 revenue, about 55% together. Lam's 10-K says a material cut in orders from its customers, or customer consolidation, could hurt results.
Watch Customers above 10% of revenue in the next 10-K.
- Demand
Chipmakers' spending swings
Lam's 10-K says the semiconductor industry is cyclical and demand for its machines can vary a lot from period to period. Revenue fell 14.5% in FY2024 after flat FY2023.
Watch Quarterly revenue against Lam's guidance, and its comments on industry spending.
- Competition
Losing a production step is hard to reverse
Lam's 10-K says that if a chipmaker picks a rival's machine for a step, it is harder for Lam to sell to that line later. It names Applied Materials, Tokyo Electron and others as rivals.
Watch Systems revenue growth against the industry spending Lam quotes.
- Execution
Supply limits and tariffs
Lam's 10-K says constrained supply of components and raw materials such as rare earth elements could delay orders or raise costs. Aluminum and steel tariffs partly offset its FY2026 gross margin gains.
Watch Gross margin each quarter (52.3% in Q1 FY2027).
- Concentration
Revenue rests on a limited number of products
Lam's 10-K says a substantial share of revenue comes from a limited number of products, priced up to tens of millions of dollars per system. Failing to recognize revenue on even a few systems can hurt a quarter.
Watch Quarterly revenue against Lam's guidance, and new products such as Aether.
09Both sides
What do supporters and critics point to?
What supporters point to
- Revenue rose 26.0% to $23.2 billion in FY2026, and Q1 FY2027 revenue of $8.22 billion was up 54.4% from a year earlier.
- Service, spares and upgrades brought in $8.3 billion in FY2026, 35.9% of revenue, from machines already installed.
- Reported revenue was within Lam's guided range, and above its midpoint, in each of the eight quarters from Q2 FY2025 to Q1 FY2027.
- Cash exceeded debt by $3.70 billion at Sep 27, 2026; in FY2026 Lam spent $3.85 billion on buybacks and $1.27 billion on dividends.
- Lam's Oct 21, 2026 slides say customer visibility extends through 2028.
What critics point to
- Four customers brought in about 55% of FY2026 revenue, and Lam does not say which share belongs to which customer.
- China was about 34% of FY2026 revenue, and Lam's 10-K says US export rules restrict some sales there.
- Revenue fell 14.5% in FY2024, and Lam's 10-K calls the industry cyclical.
- FY2026 cash from operations fell to $5.86 billion from $6.17 billion while net income rose, as money owed by customers rose $1.96 billion.
- CEO pay rose to $40.4 million in FY2026, 500 times the median employee's pay.
10What to watch next
What should you watch next at Lam Research?
Next event
Q2 FY2027 results
Date not announced yet.
Revenue against Lam's guidance
Lam said on Oct 21, 2026 that it expected Q2 FY2027 revenue of $8.60 billion, plus or minus $400 million; Q1 FY2027 was $8.22 billion.
China's share of revenue
China was 35% of Q1 FY2027 revenue and about 34% of FY2026 revenue; Lam's 10-K lists US export controls as a risk.
Use of the new buyback authorization
The Board authorized $25 billion on Nov 5, 2026, on top of $3.03 billion left at Sep 27, 2026; the next 10-Q reports shares bought.
11Key dates
What are the key dates for Lam Research?
| Event | Date | Source |
|---|---|---|
| Quarterly dividend record dateFor the $0.33 a share dividend declared on Nov 5, 2026. | Form 8-K, Items 5.07 and 8.01: 2026 annual meeting votes, $25 billion buyback authorization and $0.33 dividend | |
| Quarterly dividend payment date$0.33 a share, up from $0.26 before the September 2026 quarter's declaration. | Form 8-K, Items 5.07 and 8.01: 2026 annual meeting votes, $25 billion buyback authorization and $0.33 dividend; Q1 fiscal 2027 earnings release (8-K Exhibit 99.1) | |
| Q2 FY2027 quarter endsThe quarter for which Lam gave guidance on Oct 21, 2026. The results date has not been announced. | Q1 fiscal 2027 earnings release (8-K Exhibit 99.1) |
12Key facts
Key facts about Lam Research
- What does Lam Research do?
- Lam Research makes wafer fabrication equipment: machines that deposit thin layers of material on silicon wafers, etch circuit patterns into them and clean them. It also services, upgrades and supplies spare parts for those machines. Lam Research had FY2026 revenue of $23.2 billion and about 23,300 employees on Aug 4, 2026.
- How does Lam Research make money?
- Lam Research makes money by selling chipmaking machines and then servicing them. In FY2026 (year ended Jun 28, 2026), new advanced machines (systems) brought in $14.9 billion, or 64.1% of revenue. Service, spare parts, upgrades and older-generation Reliant tools brought in $8.3 billion, or 35.9%.
- What is Lam Research's business model?
- Lam Research sells machines that chipmakers install in their factories, then earns service, spare parts and upgrade revenue from that installed base. Lam Research reports one business segment. In FY2026 Lam Research spent $2.38 billion on research and development, 10.2% of revenue.
- Is Lam Research profitable?
- Yes. Lam Research's net income was $7.27 billion and its operating income $8.20 billion in FY2026, on revenue of $23.2 billion. Net income was positive in each of the five years from FY2022 to FY2026; the lowest was $3.83 billion in FY2024.
- What is Lam Research's revenue by segment?
- Lam Research reports a single segment, but splits revenue by type. In FY2026, systems revenue was $14.9 billion, up 29.5%, and customer support-related revenue and other was $8.3 billion, up 20.2%. Lam Research's 10-K attributes the systems rise mainly to foundry customers' equipment spending.
- How much revenue does Lam Research make from new machines (systems)?
- Lam Research's systems revenue, from new advanced deposition, etch, clean and other machines, was $14.9 billion in FY2026, 64.1% of revenue, up from $11.5 billion in FY2025. In FY2026, foundries were 54% of Lam Research's equipment and upgrade revenue, memory makers 39% and logic and other chipmakers 7%.
- How much revenue does Lam Research make from service and spare parts?
- Lam Research's customer support-related revenue and other, which covers service, spare parts, upgrades and older-generation Reliant tools, was $8.3 billion in FY2026, 35.9% of revenue, up from $6.9 billion in FY2025. In Q1 FY2027 it was $2.49 billion, against $1.78 billion a year earlier.
- Who are Lam Research's customers?
- Lam Research's FY2026 10-K names Micron Technology, Samsung Electronics, SK hynix and TSMC as its most significant customers in FY2024 to FY2026. Four customers each brought in about 12% or more of Lam Research's FY2026 revenue; the 10-K does not say which. By location of the customer's plant, China was 33.8% of FY2026 revenue, Taiwan 22.5% and Korea 19.4%.
- Who owns Lam Research?
- Lam Research has one class of common stock, one vote per share, with 1,249.2 million shares outstanding on Oct 20, 2026. Lam Research's 2026 proxy lists BlackRock at 9.41%, based on Dec 31, 2023 data. Vanguard Capital Management reported 7.49% on Mar 31, 2026. Directors and executive officers together held less than 1% on Sep 4, 2026.
- What were Lam Research's latest quarterly results?
- Lam Research's revenue was $8.22 billion in Q1 FY2027 (quarter ended Sep 27, 2026), up 54.4% from $5.32 billion in Q1 FY2026. Net income was $2.75 billion, up from $1.57 billion, and diluted EPS was $2.19.
Sources (8)
- Form 10-K, fiscal 2026 (year ended Jun 28, 2026)
- Form 10-K, fiscal 2024 (year ended Jun 30, 2024)
- September quarter 2026 financial results (earnings slides, Oct 21, 2026)
- Form 10-Q, Q1 fiscal 2027 (quarter ended Sep 27, 2026)
- 2026 proxy statement (DEF 14A)
- Schedule 13G by Vanguard Capital Management (7.49%, as of Mar 31, 2026)
- Q1 fiscal 2027 earnings release (8-K Exhibit 99.1)
- Q1 fiscal 2026 earnings release (8-K Exhibit 99.1)
Terms on this page
- Capital expenditures (capex)
- Customer concentration
- Debt-to-equity
- Earnings per share (EPS)
- EBITDA
- Free cash flow
- Gross margin
- Market cap
- Net debt
- Net margin
Each explains the term in plain English, with the same number from other companies on Cityfort.
Go deeper
More detail from the same filings. Open any section.
13What it sells
13What it sells
What does Lam Research sell?
Deposition machines
Lay down thin layers of insulating or conducting material, such as tungsten, molybdenum or copper. Product families include ALTUS, SABRE, Striker and VECTOR.
Etch machines
Carve the circuit pattern into the layers by removing material selectively. Product families include Kiyo, Versys Metal, Akara, Flex, Vantex and Syndion.
Clean machines and dry resist
Clean machines (EOS, DV-Prime, Da Vinci, SP Series, Coronus) remove particles between steps. Aether forms and develops resist films without liquids, to keep patterns accurate at very small sizes in EUV lithography.
Customer support ($8.3B in FY2026)
Service, spare parts and upgrades for machines already installed, plus refurbished older-generation tools sold under the Reliant name.
What it does
- Does: Sells new machines for deposition, etch, clean and dry resist steps to chipmakers ($14.9 billion of systems revenue in FY2026)
- Does: Services, upgrades and supplies spare parts for its installed machines
- Does: Sells older-generation (non-advanced) equipment under its Reliant product line
What it does not do
- Does not: Does not make chips: its customers, such as TSMC, Samsung, SK hynix and Micron, do
- Does not: Does not list lithography machines, the ones that print the pattern, among its products; Aether prepares the resist film used in that step
- Does not: Does not say in its 10-K which customer each of its four largest customer percentages belongs to
14How the money flows
14How the money flows · FY2026
How does money flow through Lam Research?
Money in
- New machines (systems)$14.9B
- Service, spares, upgrades and older tools$8.3B
- Other income, net (interest earned minus interest paid, and other items)$63M
The company
Lam Research
$23.3B came in
Money out
- Cost of making, installing and servicing machines$11.5B
- Research and development$2.4B
- Selling, general and administrative$1.2B
- Income tax$997M
- Net income$7.3B
- Chipmakers paid Lam $23.2 billion in FY2026, about two-thirds of it for new machines.
- Making, installing and servicing the machines cost $11.5 billion.
- Research cost $2.38 billion and selling and administration $1.15 billion, leaving $8.20 billion of operating income.
- Interest earned of $196 million, minus $157 million of interest paid, plus other items, added a net $63 million.
- After $997 million of income tax, $7.27 billion was left as net income.
15What it needs to run
15What it needs to run
What does Lam Research need to run?
Engineers and researchers
About 23,300 regular full-time employees at Aug 4, 2026, up from about 19,000 a year earlier; over 26% work in research and development.
Research spending
Research and development cost $2.38 billion in FY2026, up from $1.60 billion in FY2022.
Factories and offices
Long-lived assets were $3.35 billion at Jun 28, 2026, of which $2.00 billion was in the US.
Parts and materials from suppliers
Lam's 10-K says supply limits, including on rare earth elements, could delay orders or raise costs. It says aluminum and steel tariffs partly offset FY2026 gross margin gains.
Customer acceptance
Shipments to Japan count as revenue only after the customer accepts them. About $468 million of such future revenue sat in inventory at Sep 27, 2026.
16Where it sells
16Where it sells · FY2026, by where the customer's plant is
Where does Lam Research sell?
- China34%
- Taiwan23%
- Korea19%
- Japan9%
- United States7%
- Southeast Asia5%
- Europe3%
17Competitors and what protects it
17Competitors and what protects it
Who does Lam Research compete with?
Applied Materials
NASDAQ: AMAT
Named by Lam as a primary competitor in deposition and in etch.
Tokyo Electron
Named by Lam as a primary competitor in etch and in wet clean.
ASM International
Named by Lam as a competitor in atomic layer deposition and PECVD, two deposition methods.
Hitachi
Named by Lam as a primary competitor in etch.
Screen Holdings and Semes
Named by Lam as primary competitors in wet clean, along with Tokyo Electron.
What protects the business
Each strength is scored 1 (weak) to 5 (strong) for the business, with the reason. It is not a rating of the share.
- Machines already in customers' plants4 of 5
Lam's 10-K says a chipmaker that picks a supplier's machine generally relies on it for that production step for an extended period. Service and spares on installed machines brought in $8.3 billion in FY2026.
- Research scale4 of 5
Research and development cost $2.38 billion in FY2026, and over 26% of about 23,300 employees work in it.
- Range of machines3 of 5
Lam sells deposition, etch, clean and dry resist machines; its 10-K names primary rivals in deposition, etch and wet clean.
- Pricing power over customers2 of 5
Four customers brought in about 55% of FY2026 revenue, and Lam's 10-K lists customer consolidation as a risk.
Weak spot
Few customers in one cyclical industry
Lam's sales depend on how much a handful of chipmakers spend on new plants. Revenue fell 14.5% in FY2024, and four customers made up about 55% of FY2026 revenue.
18Where growth could come from
18Where growth could come from
Where could Lam Research's growth come from?
Lam said on Oct 21, 2026 that it expected Q2 FY2027 (quarter ending Dec 27, 2026) revenue of $8.60 billion, plus or minus $400 million, GAAP gross margin of 52.5% and GAAP diluted EPS of $2.33, plus or minus $0.15. Its slides that day put calendar 2026 industry wafer fab equipment spending in the "mid-$150B range" and preliminary calendar 2027 spending above $200 billion.
Foundry spending
WorkingFoundry 54% of FY2026 equipment revenue, 26% in FY2022
Foundries make chips designed by other companies. Their share of Lam's equipment and upgrade revenue rose from 26% in FY2022 to 54% in FY2026, then was 46% in Q1 FY2027, up from 44% in Q4 FY2026, which Lam attributes mainly to the timing of mature-node investments in China.
Status: Working, on track against what the company said.
Service, spares and upgrades
Working$2.49B in Q1 FY2027 vs $1.78B a year earlier
Customer support revenue rose 20.2% in FY2026. Lam's Oct 21, 2026 slides say it expects this business to grow more than 30% in calendar 2026 and more than 15% in calendar 2027.
Status: Working, on track against what the company said.
Aether dry resist
EarlyCompany expects about $2.5B cumulative revenue by the end of the decade
Aether forms and develops resist films without liquids for EUV lithography. Lam's Oct 21, 2026 slides say it expects about $2.5 billion of cumulative Aether revenue by the end of the decade; it does not report Aether revenue separately.
Status: Early, too early to judge.
Advanced chip packaging
NewPlating systems shipped to more than 20 customers
Lam's Oct 21, 2026 slides say its panel-level packaging plating systems have shipped to more than 20 customers. Packaging connects finished chips to each other and to the device.
Status: New, recently announced.
Status compares progress with what the company itself said it would do: Working = on track against what the company said; Mixed = partly on track; Behind = behind the company's own plan; New = recently announced; Early = too early to judge.
19The company's own measures (non-GAAP)
19The company's own measures · Q1 FY2027
What do Lam Research's own measures show?
Official (GAAP): GAAP gross margin
52.3%
Company's own measure: Non-GAAP gross margin
52.4%
Lam leaves out amortization of intangibles from acquisitions and changes in the value of its elective deferred compensation plan, among other items.
Official (GAAP): GAAP operating margin
40.0%
Company's own measure: Non-GAAP operating margin
40.2%
Same adjustments as gross margin.
Official (GAAP): GAAP net income
$2.8B
Company's own measure: Non-GAAP net income
$2.8B
As above, plus note discount amortization, the tax effect of the adjustments and $11.5 million of tax expense from a change in tax law.
Official (GAAP): GAAP diluted EPS
$2.19
Company's own measure: Non-GAAP diluted EPS
$2.20
Same adjustments as non-GAAPThe company's own "adjusted" numbers, not the official (GAAP) ones. Always read them next to the official figure. Learn more net income. GAAP and non-GAAP EPS were within $0.02 of each other in each quarter from Q1 FY2025 to Q1 FY2027.
These are the company's own measures, defined by the company. They are not comparable across companies, and they are not added together. Each sits beside the nearest official (GAAP) figure.
Learn: Non-GAAP measures: what a company's "adjusted" numbers leave out
Sources (9)
- Q1 fiscal 2027 earnings release (8-K Exhibit 99.1)
- Q4 fiscal 2026 earnings release (8-K Exhibit 99.1)
- Q3 fiscal 2026 earnings release (8-K Exhibit 99.1)
- Q2 fiscal 2026 earnings release (8-K Exhibit 99.1)
- Q1 fiscal 2026 earnings release (8-K Exhibit 99.1)
- Q4 fiscal 2025 earnings release (8-K Exhibit 99.1)
- Q3 fiscal 2025 earnings release (8-K Exhibit 99.1)
- Q2 fiscal 2025 earnings release (8-K Exhibit 99.1)
- Q1 fiscal 2025 earnings release (8-K Exhibit 99.1)
20Financial strength and debt
20Financial strength · Sep 27, 2026
How much debt does Lam Research have?
- Total debt$3.7B
- Cash and investments$7.4B
- Net cash (cash minus debt)$3.7B
- Net worth (shareholders' money)$13.9B
- Debt to equity
- 0.27×
- $ of debt for every $1 of shareholders' money
- Debt is senior notes and finance leases, as the balance sheet presents them. Cash is cash and cash equivalents. Net cash is a Cityfort calculation from the Q1 FY2027 10-Q.
- The notes, $3.75 billion at face value, come due between 2029 and 2060, at rates from 1.90% to 4.875%. Lam repaid $750 million of notes that matured on Mar 15, 2026.
- A $2.0 billion revolving credit line, available until Jan 25, 2030, was undrawn, and nothing was outstanding under the $2.0 billion commercial paper program at Jun 28, 2026.
- Customers had prepaid or been billed $2.66 billion of deferred revenue at Sep 27, 2026, up from $2.43 billion at Jun 28, 2026.
21Who owns it
21Who owns it · ownership as of Sep 4, 2026
Who owns Lam Research?
- Officers and directors (as a group), shares
- 0.3%
Share classes
Holders of 5% or more
From the company's proxy statement (DEF 14A), later Schedule 13G filings and the share counts on its latest annual or quarterly report. Each holder row shows the date of its own filing.
Insider trades · Form 4 data as of Nov 6, 2026
What did Lam Research's insiders report trading?
Lam Research's insiders made 51 Form 4A filing an insider must make within two business days of buying or selling the company's shares. Learn more filings in the 12 months to Nov 6, 2026.
They reported no purchases and 67 sales (689,843 shares) in the open market or privately (codes P and S).
58 of the 67 sales were on forms with the Rule 10b5-1 plan box checked.
The same filings report 78 other share transactions (F: 33, M: 20, A: 19, G: 6).
They also report 27 transactions in options, stock units or other derivatives.
Insiders are a company's officers, directors and owners of more than 10% of a class of its shares. Most changes in their holdings must be reported to the SEC on a Form 4 within two business days. Source: SEC Form 4 filings on EDGAR.
- P
- a purchase in the open market or privately
- S
- a sale in the open market or privately
- A
- a grant, award or other acquisition from the company under Rule 16b-3
- F
- shares withheld or handed over to pay an exercise price or tax when an award is received, exercised or vests
- M
- exercise or conversion of an option or other derivative, exempt under Rule 16b-3
- G
- a bona fide gift
Code meanings: General Instruction 8 of Form 4 (SEC).
The latest 25 of 145 transactions
Shares: A = acquired, D = disposed of. A price the filing gives only in a footnote shows as “See filing”. The 10b5-1 box is checked when at least one trade on the form was made under a Rule 10b5-1 plan. A Form 4/A replaces the form it amends. See all of Lam Research's Form 4 filings on EDGAR.
Learn: How to read a proxy statement (DEF 14A): Nvidia's 2026 proxy · Form 4 insider filings: who files, the codes and the footnotes · Rule 10b5-1 trading plans: how insiders pre-schedule their trades
22What it does with profit
22What it does with profit
What does Lam Research do with its profit?
Dividend per share
$1.04FY2026
Dividend paid for each share, by financial year.
$ per share
See the numbers
Buyback · Jun 28, 2026
Spent $3.85 billion on buybacks in FY2026; about $4.04 billion remained under the $10 billion authorization of May 2024.
$3.9B
Buyback · Sep 27, 2026
Spent $1.02 billion on buybacks in Q1 FY2027 (cash flow statement; the 10-Q puts the program cost at $1.01 billion), including $1.00 billion of accelerated repurchases with two banks; $3.03 billion remained.
$1.0B
Buyback · Nov 5, 2026
The Board authorized up to $25 billion of further buybacks, in addition to the remaining balance, with no end date.
$25.0B
Sources (5)
- Form 10-K, fiscal 2024 (year ended Jun 30, 2024)
- Form 10-K, fiscal 2026 (year ended Jun 28, 2026)
- Form 10-Q, Q1 fiscal 2027 (quarter ended Sep 27, 2026)
- Q1 fiscal 2027 earnings release (8-K Exhibit 99.1)
- Form 8-K, Items 5.07 and 8.01: 2026 annual meeting votes, $25 billion buyback authorization and $0.33 dividend
23Governance signals
23Governance signals
What do Lam Research's governance filings show?
- Auditor
- KPMG LLP, since 2025
- Auditor changes
- Sep 8, 2025: Ernst & Young LLP → KPMG LLP (Lam dismissed EY, its auditor since 1981, and engaged KPMG for FY2026. The 8-K reports no disagreements and no reportable events.)
- Audit qualifications
- None reported
- Related-party dealings
- The 2026 proxy reports that BlackRock money market funds held by Lam paid it about $24.2 million of interest and dividends in FY2026; the 2026 proxy lists BlackRock at 9.41%, based on its Dec 31, 2023 holdings.
- Credit rating
- No public credit rating found in a search of rating agency sites on Nov 6, 2026
Flags to know about
auditor
First auditor change since 1981
Lam replaced Ernst & Young, its auditor since 1981, with KPMG for FY2026. The 8-K reports no disagreements.
other
Shareholder proposal on special meetings
A shareholder proposal to give shareholders the right to call special meetings drew 42.22% support on Nov 3, 2026 and was not approved.
other
Officer liability charter change
Shareholders approved a charter amendment limiting officers' personal liability (officer exculpation) on Nov 4, 2025.
other
No material legal proceedings reported
Lam's FY2026 10-K says it is not currently a party to any legal proceedings that it believes material.
disclosure
Customer names not linked to revenue shares
Lam names its most significant customers and gives the revenue shares of its largest ones, but not which share belongs to which customer. It reports deferred revenue, not a backlog figure.
Sources (7)
- Form 10-K, fiscal 2026 (year ended Jun 28, 2026)
- Form 8-K, Item 4.01: auditor change from Ernst & Young to KPMG
- 2026 proxy statement (DEF 14A)
- Form 10-Q, Q1 fiscal 2027 (quarter ended Sep 27, 2026)
- Form 8-K, Items 5.07 and 8.01: 2026 annual meeting votes, $25 billion buyback authorization and $0.33 dividend
- Form 8-K, Items 5.02, 5.03, 5.07: 2025 Stock Incentive Plan and officer-liability charter amendment approved
- Q1 fiscal 2027 earnings release (8-K Exhibit 99.1)
24What the market paid
24What the market paid · price as of Nov 5, 2026
What did the market pay for Lam Research on Nov 5, 2026?
Price as of Nov 5, 2026 (shown for education; prices change daily).
Price as of Nov 5, 2026: Lam closed at $185.20 on Nasdaq, against $221.43 at the Nov 4, 2026 close. Times 1,249.2 million shares (Oct 20, 2026), that is a market value of about $231.3 billion (Cityfort calculation from the Nov 5, 2026 Nasdaq closing price and the Q1 FY2027 10-Q cover). P/E is price ÷ earnings per share: 32.2 on FY2026 diluted EPS of $5.76. P/B is market value ÷ shareholders' equity: 16.6 on equity of $13.9 billion at Sep 27, 2026. The $0.33 quarterly dividend, times four, is about 0.71% of that price.
- Share price
- $185.20
- Market value (market cap)
- $231.3B
- P/E
- 32.2×
- P/B
- 16.6×
More price-based ratios · as of Nov 5, 2026
Each ratio divides a number from the company's filings by the market value or share price on Nov 5, 2026. Prices change daily, so these ratios do too.
Price to sales (P/S)
8.9×
$231.3B market value ÷ $26.1B revenue (four quarters to Sep 27, 2026) = 8.9×
Cityfort calculation from the Nov 5, 2026 closing price and the Q2 FY2026 to Q1 FY2027 10-Qs and earnings releases. Source: LRCX historical prices: closing prices on Nov 4 and Nov 5, 2026; Form 10-Q, Q1 fiscal 2027 (quarter ended Sep 27, 2026); Form 10-K, fiscal 2026 (year ended Jun 28, 2026) and 6 more
How price ratios workDividend yield
0.56%
$1.04 dividends per share (FY2026) ÷ $185.20 share price = 0.56%
Cityfort calculation from the FY2026 10-K and the Nov 5, 2026 closing price. Source: LRCX historical prices: closing prices on Nov 4 and Nov 5, 2026; Form 10-Q, Q1 fiscal 2027 (quarter ended Sep 27, 2026); Form 10-K, fiscal 2026 (year ended Jun 28, 2026) and 1 more
What dividend yield meansFree cash flow yield
2.1%
$4.9B free cash flow (FY2026) ÷ $231.3B market value = 2.1%
Cityfort calculation from the FY2026 10-K and the Nov 5, 2026 closing price. Source: LRCX historical prices: closing prices on Nov 4 and Nov 5, 2026; Form 10-Q, Q1 fiscal 2027 (quarter ended Sep 27, 2026); Form 10-K, fiscal 2026 (year ended Jun 28, 2026) and 1 more
What free cash flow means
Shares used for the market value: 1,249.2 million ($185.20 × 1,249.2 million shares ≈ $231.3B). Source: Form 10-Q, Q1 fiscal 2027 (quarter ended Sep 27, 2026); Form 10-K, fiscal 2026 (year ended Jun 28, 2026)
Source: LRCX historical prices: closing prices on Nov 4 and Nov 5, 2026; Form 10-Q, Q1 fiscal 2027 (quarter ended Sep 27, 2026); Form 10-K, fiscal 2026 (year ended Jun 28, 2026) and 1 more
Sources (9)
- LRCX historical prices: closing prices on Nov 4 and Nov 5, 2026
- Form 10-Q, Q1 fiscal 2027 (quarter ended Sep 27, 2026)
- Form 10-K, fiscal 2026 (year ended Jun 28, 2026)
- Form 8-K, Items 5.07 and 8.01: 2026 annual meeting votes, $25 billion buyback authorization and $0.33 dividend
- Q2 fiscal 2026 earnings release (8-K Exhibit 99.1)
- Q3 fiscal 2026 earnings release (8-K Exhibit 99.1)
- Form 10-Q, Q3 fiscal 2026 (quarter ended Mar 29, 2026)
- Q4 fiscal 2026 earnings release (8-K Exhibit 99.1)
- Q1 fiscal 2027 earnings release (8-K Exhibit 99.1)
25How it got here
25How it got here
How did Lam Research get here?
1980
Milestone
Incorporated
Lam Research was incorporated in 1980 and is based in Fremont, California.
2018
Milestone
Timothy Archer becomes CEO
Archer has been President and CEO since December 2018.
2023
Crisis
Restructuring plan
A restructuring plan that began in FY2023 ended about 1,760 jobs at a cumulative cost of $181.9 million. It was substantially complete by Jun 30, 2024.
2024
Crisis
Revenue falls 14.5%
FY2024 revenue fell to $14.9 billion, and China was 42% of revenue.
2024
Milestone
Stock split and $10 billion buyback
Lam announced a $10 billion buyback authorization in May 2024 and split each share into ten on Oct 2, 2024.
2025
Business-model change
Foundries become the largest equipment buyers
Foundries' share of Lam's equipment and upgrade revenue reached 45% in FY2025 and 54% in FY2026, against 26% in FY2022, while memory fell from 60% to 39%.
2025
Milestone
New auditor
Lam replaced Ernst & Young, auditor since 1981, with KPMG in September 2025.
2026
Milestone
Larger quarter and a $25 billion buyback
Q1 FY2027 revenue reached $8.22 billion, with operating income of $40.0 per $100 of revenue. On Nov 5, 2026 the Board authorized $25 billion of further buybacks.
Sources (8)
- Form 10-K, fiscal 2026 (year ended Jun 28, 2026)
- Form 10-K, fiscal 2024 (year ended Jun 30, 2024)
- Form 8-K, Items 7.01 and 8.01: stock split and $10 billion buyback authorization announced
- Form 8-K, Items 3.03 and 5.03: ten-for-one stock split effective Oct 2, 2024
- Form 10-K, fiscal 2023 (year ended Jun 25, 2023)
- Form 8-K, Item 4.01: auditor change from Ernst & Young to KPMG
- Q1 fiscal 2027 earnings release (8-K Exhibit 99.1)
- Form 8-K, Items 5.07 and 8.01: 2026 annual meeting votes, $25 billion buyback authorization and $0.33 dividend
26Sources and changes
Where every number on this page comes from
Sources (28 documents)
- S1Form 10-K, fiscal 2026 (year ended Jun 28, 2026) · Lam Research Corporation (SEC EDGAR) · Tier 1: company or exchange filing · Aug 7, 2026
- S2Form 10-K, fiscal 2025 (year ended Jun 29, 2025) · Lam Research Corporation (SEC EDGAR) · Tier 1: company or exchange filing · Aug 11, 2025
- S3Form 10-K, fiscal 2024 (year ended Jun 30, 2024) · Lam Research Corporation (SEC EDGAR) · Tier 1: company or exchange filing · Aug 29, 2024
- S4Form 10-K, fiscal 2023 (year ended Jun 25, 2023) · Lam Research Corporation (SEC EDGAR) · Tier 1: company or exchange filing · Aug 15, 2023
- S5Form 10-Q, Q1 fiscal 2027 (quarter ended Sep 27, 2026) · Lam Research Corporation (SEC EDGAR) · Tier 1: company or exchange filing · Oct 22, 2026
- S6Form 10-Q, Q3 fiscal 2026 (quarter ended Mar 29, 2026) · Lam Research Corporation (SEC EDGAR) · Tier 1: company or exchange filing · Apr 23, 2026
- S7Q1 fiscal 2027 earnings release (8-K Exhibit 99.1) · Lam Research Corporation (SEC EDGAR) · Tier 1: company or exchange filing · Oct 21, 2026
- S8Q4 fiscal 2026 earnings release (8-K Exhibit 99.1) · Lam Research Corporation (SEC EDGAR) · Tier 1: company or exchange filing · Jul 29, 2026
- S9Q3 fiscal 2026 earnings release (8-K Exhibit 99.1) · Lam Research Corporation (SEC EDGAR) · Tier 1: company or exchange filing · Apr 22, 2026
- S10Q2 fiscal 2026 earnings release (8-K Exhibit 99.1) · Lam Research Corporation (SEC EDGAR) · Tier 1: company or exchange filing · Jan 28, 2026
- S11Q1 fiscal 2026 earnings release (8-K Exhibit 99.1) · Lam Research Corporation (SEC EDGAR) · Tier 1: company or exchange filing · Oct 22, 2025
- S12Q4 fiscal 2025 earnings release (8-K Exhibit 99.1) · Lam Research Corporation (SEC EDGAR) · Tier 1: company or exchange filing · Jul 30, 2025
- S13Q3 fiscal 2025 earnings release (8-K Exhibit 99.1) · Lam Research Corporation (SEC EDGAR) · Tier 1: company or exchange filing · Apr 23, 2025
- S14Q2 fiscal 2025 earnings release (8-K Exhibit 99.1) · Lam Research Corporation (SEC EDGAR) · Tier 1: company or exchange filing · Jan 29, 2025
- S15Q1 fiscal 2025 earnings release (8-K Exhibit 99.1) · Lam Research Corporation (SEC EDGAR) · Tier 1: company or exchange filing · Oct 23, 2024
- S162026 proxy statement (DEF 14A) · Lam Research Corporation (SEC EDGAR) · Tier 1: company or exchange filing · Sep 24, 2026
- S17Form 8-K, Items 5.07 and 8.01: 2026 annual meeting votes, $25 billion buyback authorization and $0.33 dividend · Lam Research Corporation (SEC EDGAR) · Tier 1: company or exchange filing · Nov 5, 2026
- S18Schedule 13G by Vanguard Capital Management (7.49%, as of Mar 31, 2026) · SEC EDGAR · Tier 1: company or exchange filing · Apr 30, 2026
- S19Schedule 13G/A by The Vanguard Group (0%, event Mar 13, 2026) · SEC EDGAR · Tier 1: company or exchange filing · Mar 27, 2026
- S20Form 8-K, Item 4.01: auditor change from Ernst & Young to KPMG · Lam Research Corporation (SEC EDGAR) · Tier 1: company or exchange filing · Sep 11, 2025
- S21Form 8-K, Item 5.02: new director Anirudh Devgan; COO and operations leadership transitions · Lam Research Corporation (SEC EDGAR) · Tier 1: company or exchange filing · Feb 3, 2026
- S22Form 8-K, Item 5.02: directors Sohail Ahmed and Michael Cannon to retire · Lam Research Corporation (SEC EDGAR) · Tier 1: company or exchange filing · Aug 27, 2026
- S23Form 8-K, Items 3.03 and 5.03: ten-for-one stock split effective Oct 2, 2024 · Lam Research Corporation (SEC EDGAR) · Tier 1: company or exchange filing · Oct 2, 2024
- S24Form 8-K, Items 7.01 and 8.01: stock split and $10 billion buyback authorization announced · Lam Research Corporation (SEC EDGAR) · Tier 1: company or exchange filing · May 21, 2024
- S25Form 8-K, Item 1.01: $2.0 billion revolving credit facility (Third Amended and Restated Credit Agreement) · Lam Research Corporation (SEC EDGAR) · Tier 1: company or exchange filing · Jan 29, 2025
- S26Form 8-K, Items 5.02, 5.03, 5.07: 2025 Stock Incentive Plan and officer-liability charter amendment approved · Lam Research Corporation (SEC EDGAR) · Tier 1: company or exchange filing · Nov 6, 2025
- S27LRCX historical prices: closing prices on Nov 4 and Nov 5, 2026 · Nasdaq · Tier 1: company or exchange filing · Nov 5, 2026
- S28September quarter 2026 financial results (earnings slides, Oct 21, 2026) · Lam Research Corporation · Tier 1: company or exchange filing · Oct 21, 2026
Changes to this page (v1 · Nov 6, 2026)
- v1 · Nov 6, 2026First version, through Q1 FY2027 (quarter ended Sep 27, 2026). (first version)
Numbers come only from tier 1 and tier 2 sources. Read how we research.
Disclaimer
For learning only. Cityfort is not a registered investment adviser or broker-dealer and does not recommend buying or selling any security. Prices shown are dated and may be out of date.
Investing in securities involves risk, including loss of capital. Before making any investment decision, do your own research and consider consulting a registered investment adviser or other qualified professional.
Cityfort, its owners and contributors may or may not hold securities of companies covered. Cityfort is not paid by any company it covers. Content is not an offer or solicitation to buy or sell any security, including in any initial public offering.
Read the positions policyRead the full disclaimerHide the full disclaimer
Cityfort publishes general educational content that explains how listed companies work. Cityfort is not registered with the US Securities and Exchange Commission or any state securities regulator as an investment adviser, and is not a broker-dealer or a member of FINRA. Cityfort does not provide investment, tax or legal advice, recommendations, ratings, price targets or any opinion on whether to buy, sell or hold any security. Nothing on the site is tailored to any person's circumstances.
All information is taken from publicly available sources, mainly company filings with the SEC, which are listed on each page with dates. We work to keep it accurate and correct errors publicly, but we do not guarantee that it is complete, accurate or up to date. Any market price or price-based ratio shown is dated, may be out of date by the time you read it, and is included only to explain concepts.
Statements by company management, including forward-looking statements and guidance, are reported as the company's statements, with their date and source; they are not our forecasts. Adjusted (non-GAAP) figures are the company's own measures and are shown next to the official (GAAP) figures.