Technology · NASDAQ: KLAC
KLA: how the business works
KLA makes machines that inspect and measure silicon wafers while chips are made; FY2026 revenue was $13.58 billion.
By Hardik Bhandare · Checked against filings: . Editorial policy. Corrections
Follow KLA
Email me when KLA's page is updated after earnings.
We'll send a confirmation email first. See our privacy policy.
KLA Corporation · Milpitas, California · Founded 1975
Updated for Q1 FY2027 · checked
- Revenue, FY2026
- $13.6B
- Net income, FY2026
- $4.8B
- Semiconductor Process Control share of revenue, FY2026
- 90.2%
- Backlog, Jun 30, 2026
- $12.57B
- Employees, Jun 2026
- About 17,000
The short version
KLA in 5 points
1 · What it sells
KLA makes machines and software that find defects and measure features on wafers and chip masks, and services them; wafer inspection alone brought in $6.63 billion of FY2026 revenue.
2 · Who pays it
In FY2026, chipmakers buying through Semiconductor Process Control paid 90.2% of KLA's revenue, electronics and circuit-board makers 5.5% and specialty chipmakers 4.3%.
3 · What it keeps from $100
Of every $100 that came in during FY2026, KLA kept $35.0 as net income, including other income such as interest earned, while its operating income was $41.7 per $100 of revenue.
4 · Where the operating profit comes from
In FY2026 the Semiconductor Process Control segment earned $5.48 billion of segment profit, against $108 million for PCB and Component Inspection.
5 · The one thing to watch
China was 29.8% of KLA's FY2026 revenue and 34.5% in Q1 FY2027, and the 10-K says U.S. export controls could limit its sales there.
Sources: From KLA's FY2026 10-K and Q1 FY2027 10-Q · checked
01Where the money goes · FY2026
Where does $100 of KLA's money go?
KLA · FY2026
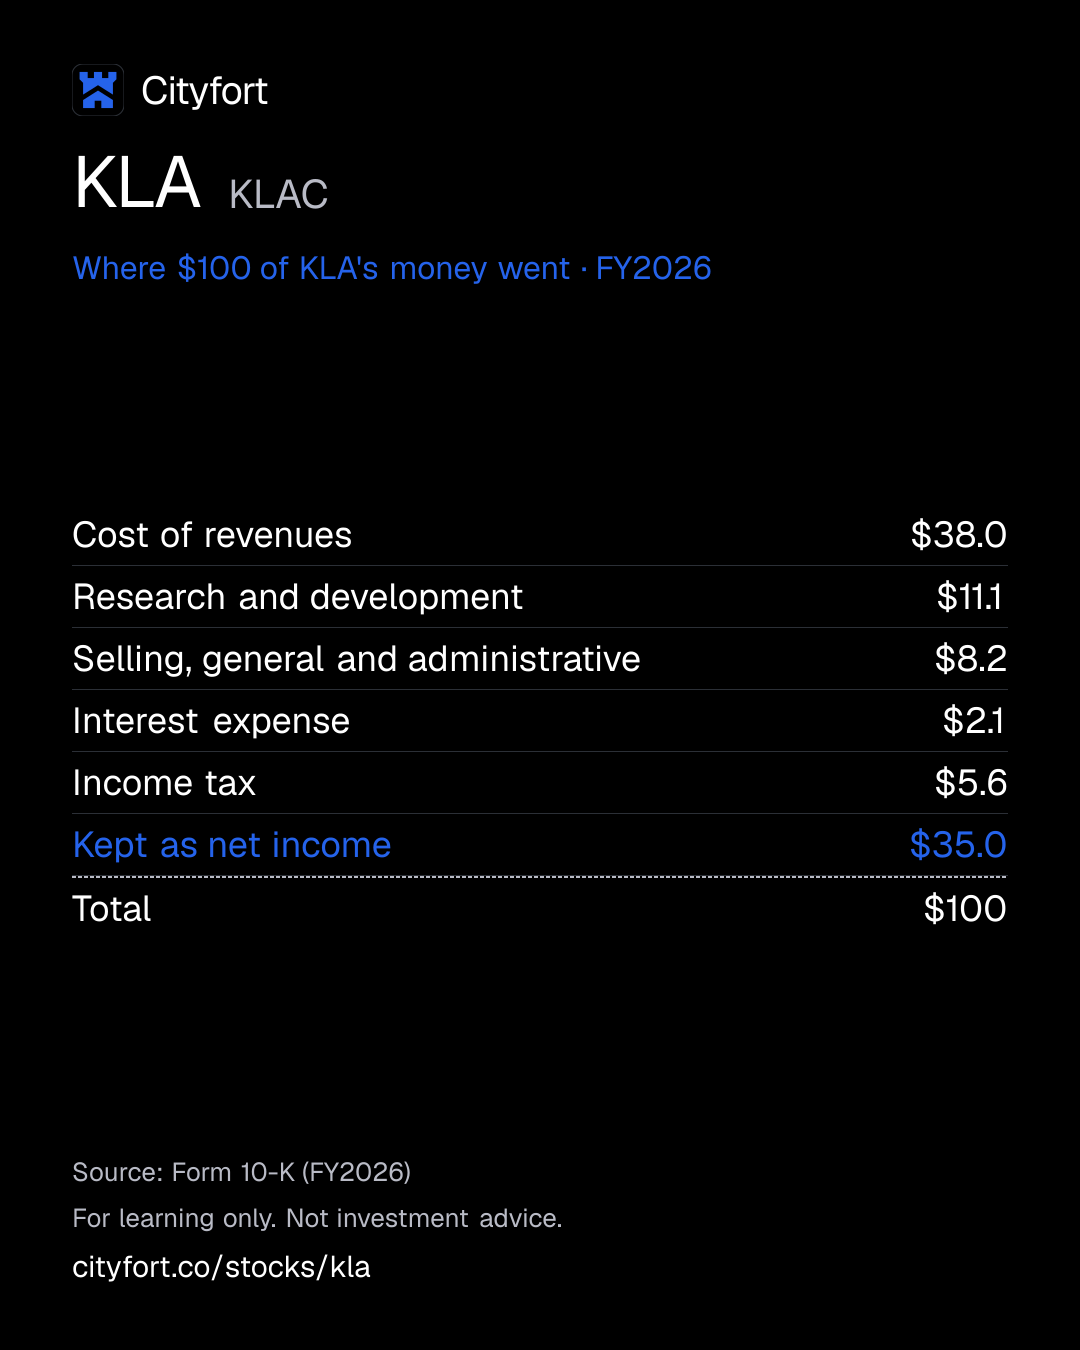
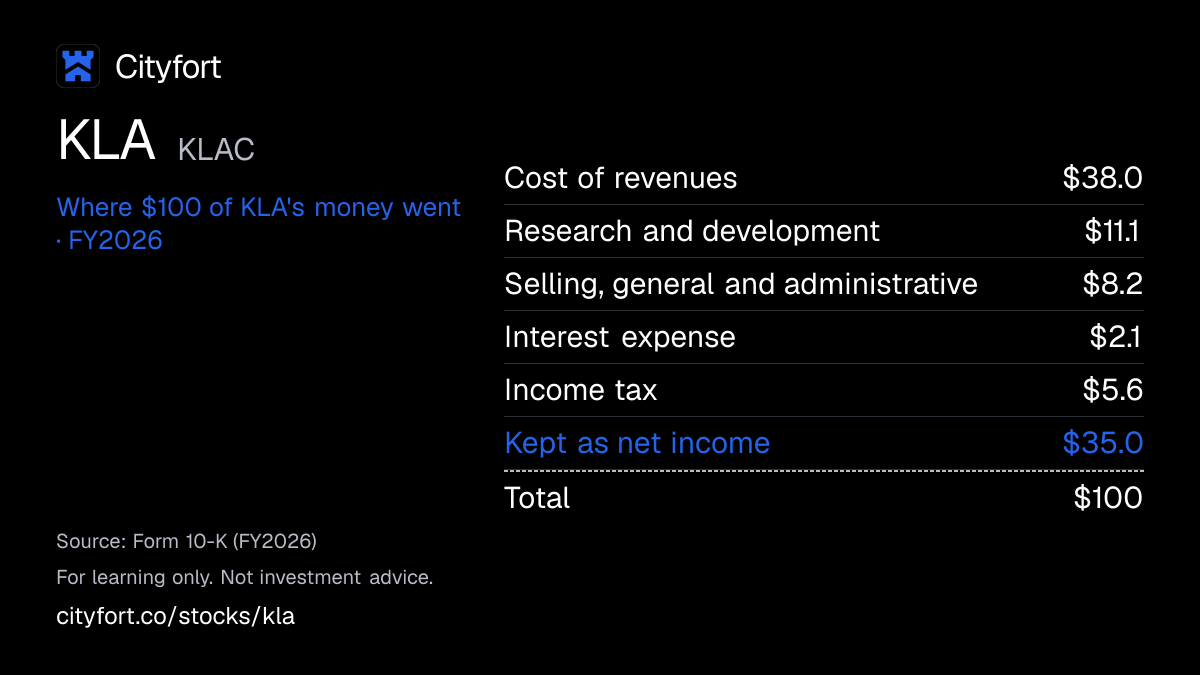
Receipt for every $100
| Cost of revenues | $38.0 |
|---|---|
| Research and development | $11.1 |
| Selling, general and administrative | $8.2 |
| Interest expense | $2.1 |
| Income tax | $5.6 |
| Kept as net income | $35.0 |
| Total | $100 |
Each line = amount ÷ total money in × 100. Lines may not add to exactly $100 because of rounding.
How this is worked out
Cityfort calculation from FY2026 10-K. Of every $100 that came in during FY2026 (revenue plus $229.6 million of other income, net): each line = line ÷ $13.81 billion × 100.
Save this receipt as an image
Embed this receipt or the key numbers
Paste this code into a blog or website to show the card you choose, with a link back to this page.
Each week: the next company due to report earnings, explained in 5 points.
No tips. Unsubscribe anytime.
We'll send a confirmation email. See our privacy policy.
02The business in one line
What does KLA do?
Chipmakers pay KLA for machines that catch defects on wafers and for service on them; the biggest cost is making and servicing those machines, and $35.0 of every $100 that came in during FY2026 was left as net income.
- Chipmakers such as TSMC, which was about 19% of FY2026 revenue, buy KLA's inspection and measurement machines and pay for service on the ones already installed.
- Of every $100 that came in during FY2026, $38.0 went on making and servicing machines and $11.1 on research and development.
03Who pays it
Who pays KLA?
Chipmakers (foundry, logic and memory)
90.2%
of revenue
Buy inspection, metrology and software products and services through the Semiconductor Process Control segment: $12.24 billion in FY2026.
Specialty chipmakers
4.3%
of revenue
Makers of MEMS, radio-frequency and power chips buy deposition and etch tools: $584 million in FY2026.
Electronics, circuit-board and chip-package makers
5.5%
of revenue
Buy machines to inspect and pattern PCBs, chip substrates and packaged chips: $750 million in FY2026.
- Chipmakers (foundry, logic and memory)90.2%
- Specialty chipmakers4.3%
- Electronics, circuit-board and chip-package makers5.5%
Customer concentration
KLA's FY2026 10-K names Taiwan Semiconductor Manufacturing Company (TSMC) as the only customer above 10% of revenue in FY2024 to FY2026, and says one customer was about 19% of revenue in FY2026 and FY2025. In Q1 FY2027, two unnamed customers were about 21% and 13% of revenue. Shares are a Cityfort calculation from segment revenue in the FY2026 10-K.
- Largest customer
- 19%
04How it makes money
How does KLA make money?
KLA's machines help chipmakers get more good chips from each wafer, and its installed machines earn service revenue.
When revenue fell 6.5% in FY2024, operating income per $100 of revenue fell to $34.1. When revenue rose 11.7% in FY2026, it reached $41.7, and gross margin was 61.3%. KLA's income statement has no operating income line, so operating income is a Cityfort calculation from the FY2024 and FY2026 10-Ks.
Operating income per $100 of revenue
$34.1$41.7
FY2024 to FY2026
- Chipmakers spend well above $10 billion on an advanced chip factory
- Smaller, more complex chips raise the demands on inspection and measurement
- KLA machines find defects early, so more chips per wafer work
- Installed machines need service, parts and upgrades, which KLA sells
- Profit pays for research ($1.53 billion in FY2026), dividends and buybacks
↺ Step 5 feeds back into step 1.
05Business segments · FY2026
Which businesses make up KLA?
Semiconductor Process Control
90.2%Inspection, metrology and software for chip, wafer and reticle makers, plus related services. Revenue rose 12% in FY2026.
Revenue $12.2B ($12,245M) · Operating profit $5.5B ($5,483M)
Specialty Semiconductor Process
4.3%Deposition and etch tools for MEMS, radio-frequency and power chips. Revenue fell 1% in FY2026, with lower sales in China.
Revenue $584M · Operating profit $64.6M
PCB and Component Inspection
5.5%Inspection and patterning machines for circuit boards, chip substrates and chip packages. Revenue rose 21% in FY2026; the segment lost money in FY2024 and FY2025, years with impairment charges.
Revenue $750M · Operating profit $108M
How the mix changed
- Semiconductor Process Control
- Specialty Semiconductor Process
- PCB and Component Inspection
Revenue by segment, FY2022 to FY2026.
US$
See the numbers
06The numbers · Consolidated · US$
How has KLA done?
Revenue
$13.6BFY2026
Revenue fell to $9.81 billion in FY2024 from $10.50 billion, rose to $13.58 billion in FY2026, and reached $4.14 billion in Q1 FY2027.
US$
See the numbers
Net income
$4.8BFY2026
Net income fell to $2.76 billion in FY2024 and rose to $4.83 billion in FY2026. EPS is on the post-split basis of the 10-for-1 split of Jun 11, 2026: FY2024 and FY2025 as restated in the FY2026 10-K, Q4 FY2025 in the Q4 FY2026 earnings release and Q1 to Q3 FY2026 in the Q1 FY2027 10-Q; FY2022, FY2023 and Q2 FY2024 to Q3 FY2025 are as reported ÷10 (Cityfort calculation from the 10-Ks, 10-Qs and earnings releases for those periods).
US$
See the numbers
Net income for every $100 of revenue
$35.6FY2026
Net income per $100 of revenue fell from $36.1 in FY2022 to $28.1 in FY2024 and was $35.6 in FY2026. EBITDA is a Cityfort calculation from the 10-Ks and earnings releases.
Net margin: $ of net income per $100 of revenue
See the numbers
Free cash flow
$3.8BFY2026
Free cash flow rose from $3.01 billion in FY2022 to $3.77 billion in FY2026, with capital spending between $277 million and $376 million a year.
US$ · cash from operations minus spending on plants and equipment
See the numbers
See all yearly numbers
EBITDA here = operating income plus depreciation and amortization (from the cash flow statement). Fiscal years are the company's own: Fiscal year ends Jun 30. FY2026 ran from Jul 1, 2025 to Jun 30, 2026. Net income is the share belonging to the company's owners.
Learn: Fiscal years that don't end in December: Nvidia's FY2027 explained · Stock-based compensation and dilution: pay that becomes shares
Sources (22)
- Form 10-K for FY2022
- Form 10-K for FY2023
- Form 10-K for FY2024
- Form 10-K for FY2026
- Form 10-K for FY2025
- Form 10-Q for Q2 FY2024
- Q2 FY2025 earnings release (8-K Ex. 99.1)
- Form 10-Q for Q3 FY2024
- Q3 FY2025 earnings release (8-K Ex. 99.1)
- Q4 FY2025 earnings release (8-K Ex. 99.1)
- Form 10-Q for Q1 FY2025
- Q1 FY2026 earnings release (8-K Ex. 99.1)
- Form 10-Q for Q2 FY2025
- Form 10-Q for Q3 FY2025
- Q4 FY2026 earnings release (8-K Ex. 99.1)
- Form 10-Q for Q1 FY2026
- Form 10-Q for Q1 FY2027
- Form 10-Q for Q2 FY2026
- Q2 FY2026 earnings release (8-K Ex. 99.1)
- Form 10-Q for Q3 FY2026
- Q3 FY2026 earnings release (8-K Ex. 99.1)
- Q1 FY2027 earnings release (8-K Ex. 99.1)
07Who runs it
Who runs KLA, and did they deliver?
Rick Wallace
President and Chief Executive Officer · since 2006
CEO since Jan 2006 and President since Nov 2008; joined KLA Instruments in 1988. FY2026 total pay was $29.95 million, 300 times the median employee's.
Bren Higgins
Executive Vice President and Chief Financial Officer · since 2013
CFO since Aug 2013.
Ahmad Khan
President, Semiconductor Products and Customers · since 2024
In this role since Jul 2024; earlier spent nine years at Applied Materials.
Mary Beth Wilkinson
Executive Vice President, Chief Legal Officer and Corporate Secretary · since 2020
In this role since Sep 2020.
Robert Calderoni
Independent Chairman of the Board · since 2022
Chairman since Nov 2022; the CEO and chair roles are held by different people.
What they said, and what happened
3 delivered · 1 too early to tell
Said on Jan 29, 2026
Q3 FY2026 revenue of $3.35 billion, plus or minus $150 million (Jan 29, 2026 earnings release).
DeliveredWhat happened
Revenue was $3.42 billion.
Said on Apr 29, 2026
Q4 FY2026 revenue of $3.575 billion, plus or minus $200 million (Apr 29, 2026 earnings release).
DeliveredWhat happened
Revenue was $3.66 billion.
Said on Jul 28, 2026
Q1 FY2027 revenue of $4.0 billion, plus or minus $200 million, and GAAP diluted EPS of $1.14, plus or minus $0.10 (Jul 28, 2026 earnings release).
DeliveredWhat happened
Revenue was $4.14 billion and GAAP diluted EPS $1.18.
Said on Oct 28, 2026
Q2 FY2027 revenue of $4.7 billion, plus or minus $200 million (Oct 28, 2026 earnings release).
Too early to tellWhat happened
The quarter ends Dec 31, 2026.
08What could go wrong
What could go wrong for KLA?
- Concentration
A few chipmakers bring in much of the revenue
TSMC was about 19% of FY2026 revenue. In Q1 FY2027, two customers were about 21% and 13%. KLA lists its highly concentrated customer base as a risk.
Watch Customer shares in each 10-Q and 10-K
- Regulation
Export controls limit sales to China
China was 29.8% of FY2026 revenue and 34.5% in Q1 FY2027. The 10-K says export controls and tariffs have already hurt results and could limit sales in China.
Watch China share of revenue and new U.S. trade rules
- Demand
Chipmakers' spending goes in cycles
KLA's sales depend on chipmakers' equipment budgets, which the 10-K calls cyclical. Revenue fell 6.5% in FY2024, to $9.81 billion.
Watch Quarterly revenue against guidance
- Regulation
Tariffs on parts and products
The 10-K says U.S. tariffs, retaliatory trade measures and uncertainty over tariff rules may have a material adverse impact on results.
Watch Gross margin, which was 61.9% in Q1 FY2027
- Execution
Parts from single or limited suppliers
Some parts come from only one supplier or a small group. The 10-K says losing them could disrupt deliveries to customers.
Watch Inventory, $4.09 billion at Sep 30, 2026, and delivery comments
- Execution
Write-downs of acquired businesses
KLA booked $289.5 million of goodwill and intangible impairment charges in FY2024 and $239.1 million in FY2025, in the PCB and Component Inspection segment.
Watch PCB and Component Inspection segment profit
09Supporters vs. critics
What do supporters and critics point to?
What supporters point to
- Revenue rose from $9.81 billion in FY2024 to $13.58 billion in FY2026, and Q1 FY2027 revenue of $4.14 billion was up from $3.21 billion a year earlier.
- Backlog (orders placed but not yet delivered) was $12.57 billion at Jun 30, 2026, up from $7.86 billion a year earlier; the 10-K attributes the rise to the AI infrastructure buildout.
- Services revenue, from keeping installed machines running, rose from $1.91 billion in FY2022 to $3.13 billion in FY2026.
- Semiconductor Process Control earned $5.48 billion of segment profit in FY2026, on $12.24 billion of revenue.
- Revenue was inside the range KLA had guided for Q3 FY2026, Q4 FY2026 and Q1 FY2027.
What critics point to
- TSMC was about 19% of FY2026 revenue, and two unnamed customers were about 21% and 13% of Q1 FY2027 revenue.
- China was 29.8% of FY2026 revenue and 34.5% in Q1 FY2027, and the 10-K says U.S. export controls could limit sales there.
- Revenue fell 6.5% in FY2024, to $9.81 billion, and net income fell to $2.76 billion; the 10-K calls chipmakers' equipment spending cyclical.
- KLA booked $289.5 million of goodwill and intangible impairment charges in FY2024 and $239.1 million in FY2025, in its PCB and Component Inspection segment.
- Some parts come from only one supplier or a small group, and the 10-K says losing them could disrupt deliveries to customers.
10What to watch next
What should you watch next at KLA?
Next event
Q2 FY2027 results
Date not announced yet.
Q2 FY2027 revenue against KLA's outlook
KLA said on Oct 28, 2026 that it expected $4.7 billion, plus or minus $200 million; Q1 FY2027 revenue was $4.14 billion.
China's share of revenue
China was 34.5% of Q1 FY2027 revenue, up from 29.8% in FY2026; the 10-K says U.S. export controls could limit sales there.
How much the biggest customers buy
Two unnamed customers were about 21% and 13% of Q1 FY2027 revenue; each 10-Q and 10-K gives these shares.
Gross margin under tariffs
Gross margin was 61.9% in Q1 FY2027 and 61.3% in FY2026; the 10-K says tariffs may have a material adverse impact on results.
11Key facts
Key facts about KLA
- What does KLA do?
- KLA Corporation, based in Milpitas, California, makes machines and software that find defects and measure features on silicon wafers and chip masks while chips are made. Its Semiconductor Process Control segment brought in 90.2% of FY2026 revenue.
- How does KLA make money?
- KLA sells inspection and measurement machines and services the ones already installed. In FY2026, the year ended Jun 30, 2026, wafer inspection brought in $6.63 billion, patterning $2.71 billion and services $3.13 billion of its $13.58 billion of revenue.
- Who are KLA's customers?
- Mainly chipmakers. KLA's FY2026 10-K names Taiwan Semiconductor Manufacturing Company (TSMC) as the only customer above 10% of revenue, at about 19% in FY2026, and China was 29.8% of FY2026 revenue.
- How big is KLA?
- In FY2026, the year ended Jun 30, 2026, KLA had revenue of $13.58 billion and net income of $4.83 billion, up from $12.16 billion and $4.06 billion in FY2025. It had about 17,000 full-time employees at Jun 30, 2026.
- How did KLA do in its latest quarter?
- In Q1 FY2027, the quarter ended Sep 30, 2026, KLA Corporation had revenue of $4.14 billion and net income of $1.55 billion, up from $3.21 billion and $1.12 billion in Q1 FY2026.
- Who owns KLA?
- KLA Corporation has one class of common stock with one vote per share. Its 2026 proxy statementThe yearly filing about shareholder votes, the board and executive pay. Learn more lists BlackRock at 8.8%, based on Dec 31, 2023 holdings, and Vanguard Capital Management at 7.5%; directors and executive officers held under 1% on Sep 9, 2026.
- How much debt does KLA have?
- At Jun 30, 2026, KLA Corporation had $5.89 billion of debt, all fixed-rate senior notes due between 2029 and 2062, and $4.90 billion of cash and marketable securities.
- Does KLA pay dividends?
- Yes. KLA paid $1.06 billion of dividends in FY2026 and spent $2.29 billion buying back its own shares. On Aug 6, 2026 it declared a quarterly dividend of $0.23 a share, after a 10-for-1 stock split on Jun 11, 2026.
Terms on this page
- Capital expenditures (capex)
- Customer concentration
- Debt-to-equity
- Earnings per share (EPS)
- EBITDA
- Free cash flow
- Net debt
- Net margin
- Revenue vs net income
- Stock buyback
Each explains the term in plain English, with the same number from other companies on Cityfort.
Go deeper
More detail from the same filings. Open any section.
12What it sells
12What it sells
What does KLA sell?
Wafer inspection
Machines that find, locate and review defects on wafers during chipmaking. $6.63 billion of revenue in FY2026, 49% of the total.
Patterning
Metrology machines that measure pattern sizes, film thickness and layer alignment, plus inspection of reticles (the masks used to print chip patterns). $2.71 billion in FY2026.
Services
Service teams, parts and support that keep installed KLA machines running. $3.13 billion in FY2026, 23% of revenue.
Specialty semiconductor process tools
Deposition and etch machines for makers of MEMS sensors, radio-frequency chips and power chips for cars and factories. $503 million in FY2026.
PCB and component inspection
Machines that inspect, test and pattern printed circuit boards (PCBs), chip substrates and packaged chips. $460 million in FY2026.
Other
Refurbished and remanufactured older machines, and upgrades to previous-generation products. $153 million in FY2026.
Think of it like this
Like a quality inspector with a microscope on a factory line: it does not make the product, but it spots flaws early so fewer chips are thrown away.
What it does
- Does: Sells inspection, measurement and software products to chipmakers, from research labs to full production
- Does: Services and upgrades the machines it has installed
- Does: Sells deposition and etch tools for specialty chips
- Does: Sells inspection and production machines for circuit boards and chip packages
What it does not do
- Does not: Does not make chips; its customers are chipmakers and electronics makers
- Does not: Does not build most parts itself: it assembles and tests machines in-house and buys components and subassemblies from suppliers
Sources (1)
13How the money flows
13How the money flows · FY2026
How does money flow through KLA?
Money in
- Revenue$13.6B
- Other income, net (including interest earned)$230M
The company
KLA
$13.8B came in
Money out
- Cost of revenues (making and servicing machines)$5.3B
- Research and development$1.5B
- Selling, general and administrative$1.1B
- Interest expense$284M
- Income tax$775M
- Net income$4.8B
- In FY2026, customers paid KLA $13.58 billion, and it booked $229.6 million of other income, net.
- $5.26 billion went on making, installing and servicing its machines.
- $1.53 billion went on research and development and $1.13 billion on selling and administration.
- $284.4 million paid interest on debt and $775.2 million went on income tax.
- $4.83 billion was left as net income.
Sources (1)
14What it needs to run
14What it needs to run
What does KLA need to run?
Engineers and service staff
About 17,000 full-time employees at Jun 30, 2026: about 27% in research and development and 27% in customer service.
Research spending
$1.53 billion on research and development in FY2026, 11.3% of revenue, at centers in the U.S., U.K., India, China, Singapore and Israel.
Patents
Over 9,100 active patents and over 3,600 pending applications at Jun 30, 2026, with terms running to 2045.
Suppliers of parts
KLA buys components and subassemblies from outside vendors; some parts come from only one supplier or a small group.
Assembly sites
Main manufacturing in the U.S., Singapore, Israel, China and several European countries.
Sources (1)
15Where it sells
15Where it sells · FY2026
Where does KLA sell?
- China29.8%
- Taiwan26.8%
- Korea13.5%
- North America13%
- Japan6.7%
- Europe and Israel5.4%
- Rest of Asia4.8%
Sources (1)
16Competitors and what protects it
16Competitors and what protects it
Who does KLA compete with?
Applied Materials
NASDAQ: AMAT
Named in KLA's FY2026 10-K among its competitors; the 10-K says some rivals have greater resources than KLA.
ASML Holding
Named in KLA's FY2026 10-K among its competitors.
Hitachi High-Tech
Named in KLA's FY2026 10-K among its competitors.
Lasertec
Named in KLA's FY2026 10-K among its competitors.
Onto Innovation
Named in KLA's FY2026 10-K among its competitors.
What protects the business
Each strength is scored 1 (weak) to 5 (strong) for the business, with the reason. It is not a rating of the share.
- Technology and patents4 of 5
KLA spent $1.53 billion on research in FY2026 and held over 9,100 active patents at Jun 30, 2026. The 10-K credits its competitive position mainly to its technology.
- Machines already in customers' plants4 of 5
Services brought in $3.13 billion in FY2026, up from $1.91 billion in FY2022.
- Pricing of its machines3 of 5
Gross margin stayed between 59.8% and 61.3% from FY2022 to FY2026, including the FY2024 revenue fall. These margins are a Cityfort calculation from the FY2022 to FY2026 10-Ks.
Weak spot
A few large customers
One customer, TSMC, was about 19% of FY2026 revenue, and two customers were about 21% and 13% of Q1 FY2027 revenue.
17Where growth could come from
17Where growth could come from
Where could KLA's growth come from?
In its Oct 28, 2026 earnings release, KLA said it expects Q2 FY2027 revenue of $4.7 billion, plus or minus $200 million, and GAAP diluted EPS of $1.41, plus or minus $0.11.
AI-related spending on the most advanced chips
WorkingBacklog $12.57B (Jun 2026) vs $7.86B
The FY2026 10-K attributes the higher backlog (orders customers have placed but KLA has not yet delivered) to demand from the AI infrastructure buildout.
Status: Working, on track against what the company said.
Service on installed machines
Working$3.13B in FY2026 vs $2.33B in FY2024
Services revenue was $1.91 billion in FY2022 and 23% of revenue in FY2026.
Status: Working, on track against what the company said.
Memory chipmakers in Korea
WorkingKorea revenue +26.2% in FY2026
The FY2026 10-K links the rise to spending on high-bandwidth memory (HBM) and advanced DRAM.
Status: Working, on track against what the company said.
Advanced chip packaging
WorkingPCB segment profit $108M (FY2026) vs loss of $281M
PCB and Component Inspection revenue rose 21% in FY2026; the FY2026 10-K cites demand from advanced packaging.
Status: Working, on track against what the company said.
Sales in China
Mixed$4.05B in FY2026 vs $4.04B in FY2025
The FY2026 10-K says spending by Chinese companies on older chip technology was largely offset by U.S. export-control limits.
Status: Mixed, partly on track.
Status compares progress with what the company itself said it would do: Working = on track against what the company said; Mixed = partly on track; Behind = behind the company's own plan; New = recently announced; Early = too early to judge.
18The company's own measures (non-GAAP)
18The company's own measures · Q1 FY2027
What do KLA's own measures show?
Official (GAAP): GAAP net income
$1.5B
Company's own measure: Non-GAAP net income
$1.6B
KLA leaves out $43.0 million of acquisition-related charges, $20.2 million of Pillar Two minimum-tax charges and $5.8 million of discrete tax items, less a $14.6 million tax effect.
Official (GAAP): GAAP diluted EPS
$1.18
Company's own measure: Non-GAAP diluted EPS
$1.22
Same adjustments as non-GAAPThe company's own "adjusted" numbers, not the official (GAAP) ones. Always read them next to the official figure. Learn more net income. In Q4 FY2026 the two figures were $1.05 and $1.04.
These are the company's own measures, defined by the company. They are not comparable across companies, and they are not added together. Each sits beside the nearest official (GAAP) figure.
Learn: Non-GAAP measures: what a company's "adjusted" numbers leave out
19Financial strength and debt
19Financial strength · Jun 30, 2026
How much debt does KLA have?
- Total debt$5.9B
- Cash and investments$4.9B
- Net debt (debt minus cash)$985M
- Net worth (shareholders' money)$6.3B
- Debt to equity
- 0.93×
- $ of debt for every $1 of shareholders' money
- Net debt is a Cityfort calculation from the FY2026 10-K: long-term debt of $5.89 billion (carrying value) minus cash of $1.65 billion and marketable securities of $3.25 billion.
- All debt is eight fixed-rate senior notes with $5.95 billion of principal, due between 2029 and 2062. In 2026 KLA swapped $2.00 billion of them to floating rates.
- A $1.5 billion revolving credit line runs to Jul 3, 2030; nothing was borrowed under it at Jun 30, 2026.
- Operating lease liabilities of $264.3 million are not counted as debt here.
- The 10-K lists credit ratings of A (Fitch), A2 (Moody's) and A- (S&P).
20Who owns it
20Who owns it · ownership as of Sep 9, 2026
Who owns KLA?
- Officers and directors (as a group), shares
- 0.1%
Share classes
Holders of 5% or more
From the company's proxy statement (DEF 14A), later Schedule 13G filings and the share counts on its latest annual or quarterly report. Each holder row shows the date of its own filing.
Learn: How to read a proxy statement (DEF 14A): Nvidia's 2026 proxy · Form 4 insider filings: who files, the codes and the footnotes
21What it does with profit
21What it does with profit
What does KLA do with its profit?
Dividend per share
$0.80FY2026
Dividend paid for each share, by financial year.
$ per share
See the numbers
Buyback · Mar 12, 2026
The Board approved a new $7 billion buyback program, on top of the $5 billion program announced in April 2025.
$7.0B
Buyback · Jun 30, 2026
Spent $2.29 billion buying back 18.2 million shares (split-adjusted) in FY2026; $9.74 billion of authorization remained.
$2.3B
Buyback · Sep 30, 2026
Spent $936 million on buybacks in Q1 FY2027; $8.81 billion of authorization remained.
$936M
22Governance signals
22Governance signals
What do KLA's governance filings show?
- Auditor
- PricewaterhouseCoopers LLP
- Auditor changes
- None in the period covered
- Audit qualifications
- None reported
- Related-party dealings
- The 2026 proxy lists ordinary-course purchases from and sales to companies where KLA directors or a former director serve, the largest $126.7 million with Rapidus Corporation. It says no related person had a material interest in them.
- Credit rating
- Fitch, Moody's and S&P (as listed in KLA's FY2026 10-K) A (Fitch) / A2 (Moody's) / A- (S&P) (outlook Not stated in the 10-K), Jun 30, 2026
A credit rating describes the company's ability to repay debt. It is not a rating of the share.
Flags to know about
regulatory
Conditions from past settlements
According to the FY2026 10-K, KLA settled certain government actions and other legal proceedings related to its historical stock option practices and agreed, as a condition, to comply with certain laws, such as the books-and-records provisions of the federal securities laws. The 10-K says a violation could give rise to additional government actions or other legal proceedings.
other
Independent chair and board
Eight of the nine director nominees in the 2026 proxy are independent, and all three main board committees are made up of independent directors.
disclosure
BlackRock figure dates from 2023
The 2026 proxy's 8.8% for BlackRock rests on a Schedule 13GA filing by anyone who owns more than 5% of a company's shares and does not seek control. Learn more with Dec 31, 2023 holdings.
23How it got here
23How it got here
How did KLA get here?
1975
Milestone
KLA Instruments begins
KLA Instruments started operations; Tencor Instruments followed in 1976.
1997
Business-model change
Merger forms KLA-Tencor
KLA Instruments and Tencor merged in Apr 1997; the company now calls itself KLA Corporation.
2019
Business-model change
Orbotech acquired
KLA bought Orbotech on Feb 20, 2019; Orbotech product lines are now sold in the PCB and Component Inspection segment.
2024
Crisis
Revenue falls and write-downs
FY2024 revenue fell 6.5% to $9.81 billion, with $289.5 million of impairment charges; China reached 42.8% of revenue.
2026
Milestone
$7 billion buyback program
At its Mar 12, 2026 investor day, KLA announced a new $7 billion buyback program and a higher dividend.
2026
Milestone
Ten-for-one stock split
The split took effect at the close of trading on Jun 11, 2026: each shareholder received nine more shares for every share held.
2026
Milestone
Backlog reaches $12.57 billion
Backlog was $12.57 billion at Jun 30, 2026, up from $7.86 billion a year earlier.
24Sources and changes
Where every number on this page comes from
Sources (27 documents)
- S1Form 10-Q for Q1 FY2027 · SEC EDGAR · Tier 1: company or exchange filing · Oct 29, 2026
- S2Form 10-K for FY2026 · SEC EDGAR · Tier 1: company or exchange filing · Aug 6, 2026
- S3Form 10-Q for Q3 FY2026 · SEC EDGAR · Tier 1: company or exchange filing · Apr 30, 2026
- S4Form 10-Q for Q2 FY2026 · SEC EDGAR · Tier 1: company or exchange filing · Jan 30, 2026
- S5Form 10-Q for Q1 FY2026 · SEC EDGAR · Tier 1: company or exchange filing · Oct 31, 2025
- S6Form 10-K for FY2025 · SEC EDGAR · Tier 1: company or exchange filing · Aug 8, 2025
- S7Form 10-Q for Q3 FY2025 · SEC EDGAR · Tier 1: company or exchange filing · May 1, 2025
- S8Form 10-Q for Q2 FY2025 · SEC EDGAR · Tier 1: company or exchange filing · Jan 31, 2025
- S9Form 10-Q for Q1 FY2025 · SEC EDGAR · Tier 1: company or exchange filing · Oct 31, 2024
- S10Form 10-K for FY2024 · SEC EDGAR · Tier 1: company or exchange filing · Aug 5, 2024
- S11Form 10-Q for Q3 FY2024 · SEC EDGAR · Tier 1: company or exchange filing · Apr 26, 2024
- S12Form 10-Q for Q2 FY2024 · SEC EDGAR · Tier 1: company or exchange filing · Jan 26, 2024
- S13Form 10-K for FY2023 · SEC EDGAR · Tier 1: company or exchange filing · Aug 4, 2023
- S14Form 10-K for FY2022 · SEC EDGAR · Tier 1: company or exchange filing · Aug 5, 2022
- S152026 proxy statement (DEF 14A) · SEC EDGAR · Tier 1: company or exchange filing · Sep 22, 2026
- S16Q1 FY2027 earnings release (8-K Ex. 99.1) · SEC EDGAR · Tier 1: company or exchange filing · Oct 28, 2026
- S17Q4 FY2026 earnings release (8-K Ex. 99.1) · SEC EDGAR · Tier 1: company or exchange filing · Jul 28, 2026
- S18Q3 FY2026 earnings release (8-K Ex. 99.1) · SEC EDGAR · Tier 1: company or exchange filing · Apr 29, 2026
- S19Q2 FY2026 earnings release (8-K Ex. 99.1) · SEC EDGAR · Tier 1: company or exchange filing · Jan 29, 2026
- S20Q1 FY2026 earnings release (8-K Ex. 99.1) · SEC EDGAR · Tier 1: company or exchange filing · Oct 29, 2025
- S21Q4 FY2025 earnings release (8-K Ex. 99.1) · SEC EDGAR · Tier 1: company or exchange filing · Jul 31, 2025
- S22Q3 FY2025 earnings release (8-K Ex. 99.1) · SEC EDGAR · Tier 1: company or exchange filing · Apr 30, 2025
- S23Q2 FY2025 earnings release (8-K Ex. 99.1) · SEC EDGAR · Tier 1: company or exchange filing · Jan 30, 2025
- S24Form 8-K: ten-for-one stock split approved (May 7, 2026) · SEC EDGAR · Tier 1: company or exchange filing · May 7, 2026
- S25Form 8-K: investor day and $7 billion repurchase program (Mar 12, 2026) · SEC EDGAR · Tier 1: company or exchange filing · Mar 12, 2026
- S26Form 8-K: quarterly dividend of $0.23 declared (Aug 6, 2026) · SEC EDGAR · Tier 1: company or exchange filing · Aug 6, 2026
- S27Form 8-K: $1.5 billion revolving credit agreement (Jul 8, 2025) · SEC EDGAR · Tier 1: company or exchange filing · Jul 8, 2025
Changes to this page (v1 · Nov 20, 2026)
- v1 · Nov 20, 2026First version. (first version)
Numbers come only from tier 1 and tier 2 sources. Read how we research.
Disclaimer
For learning only. Cityfort is not a registered investment adviser or broker-dealer and does not recommend buying or selling any security. Prices shown are dated and may be out of date.
Investing in securities involves risk, including loss of capital. Before making any investment decision, do your own research and consider consulting a registered investment adviser or other qualified professional.
Cityfort, its owners and contributors may or may not hold securities of companies covered. Cityfort is not paid by any company it covers. Content is not an offer or solicitation to buy or sell any security, including in any initial public offering.
Read the positions policyRead the full disclaimerHide the full disclaimer
Cityfort publishes general educational content that explains how listed companies work. Cityfort is not registered with the US Securities and Exchange Commission or any state securities regulator as an investment adviser, and is not a broker-dealer or a member of FINRA. Cityfort does not provide investment, tax or legal advice, recommendations, ratings, price targets or any opinion on whether to buy, sell or hold any security. Nothing on the site is tailored to any person's circumstances.
All information is taken from publicly available sources, mainly company filings with the SEC, which are listed on each page with dates. We work to keep it accurate and correct errors publicly, but we do not guarantee that it is complete, accurate or up to date. Any market price or price-based ratio shown is dated, may be out of date by the time you read it, and is included only to explain concepts.
Statements by company management, including forward-looking statements and guidance, are reported as the company's statements, with their date and source; they are not our forecasts. Adjusted (non-GAAP) figures are the company's own measures and are shown next to the official (GAAP) figures.