Consumer Staples · NYSE: HSY
Hershey: how the business works
Hershey makes Hershey's and Reese's chocolate, other candy and salty snacks, and sold $11.7 billion of them in FY2025, 87.7% in the US.
By Hardik Bhandare · Checked against filings: . Editorial policy. Corrections
Follow Hershey
Email me when Hershey's page is updated after earnings.
We'll send a confirmation email first. See our privacy policy.
The Hershey Company · Hershey, Pennsylvania · Founded 1894
Updated for Q3 FY2026 · checked
- Net sales, FY2025
- $11.7 billion
- Net income, FY2025
- $883.3M
- Full-time employees, Dec 31, 2025
- About 17,550
- Founded
- 1894
- Votes held by Hershey Trust Company, Mar 6, 2026
- 79.0%
The short version
Hershey in 5 points
1 · What it sells
Hershey sells chocolate, candy, mints, gum and salty snacks; North America Confectionery was 81.1% of FY2025 net sales of $11.7 billion, Salty Snacks 10.9% and International 8.1%.
2 · Who pays it
Distributors and stores pay Hershey: US customers paid 87.7% of FY2025 net sales and customers abroad 12.3%; one distributor, McLane, bought about a quarter.
3 · What it keeps from $100
Of every $100 of FY2025 net sales, Hershey kept $7.55 as net income; operating profit was $1,441.5M, and $491.0M of the $1,868.5M rise in cost of sales came from unfavorable mark-to-market on commodity hedges.
4 · Where the operating profit comes from
North America Confectionery earned $2,494M of FY2025 segment income on 81.1% of net sales, against $242M for Salty Snacks and $3.3M for International.
5 · The one thing to watch
Gross margin was 46.1% in Q3 FY2026, against 32.6% a year earlier, while North American candy prices rose about 13% and volume fell about 11%.
Sources: From Hershey's FY2025 10-K, Q3 FY2026 10-Q and Q3 FY2026 earnings release · checked
01Where the money goes · FY2025
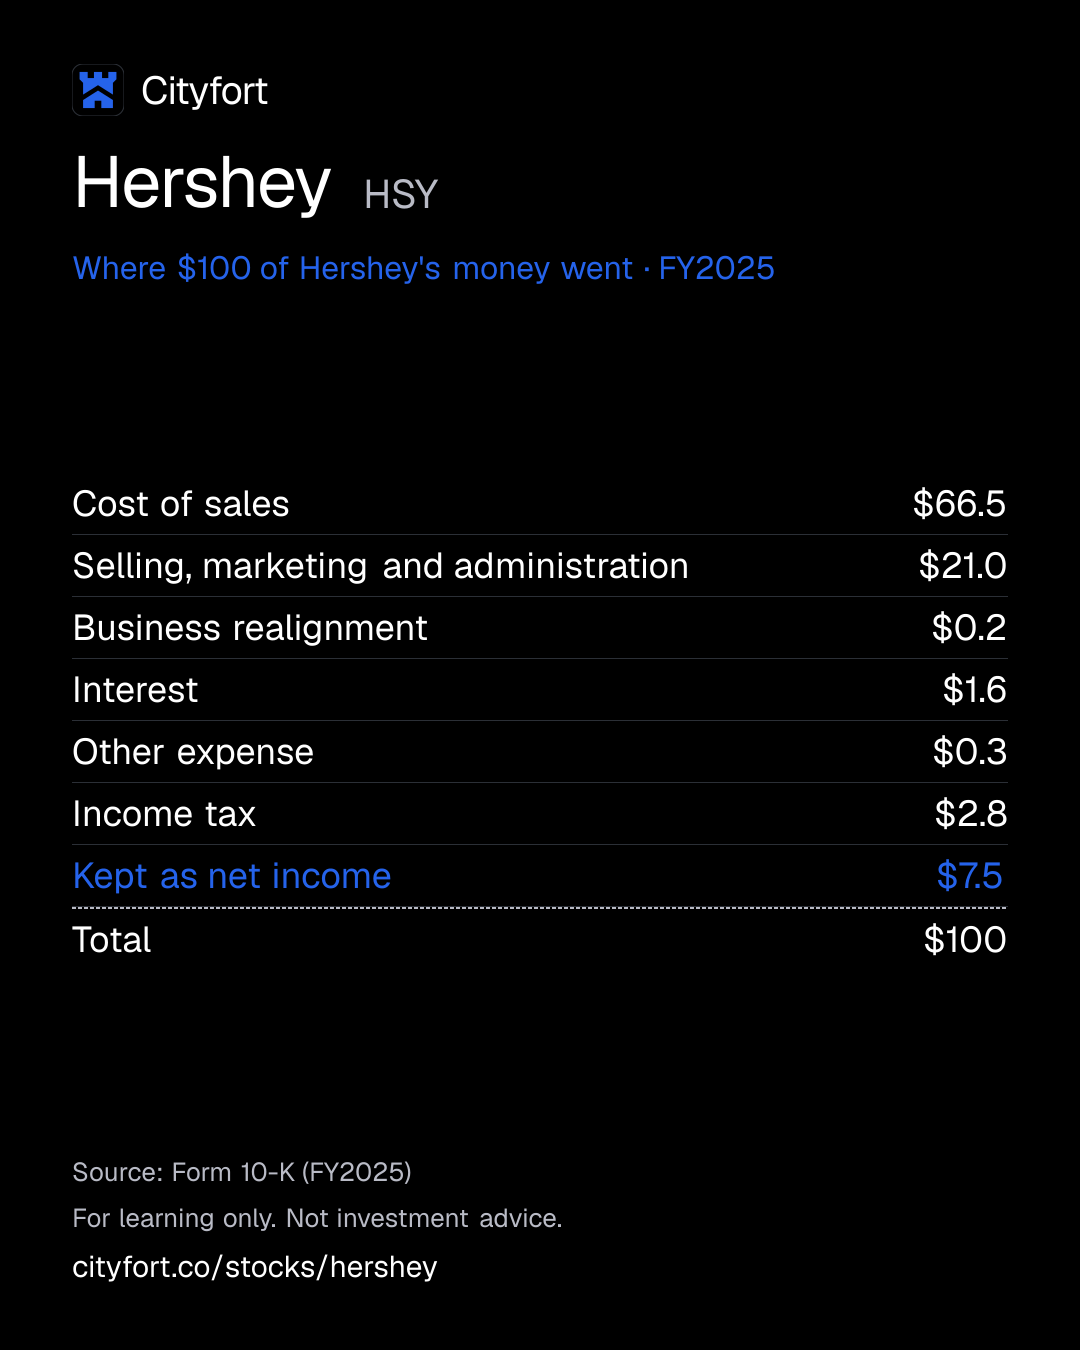
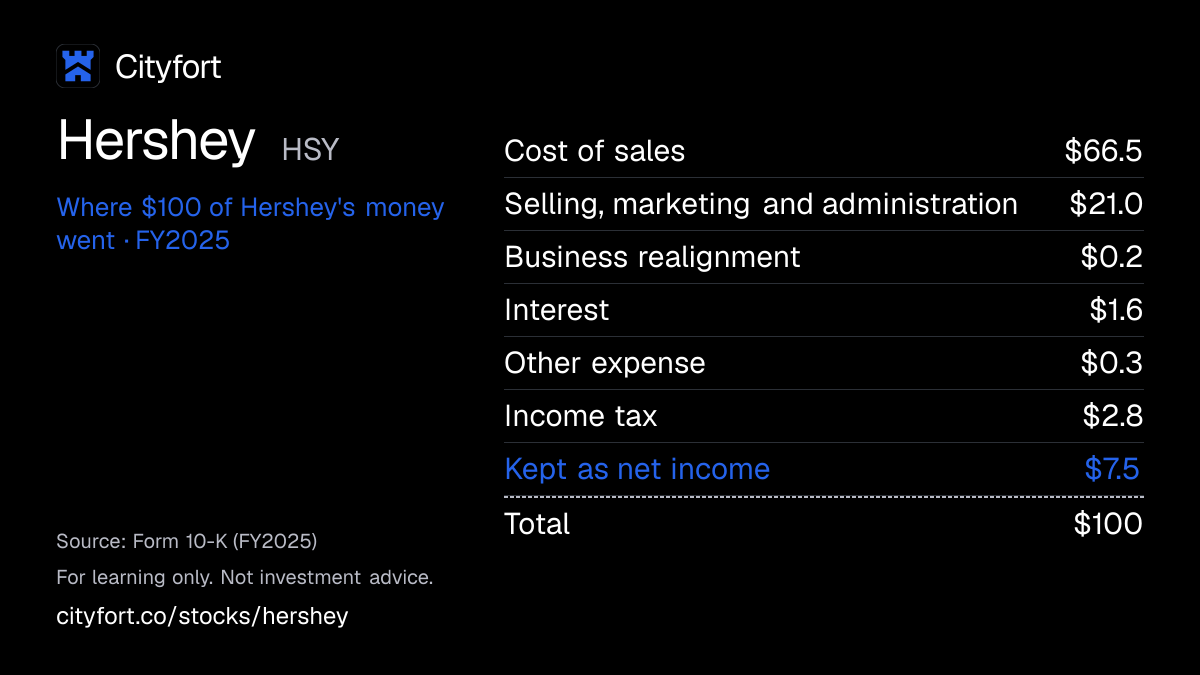
Where does $100 of Hershey's money go?
Hershey · FY2025
Receipt for every $100
| Cost of sales | $66.5 |
|---|---|
| Selling, marketing and administration | $21.0 |
| Business realignment | $0.2 |
| Interest | $1.6 |
| Other expense | $0.3 |
| Income tax | $2.8 |
| Kept as net income | $7.5 |
| Total | $100 |
Each line = amount ÷ total money in × 100. Lines may not add to exactly $100 because of rounding.
How this is worked out
Cityfort calculation from the FY2025 10-K. Of every $100 of net sales in FY2025: each line = line ÷ $11.7 billion of net sales × 100. Hershey reported no other income that year.
Save this receipt as an image
Embed this receipt or the key numbers
Paste this code into a blog or website to show the card you choose, with a link back to this page.
Each week: the next company due to report earnings, explained in 5 points.
No tips. Unsubscribe anytime.
We'll send a confirmation email. See our privacy policy.
02The business in one line
What does Hershey do?
Stores and distributors pay Hershey for branded candy and snacks; about $66 of every $100 goes into making them, and $7.55 was left as net income in FY2025.
- McLane, a wholesale distributor and the main supplier to Wal-Mart, bought about 27% of FY2025 net sales. Hershey's other customers include grocery, mass-market, drug, club, convenience and dollar stores.
- Cocoa is the main raw material, so cost of sales swings with cocoa prices: gross margin was 33.5% in FY2025, against 47.3% in FY2024.
03Who pays it
Who pays Hershey?
McLane Company (wholesale distributor)
27%
of revenue
A wholesale distributor that is the main supplier to Wal-Mart stores. It bought about 27% of Hershey's FY2025 net sales, the same share as in FY2024.
Other distributors and retailers
Share of revenue not disclosed
Grocery, mass-market, drug, club, convenience and dollar stores, vending companies and other wholesale distributors. Orders are usually filled within days.
Customer concentration
McLane was about 27% of FY2025 net sales and about 16% of accounts receivable at Dec 31, 2025. No other customer was more than 10% of receivables.
- Largest customer
- 27%
Sources (1)
04How it makes money
How does Hershey make money?
Famous brands let Hershey charge well above its ingredient costs: gross margin was 47.3% in FY2024, then 33.5% as cocoa costs rose.
Hershey turns cocoa and sugar into branded candy that shoppers ask for by name. The gap between ingredient costs and shelf prices is its profit. In FY2025 cocoa costs rose faster than prices, and net income per $100 of sales fell to $7.6.
Net income per $100 of net sales
$16.5$7.6
FY2021 to FY2025
- Buys cocoa, sugar, dairy and nuts, and hedges their prices with futures.
- Makes candy and snacks in its own plants.
- Sells to distributors such as McLane and to stores.
- Shoppers pick familiar brands, so it can raise prices.
- Price rises arrive after cost rises, so margins swing with cocoa.
↺ Step 5 feeds back into step 1.
05Business segments · FY2025
Which businesses make up Hershey?
North America Confectionery
81.1%Chocolate, candy, mints and gum in the US and Canada. Segment income fell 15.3% in FY2025, which Hershey put down to higher commodity and tariff costs.
Revenue $9.5B ($9,480M) · Operating profit $2.5B ($2,494M)
North America Salty Snacks
10.9%Popcorn, puffs and pretzels. Sales rose 11.9% in FY2025, and segment income rose 21.3%.
Revenue $1.3B ($1,271M) · Operating profit $242M
International
8.1%Candy and snacks outside the US and Canada. Segment income fell 97.0% to $3.3M in FY2025 on commodity and manufacturing costs, Hershey said.
Revenue $942M · Operating profit $3.3M
How the mix changed
- North America Confectionery
- North America Salty Snacks
- International
Revenue by segment, FY2021 to FY2025.
US$
See the numbers
06The numbers · Consolidated · US$
How has Hershey done?
Revenue
$11.7BFY2025
Net sales rose from $9.0 billion in FY2021 to $11.7 billion in FY2025, and were $3,276M in Q3 FY2026, up 3.0% from a year earlier.
US$
See the numbers
Net income
$883MFY2025
Net income fell to $883M in FY2025 from $2,221M in FY2024 on higher cocoa costs and hedge losses, then reached $581M in Q3 FY2026.
US$
See the numbers
Net income for every $100 of revenue
$7.6FY2025
Hershey kept $16.5 of net income per $100 of sales in FY2021, $19.8 in FY2024 and $7.6 in FY2025.
Net margin: $ of net income per $100 of revenue
See the numbers
Free cash flow
$1.8BFY2025
Free cash flow stayed between $1.55 billion and $1.93 billion a year from FY2021 to FY2025, including FY2025, when net income fell.
US$ · cash from operations minus spending on plants and equipment
See the numbers
See all yearly numbers
EBITDA here = operating income plus depreciation and amortization (from the cash flow statement). Fiscal years are the company's own: Fiscal year ends Dec 31; each quarter ends on the Sunday nearest the calendar quarter end. Net income is the share belonging to the company's owners.
Learn: Fiscal years that don't end in December: Nvidia's FY2027 explained · Stock-based compensation and dilution: pay that becomes shares
Sources (22)
- Form 10-K for FY2021
- Form 10-K for FY2023
- Form 10-K for FY2022
- Form 10-K for FY2025
- Form 10-K for FY2024
- Earnings release for Q4 and FY2024 (8-K Ex. 99.1)
- Form 10-Q for Q1 FY2024
- Earnings release for Q1 FY2025 (8-K Ex. 99.1)
- Form 10-Q for Q2 FY2024
- Earnings release for Q2 FY2025 (8-K Ex. 99.1)
- Form 10-Q for Q3 FY2024
- Earnings release for Q3 FY2025 (8-K Ex. 99.1)
- Form 10-Q for Q1 FY2025
- Form 10-Q for Q2 FY2025
- Form 10-Q for Q3 FY2025
- Earnings release for Q4 and FY2025 (8-K Ex. 99.1)
- Form 10-Q for Q1 FY2026
- Earnings release for Q1 FY2026 (8-K Ex. 99.1)
- Form 10-Q for Q2 FY2026
- Earnings release for Q2 FY2026 (8-K Ex. 99.1)
- Form 10-Q for Q3 FY2026
- Earnings release for Q3 FY2026 (8-K Ex. 99.1)
07Who runs it
Who runs Hershey, and did they deliver?
Kirk Tanner
President and Chief Executive Officer · since 2025
Joined in Aug 2025. Was CEO of Wendy's from Feb 2024 to Jul 2025, after three decades at PepsiCo.
Steven E. Voskuil
Senior Vice President and Chief Financial Officer
Andrew Archambault
President, U.S. · since 2026
In this role from Mar 16, 2026.
Maria Kraus
Chairman of the Board
An independent director, also Chairman of Hershey Trust Company and Milton Hershey School since Dec 2023.
Michele Buck
Former Chairman, President and CEO
Retired as CEO and left the Board on Aug 18, 2025 (retirement announced Jan 10, 2025); the 2026 proxy said she would be Special Advisor until Jun 30, 2026.
What they said, and what happened
2 delivered · 2 too early to tell
Said on Oct 30, 2025
Hershey said it expected 2025 net sales to grow about 3%.
DeliveredWhat happened
Net sales rose 4.4% in FY2025.
Said on Oct 30, 2025
Hershey said it expected 2025 adjusted EPS of $5.90 to $6.00.
DeliveredWhat happened
Adjusted EPS was $6.31; GAAP diluted EPS was $4.34.
Said on Feb 5, 2026
Hershey said it expected 2026 net sales growth of 4% to 5%.
Too early to tellWhat happened
On Oct 29, 2026 it changed this to about 5%. Nine-month net sales were up 6.6%.
Said on Oct 29, 2026
Hershey said it expected about $100M of savings in 2026 from its Advancing Agility & Automation (AAA) program.
Too early to tellWhat happened
Not yet reported.
08What could go wrong
What could go wrong for Hershey?
- Raw-material prices
Cocoa and other commodity costs
Cocoa is the main raw material, and West Africa grows about 70% of it. In FY2025 cost of sales rose $1,868.5M and gross margin fell to 33.5% from 47.3%.
Watch Gross margin each quarter, and cocoa futures prices in the 10-Q.
- Pricing
Price rises that cut volume
The 10-K warns that price increases may not cover costs and may lower sales volume. In Q3 FY2026 North American candy prices rose about 13% and volume fell about 11%.
Watch Volume and price points in each earnings release.
- Concentration
One customer buys about a quarter of sales
McLane, the main distributor to Wal-Mart, bought about 27% of FY2025 net sales and owed about 16% of receivables at year end.
Watch McLane share of sales in the next 10-K.
- Governance
Voting control by one trust
Hershey Trust Company holds 79.0% of votes through Class B shares with 10 votes each. Common holders elect only one-sixth of the Board on their own.
Watch Any change in the Trust's holdings or Board seats in the proxy.
- Regulation
Tariffs and trade rules
Supply chain costs, including tariffs, added $287.2M to FY2025 cost of sales. Adjusted EPS in Q3 FY2026 included about $0.22 of tariff refunds.
Watch Tariff costs and refunds in the next releases.
- Execution
A weak International business
International segment income fell 97.0% to $3.3M in FY2025, and the segment had a $6.4M goodwill impairment. Organic sales fell 9.7% in Q3 FY2026.
Watch International segment income each quarter.
- Execution
Acquisitions that may not pay off
Hershey paid $756.1M in cash for LesserEvil in Nov 2025. The 10-K warns that failing to integrate acquisitions could hurt results.
Watch Salty Snacks segment income and any impairment.
09Supporters vs. critics
What do supporters and critics point to?
What supporters point to
- Net sales rose every year from FY2021 to FY2025, from $8,971.3M to $11,692.6M (FY2021 and FY2025 10-Ks).
- Gross margin was 46.1% in Q3 FY2026, against 32.6% in Q3 FY2025, and quarterly net income was $580.8M, against $276.3M.
- North America Salty Snacks sales rose 11.9% in FY2025 and its segment income rose 21.3%.
- Cash from operations was $2,277.4M in FY2025, while net income was $883.3M.
- The dividend per Common share rose from $3.41 in FY2021 to $5.48 in FY2024 and FY2025, and the quarterly dividend was raised to $1.452 on Feb 4, 2026.
What critics point to
- McLane, one distributor, bought about 27% of FY2025 net sales and owed about 16% of receivables at Dec 31, 2025.
- Hershey Trust Company holds 79.0% of votes, and Common holders elect only one-sixth of the Board on their own.
- In Q3 FY2026 North America Confectionery volume fell about 11%, and Hershey said its US candy, mint and gum market share declined.
- International segment income fell 97.0% to $3.3M in FY2025, and the segment lost $30.0M in Q3 FY2026.
- Dividends paid of $1,085.3M in FY2025 were more than net income of $883.3M, and net debt was $4,449.8M at Sep 27, 2026 (Cityfort calculation from the Q3 FY2026 10-Q).
10What to watch next
What should you watch next at Hershey?
Next event
Q4 FY2026 results
Date not announced yet.
Gross margin without hedge gains
Q3 FY2026 gross margin was 46.1%, and GAAP results included $113.4M of hedge gains that adjusted EPS leaves out. The FY2025 10-K shows how far margin can move: 33.5%, against 47.3% in FY2024.
Price against volume in candy
In Q3 FY2026 North American candy prices rose about 13% and volume fell about 11%. Each quarterly earnings release reports volume at the higher prices.
The 2026 outlook and tariff refunds
On Oct 29, 2026 Hershey said it expected 2026 net sales to grow about 5% and reported EPS of $8.00 to $8.26, excluding possible future tariff refunds. Q3 FY2026 adjusted EPS included about $0.22 of refunds.
International
International segment income was $3.3M in FY2025 and a $30.0M loss in Q3 FY2026. Its result each quarter is in the segment table of the earnings release.
11Key facts
Key facts about Hershey
- What does Hershey do?
- The Hershey Company makes chocolate, candy, mints, gum and salty snacks under more than 85 brands, including Hershey's, Reese's, Kisses, SkinnyPop and LesserEvil. North America Confectionery brought in 81.1% of Hershey's FY2025 net sales.
- How does Hershey make money?
- Hershey sells its products to distributors and stores, which resell them to shoppers. In FY2025 Hershey had $11,692.6M of net sales and $1,441.5M of operating profit, after cost of sales of $7,769.9M.
- Who are Hershey's customers?
- Hershey's biggest customer is McLane Company, a wholesale distributor that is the main supplier to Wal-Mart; it bought about 27% of Hershey's FY2025 net sales. Hershey's other customers include grocery, mass-market, drug, club, convenience and dollar stores.
- How big is Hershey?
- The Hershey Company had net sales of $11,692.6M in FY2025, up 4.4% from $11,202.3M in FY2024. Hershey's FY2025 net income was $883.3M, down from $2,221.2M in FY2024.
- Who owns Hershey?
- Hershey Trust Company, trustee for the Milton Hershey School Trust, held 28.0% of all Hershey shares and 79.0% of combined votes on Mar 6, 2026, mostly through Class B shares with 10 votes each. Hershey's directors and executive officers held under 1% of Common shares, according to the 2026 proxy statementThe yearly filing about shareholder votes, the board and executive pay. Learn more.
- Where does Hershey sell?
- The Hershey Company sells in about 65 countries, but customers in the United States paid 87.7% of Hershey's FY2025 net sales and customers outside the US 12.3%.
- Does Hershey pay a dividend?
- Hershey paid dividends of $5.48 per Common share in FY2025, the same as in FY2024, and $1,085.3M in total in FY2025. On Feb 4, 2026 Hershey raised the quarterly Common dividend to $1.452 from $1.370.
- How did Hershey do in Q3 FY2026?
- In Q3 FY2026 (to Sep 27, 2026) Hershey had net sales of $3,275.5M, up 3.0% from Q3 FY2025, and net income of $580.8M, against $276.3M a year earlier.
Terms on this page
- Capital expenditures (capex)
- Customer concentration
- Debt-to-equity
- Earnings per share (EPS)
- EBITDA
- Free cash flow
- Gross margin
- Net debt
- Net margin
- Revenue vs net income
Each explains the term in plain English, with the same number from other companies on Cityfort.
Go deeper
More detail from the same filings. Open any section.
12What it sells
12What it sells
What does Hershey sell?
Chocolate and candy in the US and Canada
Hershey's, Reese's, Kisses, Jolly Rancher, Twizzlers, ONE bars and Ice Breakers. It also sells Kit Kat, Rolo and Cadbury in the US under licenses. $9,479.7M of FY2025 net sales.
Salty snacks in North America
SkinnyPop and LesserEvil popcorn, Pirate's Booty and Dot's Homestyle Pretzels. $1,271.3M of FY2025 net sales, 10.9% of the total.
International
Candy and snacks made and sold mainly in Mexico, Brazil, India and Malaysia, with local brands such as Pelon Pelo Rico, IO-IO and Sofit. $941.6M of FY2025 net sales.
What it does
- Does: Makes most of its chocolate in plants it owns in Pennsylvania, Virginia, Illinois, Mexico and Malaysia.
- Does: Sells Kit Kat and Rolo in the US under a license from Nestlé.
- Does: Buys cocoa through futures and forward contracts to smooth out price swings.
What it does not do
- Does not: Does not grow cocoa: it buys cocoa products from outside suppliers.
- Does not: Does not own Kit Kat or Cadbury; it sells them in the US under licenses.
- Does not: Is not the same company as Hershey Entertainment & Resorts, a separate business linked to the Hershey Trust.
Sources (1)
13How the money flows
13How the money flows · FY2025
How does money flow through Hershey?
Money in
- Net sales$11.7B
The company
Hershey
$11.7B came in
Money out
- Cost of sales (cocoa, sugar, packaging, factories; includes hedge losses)$7.8B
- Selling, marketing and administrative costs (including advertising)$2.5B
- Business realignment costs$20.6M
- Interest, net$190M
- Other expense, net$37.1M
- Income tax$331M
- Net income$883M
- Stores and distributors paid Hershey $11.7 billion of net sales in FY2025, 4.4% more than in FY2024.
- Making the products took $7.8 billion; $491.0M of the $1,868.5M rise came from unfavorable mark-to-market on commodity hedges.
- Selling, advertising and running the company took $2.5 billion, leaving $1,441.5M of operating profit.
- Interest, other costs and $330.9M of income tax took $558.2M.
- That left $883.3M of net income, down from $2,221.2M in FY2024.
Sources (1)
14What it needs to run
14What it needs to run
What does Hershey need to run?
Cocoa
Cocoa products are its most important raw material; West Africa grows about 70% of the world's cocoa beans. Cocoa futures averaged $2.08 a pound in the first nine months of 2026, about 43% below the 2025 average of $3.65.
Other ingredients and energy
Sugar, corn products, dairy, wheat, peanuts, almonds, natural gas and diesel. Hershey says its price increases take effect only after a lag.
Plants and warehouses
Chocolate plants in Hershey, Lancaster and Hazleton (Pennsylvania), Stuarts Draft (Virginia), Robinson (Illinois), Mexico and Malaysia; snack plants in Kansas and Indiana.
People
About 17,550 full-time and 2,045 part-time employees at Dec 31, 2025. About 28% were covered by union contracts; those at six sites are up for renegotiation in 2026.
Brand licenses
Rights to sell Kit Kat and Rolo (from Nestlé) and Cadbury and Caramello (from Cadbury UK) in the US. Hershey met the minimum sales levels in 2025.
Sources (2)
15Where it sells
15Where it sells · FY2025
Where does Hershey sell?
- United States87.7%
- Outside the United States12.3%
Sources (1)
16Where growth could come from
16Where growth could come from
Where could Hershey's growth come from?
On Oct 29, 2026 Hershey said it expected 2026 net sales to grow about 5%, including about 2 points from LesserEvil, and reported EPS of $8.00 to $8.26. It said the outlook excludes possible future tariff refunds.
Higher prices on chocolate and candy
MixedQ3 FY2026: price about +13%, volume about −11%
In North America Confectionery, price rises lifted organic sales 1.6% in Q3 FY2026, but fewer units were sold. Hershey said US candy, mint and gum market share declined.
Status: Mixed, partly on track.
Salty snacks
WorkingFY2025 sales +11.9% to $1,271.3M
Volume rose about 8% in FY2025 on Dot's and SkinnyPop. In Q3 FY2026 segment sales rose 22.3%, mostly from LesserEvil; organic growth was 2.3%.
Status: Working, on track against what the company said.
Margin recovery as cocoa costs ease
WorkingQ3 FY2026 gross margin 46.1% vs 32.6%
Hershey said higher prices, hedge gains, tariff refunds and savings from its Advancing Agility & Automation (AAA) program lifted the margin, partly offset by lower volume and freight costs.
Status: Working, on track against what the company said.
International
BehindQ3 FY2026 organic sales −9.7%
Segment income fell to $3.3M in FY2025 and was a $30.0M loss in Q3 FY2026, when volume fell about 14%.
Status: Behind, behind the company's own plan.
Status compares progress with what the company itself said it would do: Working = on track against what the company said; Mixed = partly on track; Behind = behind the company's own plan; New = recently announced; Early = too early to judge.
17The company's own measures (non-GAAP)
17The company's own measures · FY2025 and Q3 FY2026
What do Hershey's own measures show?
Official (GAAP): Diluted EPS, FY2025
$4.34
Company's own measure: Adjusted EPS, FY2025
$6.31
Leaves out hedge (mark-to-market) losses of $2.08 per share, business realignment, acquisition and integration costs and asset impairments, after tax.
Official (GAAP): Diluted EPS, Q3 FY2026
$2.88
Company's own measure: Adjusted EPS, Q3 FY2026
$2.64
Lower than GAAP because it leaves out $113.4M of hedge gains. It includes about $0.22 per share of tariff refunds.
Official (GAAP): Reported net sales growth, Q3 FY2026
3.0%
Company's own measure: Organic net sales growth, Q3 FY2026
0.8%
Organic growth at constant currency leaves out acquisitions such as LesserEvil and currency moves.
Official (GAAP): Gross margin, Q3 FY2026
46.1%
Company's own measure: Adjusted gross margin, Q3 FY2026
42.7%
Leaves out hedge gains and one-off costs from cost of sales.
Official (GAAP): Operating profit, FY2025
$1.4B
Company's own measure: Total segment income, FY2025
$2.7B
Segment income leaves out unallocated corporate costs ($807.9M), hedge losses ($423.2M) and business realignment costs.
These are the company's own measures, defined by the company. They are not comparable across companies, and they are not added together. Each sits beside the nearest official (GAAP) figure.
Learn: Non-GAAP measures: what a company's "adjusted" numbers leave out
18Financial strength and debt
18Financial strength · Sep 27, 2026
How much debt does Hershey have?
- Total debt$5.1B
- Cash and investments$677M
- Net debt (debt minus cash)$4.4B
- Net worth (shareholders' money)$4.9B
- Debt to equity
- 1.05×
- $ of debt for every $1 of shareholders' money
- Debt is short-term debt ($436.0M, including $269.1M of commercial paper) plus long-term debt and its current portion ($4,690.5M). Net debt, debt to equity and the cash-flow multiple are a Cityfort calculation from the Q3 FY2026 10-Q and the FY2025 10-K.
- Net debt was $4,477.2M at Dec 31, 2025 and $4,327.5M at Dec 31, 2022 (Cityfort calculation from the FY2025 and FY2023 10-Ks).
- Hershey has a $1.875 billion revolving credit line to Oct 21, 2030, undrawn at Dec 31, 2025. About 70% of its cash was held by subsidiaries outside the US.
- Its long-term notes mature between 2026 and 2050; $2.45 billion is due after 2030. It issued four new notes worth $2.0 billion in Feb 2025.
- Lease liabilities other than finance leases are not counted as debt here.
19Who owns it
19Who owns it · ownership as of Mar 6, 2026
Who owns Hershey?
- Officers and directors (as a group), shares
- 0.1%
Shares vs votes by class
Hershey has more than one class of shares, and the classes carry different votes. The share of votes a class holds can differ a lot from its share of the shares.
- Common Stock: share of all votes21.1%
- Class B Common Stock: share of all votes78.9%
Each class's part of all votes = its shares outstanding × votes per share ÷ the total for all classes.
Share classes
Holders of 5% or more
From the company's proxy statement (DEF 14A), later Schedule 13G filings and the share counts on its latest annual or quarterly report. Each holder row shows the date of its own filing.
Learn: Dual-class shares: when votes and ownership don't match · How to read a proxy statement (DEF 14A): Nvidia's 2026 proxy · Form 4 insider filings: who files, the codes and the footnotes
20What it does with profit
20What it does with profit
What does Hershey do with its profit?
Dividend per share
$5.48FY2025
Dividend paid for each share, by financial year.
$ per share
See the numbers
Buyback · Dec 31, 2021
FY2021: share repurchases of $457.9M.
$458M
Buyback · Dec 31, 2022
FY2022: share repurchases of $389.0M.
$389M
Buyback · Dec 31, 2023
FY2023: share repurchases of $264.9M, including $239.9M paid to the Milton Hershey School Trust for 1,000,000 shares.
$265M
Buyback · Dec 31, 2024
FY2024: share repurchases of $494.2M.
$494M
Buyback · Dec 31, 2025
FY2025: no share repurchases.
$0M
Buyback · Sep 27, 2026
First nine months of FY2026: 2,246,310 shares repurchased for $439.4M.
$439M
21Governance signals
21Governance signals
What do Hershey's governance filings show?
- Auditor
- Ernst & Young LLP, since 2016
- Auditor changes
- None in the period covered
- Audit qualifications
- None reported
- Related-party dealings
- The FY2025 10-K reports no material related party transactions with Hershey Trust Company or its affiliates in 2025 or 2024. In Feb 2023 Hershey bought 1,000,000 of its shares from the Milton Hershey School Trust for $239.9M. In May 2025 it sold land in Derry Township, Pennsylvania to Hershey Entertainment & Resorts for $3,055,000.
- Credit rating
- Not checked for this page
Flags to know about
other
A controlling shareholder
Hershey Trust Company holds 79.0% of votes, and three of its directors sit on the Board. Since Feb 25, 2026, the Board elects its Chairman with the agreement of Hershey Trust Company.
other
Board leadership changes
The Chairman and CEO roles were split on Aug 18, 2025. On Dec 5, 2025 the Board removed the Lead Independent Director role and gave its duties to the Chairman, who must be independent.
other
Say-on-pay vote
In 2025, more than 72% of votes cast by Common holders, and more than 95% of combined votes, approved executive pay.
disclosure
What Hershey does not report
The filings give sales by segment and a US versus non-US split, but not by brand or product category. Plant capacity is not disclosed.
22How it got here
22How it got here
How did Hershey get here?
1894
Milestone
Founded
Milton S. Hershey started the business in 1894; it is based in Hershey, Pennsylvania.
1909
Milestone
School trust set up
Milton and Catherine Hershey set up a trust for Milton Hershey School. Its trustee still controls the votes.
1927
Milestone
Incorporated
The company was incorporated in Delaware on Oct 24, 1927.
2021
Business-model change
Bigger move into salty snacks
Bought Dot's Homestyle Pretzels and Pretzels Inc.; acquisitions cost $1,601.1M that year.
2024
Crisis
New ERP system
A new enterprise resource planning (ERP) system reduced shipments in Q2 2024.
2025
Crisis
Cocoa cost shock
Gross margin fell to 33.5% from 47.3%, and net income fell to $883.3M from $2,221.2M.
2025
Milestone
New CEO
Kirk Tanner became CEO, and the Chairman and CEO roles were split on Aug 18, 2025.
2025
Business-model change
LesserEvil bought
Bought LesserEvil, an organic popcorn and puffed snacks maker, for $756.1M in cash in Nov 2025.
2026
Milestone
Investor Day
On Mar 31, 2026 Hershey set out a strategy it calls "Lead Next Generation Snacking".
23Sources and changes
Where every number on this page comes from
Sources (24 documents)
- S1Form 10-Q for Q3 FY2026 · SEC EDGAR · Tier 1: company or exchange filing · Oct 29, 2026
- S2Form 10-Q for Q2 FY2026 · SEC EDGAR · Tier 1: company or exchange filing · Jul 30, 2026
- S3Form 10-Q for Q1 FY2026 · SEC EDGAR · Tier 1: company or exchange filing · Apr 30, 2026
- S4Form 10-K for FY2025 · SEC EDGAR · Tier 1: company or exchange filing · Feb 17, 2026
- S5Form 10-Q for Q3 FY2025 · SEC EDGAR · Tier 1: company or exchange filing · Oct 30, 2025
- S6Form 10-Q for Q2 FY2025 · SEC EDGAR · Tier 1: company or exchange filing · Jul 30, 2025
- S7Form 10-Q for Q1 FY2025 · SEC EDGAR · Tier 1: company or exchange filing · May 1, 2025
- S8Form 10-K for FY2024 · SEC EDGAR · Tier 1: company or exchange filing · Feb 18, 2025
- S9Form 10-Q for Q3 FY2024 · SEC EDGAR · Tier 1: company or exchange filing · Nov 7, 2024
- S10Form 10-Q for Q2 FY2024 · SEC EDGAR · Tier 1: company or exchange filing · Aug 1, 2024
- S11Form 10-Q for Q1 FY2024 · SEC EDGAR · Tier 1: company or exchange filing · May 3, 2024
- S12Form 10-K for FY2023 · SEC EDGAR · Tier 1: company or exchange filing · Feb 20, 2024
- S13Form 10-K for FY2022 · SEC EDGAR · Tier 1: company or exchange filing · Feb 17, 2023
- S14Form 10-K for FY2021 · SEC EDGAR · Tier 1: company or exchange filing · Feb 18, 2022
- S15Earnings release for Q3 FY2026 (8-K Ex. 99.1) · SEC EDGAR · Tier 1: company or exchange filing · Oct 29, 2026
- S16Earnings release for Q2 FY2026 (8-K Ex. 99.1) · SEC EDGAR · Tier 1: company or exchange filing · Jul 30, 2026
- S17Earnings release for Q1 FY2026 (8-K Ex. 99.1) · SEC EDGAR · Tier 1: company or exchange filing · Apr 30, 2026
- S18Investor Day press release (8-K Ex. 99.1, Mar 31, 2026) · SEC EDGAR · Tier 1: company or exchange filing · Mar 31, 2026
- S192026 proxy statement (DEF 14A) · SEC EDGAR · Tier 1: company or exchange filing · Mar 25, 2026
- S20Earnings release for Q4 and FY2025 (8-K Ex. 99.1) · SEC EDGAR · Tier 1: company or exchange filing · Feb 5, 2026
- S21Earnings release for Q3 FY2025 (8-K Ex. 99.1) · SEC EDGAR · Tier 1: company or exchange filing · Oct 30, 2025
- S22Earnings release for Q2 FY2025 (8-K Ex. 99.1) · SEC EDGAR · Tier 1: company or exchange filing · Jul 30, 2025
- S23Earnings release for Q1 FY2025 (8-K Ex. 99.1) · SEC EDGAR · Tier 1: company or exchange filing · May 1, 2025
- S24Earnings release for Q4 and FY2024 (8-K Ex. 99.1) · SEC EDGAR · Tier 1: company or exchange filing · Feb 6, 2025
Changes to this page (v1 · Nov 20, 2026)
- v1 · Nov 20, 2026First version. (first version)
Numbers come only from tier 1 and tier 2 sources. Read how we research.
Disclaimer
For learning only. Cityfort is not a registered investment adviser or broker-dealer and does not recommend buying or selling any security. Prices shown are dated and may be out of date.
Investing in securities involves risk, including loss of capital. Before making any investment decision, do your own research and consider consulting a registered investment adviser or other qualified professional.
Cityfort, its owners and contributors may or may not hold securities of companies covered. Cityfort is not paid by any company it covers. Content is not an offer or solicitation to buy or sell any security, including in any initial public offering.
Read the positions policyRead the full disclaimerHide the full disclaimer
Cityfort publishes general educational content that explains how listed companies work. Cityfort is not registered with the US Securities and Exchange Commission or any state securities regulator as an investment adviser, and is not a broker-dealer or a member of FINRA. Cityfort does not provide investment, tax or legal advice, recommendations, ratings, price targets or any opinion on whether to buy, sell or hold any security. Nothing on the site is tailored to any person's circumstances.
All information is taken from publicly available sources, mainly company filings with the SEC, which are listed on each page with dates. We work to keep it accurate and correct errors publicly, but we do not guarantee that it is complete, accurate or up to date. Any market price or price-based ratio shown is dated, may be out of date by the time you read it, and is included only to explain concepts.
Statements by company management, including forward-looking statements and guidance, are reported as the company's statements, with their date and source; they are not our forecasts. Adjusted (non-GAAP) figures are the company's own measures and are shown next to the official (GAAP) figures.