Technology · NYSE: FICO
FICO: how the business works
FICO writes the formula behind the FICO Score that US lenders use to judge borrowers, and sells decision software to banks, with revenue of $2,534.9 million in FY2026.
By Hardik Bhandare · Checked against filings: . Editorial policy. Corrections
Follow FICO
Email me when FICO's page is updated after earnings.
We'll send a confirmation email first. See our privacy policy.
Fair Isaac Corporation · Bozeman, Montana · Founded 1956
Updated for Q4 FY2026 · checked
- Revenue, FY2026
- $2.5B
- Net income, FY2026
- $835M
- Revenue from 3 credit bureaus, FY2026
- 60%
- Employees, Sep 30, 2026
- 3,747
- Founded
- 1956
The short version
FICO in 5 points
1 · What it sells
FICO writes the formula behind the FICO Score that US lenders use to judge borrowers, and sells decision and fraud software, with revenue of $2,534.9 million in FY2026.
2 · Who pays it
In FY2026 the credit bureaus Experian, TransUnion and Equifax paid 60% of revenue; consumers paid $230.0 million for scores on myFICO.com and other direct channels, and the Software segment brought in $882.7 million.
3 · What it keeps from $100
Of every $100 that came in during FY2026, FICO kept $32.2 as net income, which includes $57.7 million of other income outside operations; operating income was $1,265.7 million.
4 · Where the operating profit comes from
Scores bring in most of the profit: in FY2026 that segment kept $90 of operating profit per $100 of revenue, against $28 in Software.
5 · The one thing to watch
Scores revenue rose 41% in FY2026, and on Nov 4, 2026 FICO said it gave no FY2027 guidance while moving to custom pricing for mortgage scores.
Sources: From FICO's FY2026 10-K, Q4 FY2026 earnings release and 2026 proxy statement · checked
01Where the money goes · FY2026
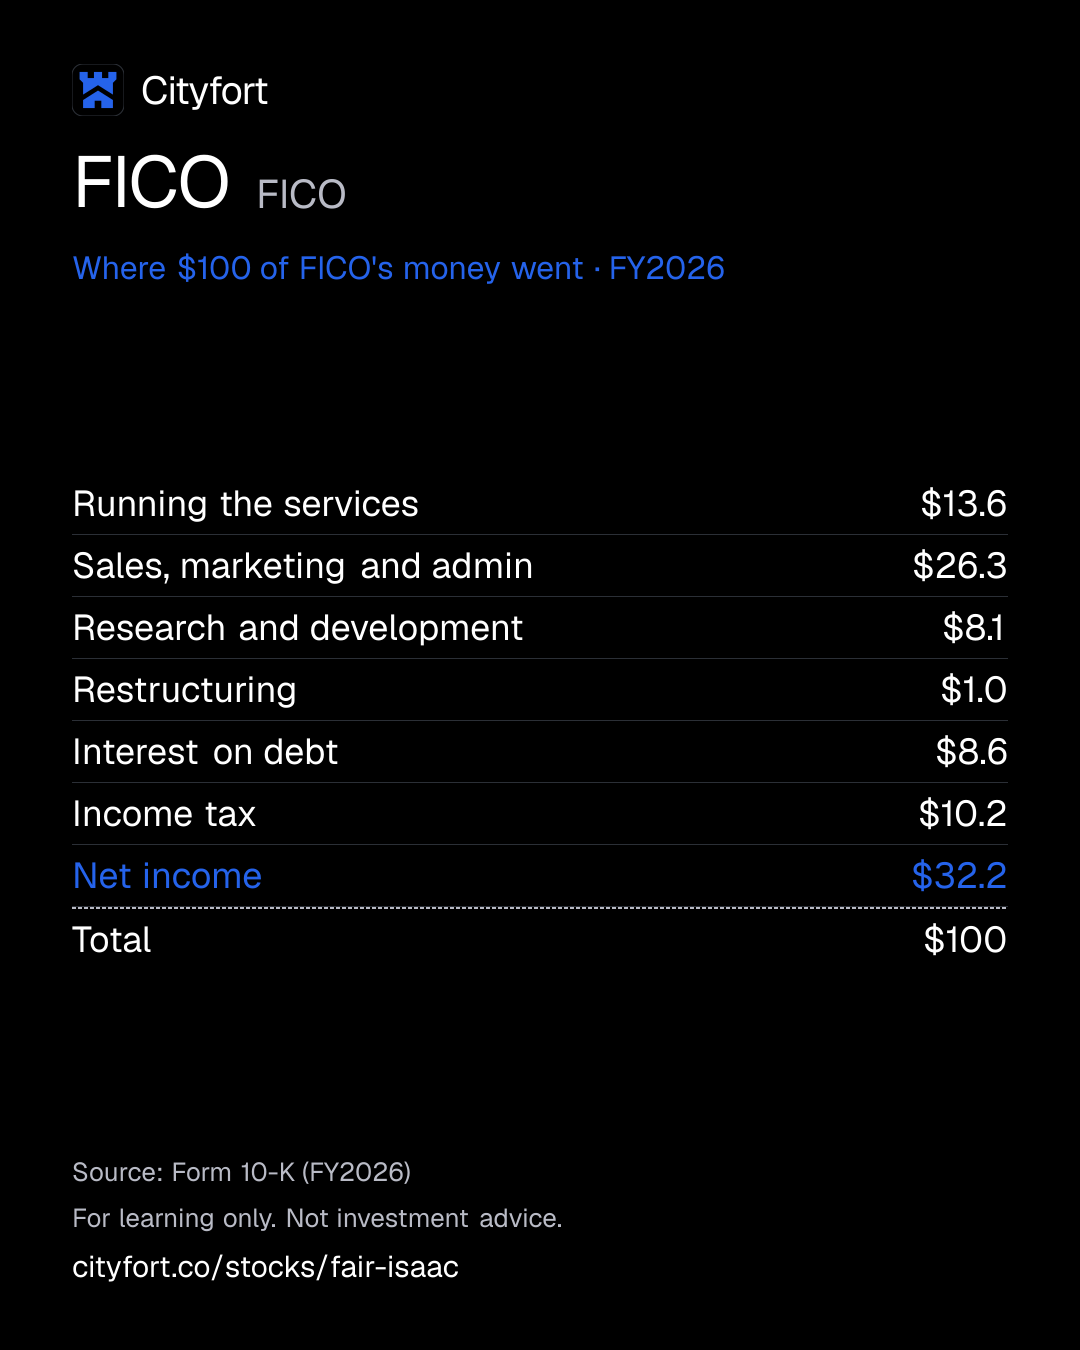
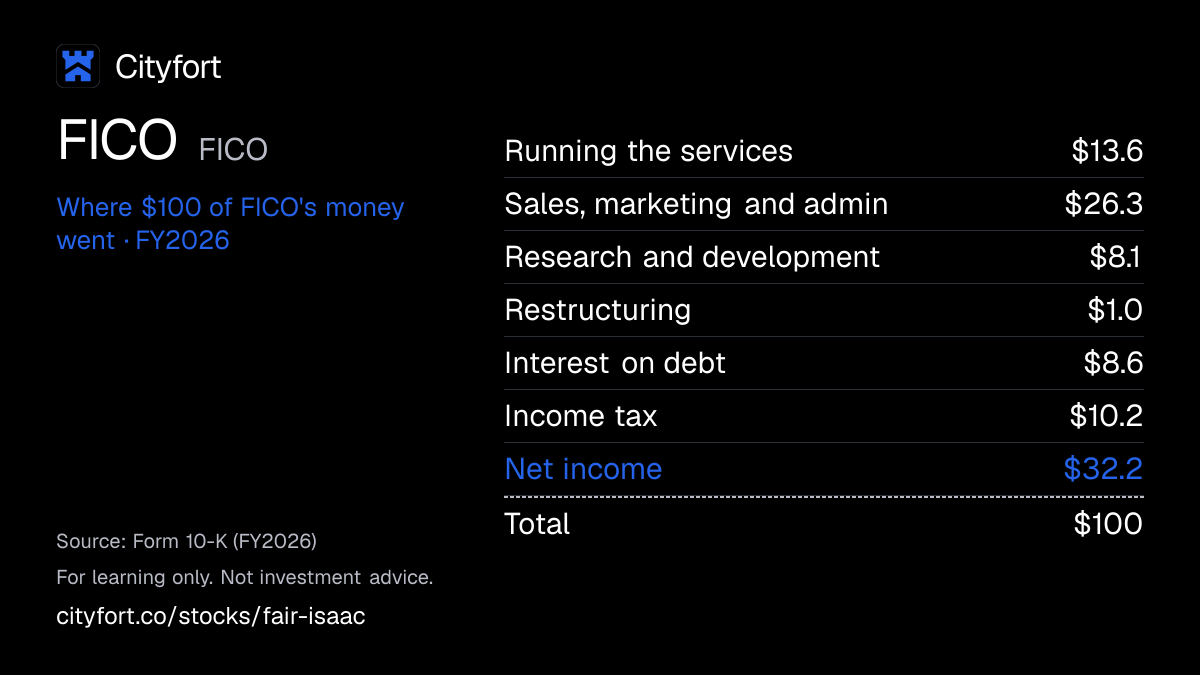
Where does $100 of FICO's money go?
FICO · FY2026
Receipt for every $100
| Running the services | $13.6 |
|---|---|
| Sales, marketing and admin | $26.3 |
| Research and development | $8.1 |
| Restructuring | $1.0 |
| Interest on debt | $8.6 |
| Income tax | $10.2 |
| Net income | $32.2 |
| Total | $100 |
Each line = amount ÷ total money in × 100. Lines may not add to exactly $100 because of rounding.
How this is worked out
Cityfort calculation from the FY2026 10-K. Of every $100 that came in during FY2026 (revenue plus other income): each line = line ÷ $2,592.5 million × 100.
Save this receipt as an image
Embed this receipt or the key numbers
Paste this code into a blog or website to show the card you choose, with a link back to this page.
Each week: the next company due to report earnings, explained in 5 points.
No tips. Unsubscribe anytime.
We'll send a confirmation email. See our privacy policy.
02The business in one line
What does FICO do?
Lenders pay credit bureaus for each FICO Score and the bureaus pass FICO a fee, while banks pay for its software; after costs, interest and tax, $32.2 of every $100 that came in (revenue plus other income) is left as net income.
- In FY2026 the Scores segment brought in $1,652.2 million, or 65.2% of revenue, and the Software segment $882.7 million, or 34.8%.
- Experian, TransUnion and Equifax sell the scores to lenders but also own VantageScore, a rival score; together they made up 60% of FICO's FY2026 revenue.
03Who pays it
Who pays FICO?
Credit bureaus (Experian, TransUnion, Equifax)
60%
of revenue
Lenders pay a bureau a fee for each FICO Score it produces, and the bureau pays FICO a fee in turn. These three companies made up 60% of FICO's revenue in FY2026.
Consumers
Share of revenue not disclosed
Individuals pay for myFICO.com subscriptions or buy scores and reports through licensed partners; this is part of the Scores segment.
Banks and other businesses using the software
34.8%
of revenue
They pay multi-year subscriptions, often with a minimum payment, for decision and fraud software. The Software segment brought in $882.7 million, about 35% of FY2026 revenue.
- Credit bureaus (Experian, TransUnion, Equifax)60%
- Banks and other businesses using the software34.8%
How spread out the customers are
Experian, TransUnion and Equifax together made up 60% of revenue in FY2026, up from 51% in FY2025 and 45% in FY2024; each one was above 10%. The 10-K does not give each one's share.
Sources (1)
04How it makes money
How does FICO make money?
Scores cost little to produce, so higher score prices go mostly to profit.
The bureaus do the data work and pass FICO a fee per score. In FY2026 the Scores segment kept $90 of operating profit per $100 of revenue, against $28 in Software (Cityfort calculation from the FY2026 10-K). FICO said Scores growth came mainly from a higher price per mortgage score and more mortgage origination scores.
Net income per $100 of revenue
$27.1$32.9
FY2022 to FY2026
- A lender asks a bureau for a borrower's FICO Score
- The bureau runs FICO's formula on its own credit file
- The lender pays the bureau, and the bureau pays FICO a fee
- FICO's cost for each extra score is small
- Price rises on scores flow mostly into operating profit
↺ Step 5 feeds back into step 1.
05Business segments · FY2026
Which businesses make up FICO?
Scores
65.2%FICO Scores sold to lenders through the bureaus, plus myFICO.com and other consumer products.
Revenue $1.7B ($1,652M) · Operating profit $1.5B ($1,490M)
Software
34.8%Decision and fraud software (cloud and on-premises) and related professional services.
Revenue $883M · Operating profit $250M
How the mix changed
- Scores
- Software
Revenue by segment, FY2024 to FY2026.
US$
See the numbers
Sources (1)
06The numbers · Consolidated · US$
How has FICO done?
Revenue
$2.5BFY2026
Revenue grew every year, from $1,377.3 million in FY2022 to $2,534.9 million in FY2026, and rose 27% in FY2026 alone.
US$
See the numbers
Net income
$835MFY2026
Net income rose every year, from $373.5 million in FY2022 to $835.0 million in FY2026.
US$
See the numbers
Net income for every $100 of revenue
$32.9FY2026
Net income per $100 of revenue rose from $27.1 in FY2022 to $32.9 in FY2026.
Net margin: $ of net income per $100 of revenue
See the numbers
Free cash flow
$1.1BFY2026
Operating cash flow reached $1,072.1 million in FY2026, up from $509.5 million in FY2022.
US$ · cash from operations minus spending on plants and equipment
See the numbers
See all yearly numbers
EBITDA here = operating income plus depreciation and amortization (from the cash flow statement). Fiscal years are the company's own: Fiscal year ends on Sep 30 (FY2026 ran from Oct 1, 2025 to Sep 30, 2026). Net income is the share belonging to the company's owners.
Learn: Fiscal years that don't end in December: Nvidia's FY2027 explained · Stock-based compensation and dilution: pay that becomes shares
Sources (22)
- Form 10-K for FY2022
- Form 10-K for FY2023
- Form 10-K for FY2024
- Form 10-K for FY2025
- Form 10-K for FY2026
- Form 10-Q for Q1 FY2024
- Q1 FY2025 earnings release (8-K Exhibit 99.1)
- Form 10-Q for Q2 FY2024
- Q2 FY2025 earnings release (8-K Exhibit 99.1)
- Form 10-Q for Q3 FY2024
- Q3 FY2025 earnings release (8-K Exhibit 99.1)
- Q4 FY2025 earnings release (8-K Exhibit 99.1)
- Form 10-Q for Q1 FY2025
- Form 10-Q for Q2 FY2025
- Form 10-Q for Q3 FY2025
- Form 10-Q for Q1 FY2026
- Q1 FY2026 earnings release (8-K Exhibit 99.1)
- Form 10-Q for Q2 FY2026
- Q2 FY2026 earnings release (8-K Exhibit 99.1)
- Form 10-Q for Q3 FY2026
- Q3 FY2026 earnings release (8-K Exhibit 99.1)
- Q4 FY2026 earnings release (8-K Exhibit 99.1)
07Who runs it
Who runs FICO, and did they deliver?
William J. Lansing
Chief Executive Officer and President · since 2012
Also a director.
Steven P. Weber
Executive Vice President and Chief Financial Officer · since 2023
Nikhil Behl
President, Software · since 2025
Mark R. Scadina
Executive Vice President, General Counsel and Corporate Secretary
Braden R. Kelly
Independent Chairman of the Board · since 2016
What they said, and what happened
1 partly delivered · 2 too early to tell
Said on Nov 5, 2025
FICO forecast FY2026 revenue of $2.35 billion and GAAP diluted EPS of $33.47, and raised this twice during the year.
Partly deliveredWhat happened
Revenue of $2,534.9 million matched the last forecast ($2.53 billion, Jul 29, 2026); GAAP diluted EPS of $36.32 was above the first forecast ($33.47) but below the last ($36.86).
Said on Oct 6, 2026
FICO said its plan to cut about 15% of positions would be substantially complete by the end of Q3 FY2027.
Too early to tellWhat happened
FY2026 included a $27.3 million restructuring charge.
Said on Nov 6, 2026
FICO said it expects to sign final settlement agreements in the proposed (putative) antitrust class actions in Q1 FY2027.
Too early to tellWhat happened
According to the FY2026 10-K, the settlement also needs final court approval.
Sources (7)
08What could go wrong
What could go wrong for FICO?
- Concentration
Three bureaus bring in most of the revenue
Experian, TransUnion and Equifax made up 60% of FY2026 revenue, up from 45% in FY2024. They sell FICO Scores but also own VantageScore, a rival score.
Watch The bureaus' combined share of revenue in the FY2027 10-K.
- Regulation
Competing scores in mortgages
The 10-K says Fannie Mae and Freddie Mac being able to use a competing credit score in US mortgages has had, and could keep having, a material adverse effect on its stock price.
Watch Mortgage score rules from the Federal Housing Finance Agency, Fannie Mae and Freddie Mac.
- Demand
Mortgage lending volumes
FICO said on Nov 4, 2026 that high interest rates and affordability problems keep mortgage originations below historical norms. Q4 FY2026 Scores growth was partly offset by fewer mortgage originations.
Watch Scores revenue growth in the Q1 FY2027 earnings release.
- Debt
Debt has grown fast
Debt rose to $5,259.1 million at Sep 30, 2026 from $3,055.7 million a year earlier, mostly to fund buybacks. Net interest expense rose 67% to $223.3 million in FY2026.
Watch Interest expense and the $337.5 million of term loan due in FY2027.
- Legal
Antitrust class actions
Proposed (putative) class actions in Illinois allege antitrust violations in how FICO Scores are distributed. According to the FY2026 10-K, FICO signed a term sheet on Sep 29, 2026 to pay $65.0 million; it denies wrongdoing, and the deal needs court approval.
Watch According to the FY2026 10-K (Nov 6, 2026), FICO expects final settlement agreements in Q1 FY2027; a court must then approve them.
- Execution
Job cuts while software shifts
In an 8-K filed Oct 6, 2026, FICO said it plans to cut about 15% of positions; it booked a $27.3 million restructuring charge in FY2026. Recurring revenue from software outside FICO Platform fell 18% in the year to Sep 30, 2026.
Watch Restructuring costs and non-platform software recurring revenue each quarter.
09Supporters vs. critics
What do supporters and critics point to?
What supporters point to
- The FY2026 10-K says the FICO Score is used in most US credit decisions, by nearly all major banks, card issuers, mortgage lenders and auto lenders.
- Scores revenue rose 41% in FY2026 to $1,652.2 million, and the segment kept $90 of operating profit per $100 of revenue (Cityfort calculation from the FY2026 10-K).
- Net income per $100 of revenue rose from $27.1 in FY2022 to $32.9 in FY2026.
- Yearly recurring revenue from FICO Platform software was 72% higher at Sep 30, 2026 than a year earlier, by the company's measure.
- FY2026 revenue of $2,534.9 million and GAAP diluted EPS of $36.32 were above the $2.35 billion and $33.47 FICO forecast in its Q4 FY2025 earnings release (Nov 5, 2025).
What critics point to
- Experian, TransUnion and Equifax made up 60% of FY2026 revenue, up from 45% in FY2024, and they also own the rival VantageScore.
- The 10-K says Fannie Mae and Freddie Mac being able to use a competing score has had, and could keep having, a material adverse effect on FICO's stock price.
- Debt rose to $5,259.1 million at Sep 30, 2026 from $3,055.7 million a year earlier, and liabilities exceeded assets by $3,873.2 million.
- Recurring revenue from software outside FICO Platform fell 18% in the year to Sep 30, 2026, and in October 2026 FICO said it plans to cut about 15% of positions.
- Proposed (putative) class actions allege antitrust violations in how FICO Scores are distributed; according to the 10-K, FICO denies wrongdoing and signed a term sheet to pay $65.0 million, which needs court approval.
10What to watch next
What should you watch next at FICO?
Next event
Q1 FY2027 results
Date not announced yet.
Mortgage score pricing
On Nov 4, 2026 FICO said it was moving to custom ("bespoke") pricing for mortgage scores and gave no FY2027 guidance. Scores revenue rose 41% in FY2026.
How much still runs through the bureaus
The three bureaus made up 60% of FY2026 revenue, up from 51% in FY2025. In Oct 2025 FICO announced a direct licensing program under which mortgage resellers can calculate and sell FICO Scores without the bureaus.
Debt and job cuts
$337.5 million of the term loan is due in FY2027. FICO said on Oct 6, 2026 that cutting about 15% of positions would be substantially complete by the end of Q3 FY2027.
11Key facts
Key facts about FICO
- What does FICO do?
- Fair Isaac Corporation (FICO) writes the formula behind the FICO Score, the 300-to-850 credit score US lenders use to judge borrowers, and sells decision and fraud software. FICO's revenue was $2,534.9 million in FY2026, the year to Sep 30, 2026.
- How does FICO make money?
- FICO earns a fee each time a credit bureau sells a FICO Score to a lender, and subscription fees for its software. In FY2026 FICO's Scores segment brought in $1,652.2 million and its Software segment $882.7 million.
- Who are FICO's customers?
- Experian, TransUnion and Equifax, which resell FICO Scores to lenders, made up 60% of FICO's FY2026 revenue. Consumers buying scores on myFICO.com and other direct channels paid $230.0 million (9%), and the Software segment, sold to banks and other businesses, brought in $882.7 million (35%, as stated in the 10-K); the 9% is a Cityfort calculation from the FY2026 10-K. The 10-K does not split the bureaus' revenue by segment.
- Is FICO profitable?
- Yes. FICO reported operating income of $1,265.7 million and net income of $835.0 million in FY2026; net income was $651.9 million in FY2025. FICO's FY2026 net income includes $57.7 million of other income, net, outside its operations.
- How much debt does FICO have?
- FICO had $5,259.1 million of debt and $217.6 million of cash at Sep 30, 2026, up from $3,055.7 million of debt a year earlier. FICO spent $3,046.0 million buying back its own shares in FY2026.
- Who owns FICO?
- FICO has one class of shares, with 21.38 million shares outstanding on Oct 23, 2026. In filings quoted in FICO's 2026 proxy statementThe yearly filing about shareholder votes, the board and executive pay. Learn more, Vanguard reported 12.78% (Oct 30, 2025) and BlackRock 8.60% (Apr 17, 2025); FICO's directors and executive officers held 3.02% on Nov 28, 2025.
- Does FICO pay a dividend?
- No. FICO has not paid a cash dividend since May 2017. FICO returns cash by buying back shares, and its shares outstanding fell 10% in FY2026, to 21.38 million.
Terms on this page
- Capital expenditures (capex)
- Earnings per share (EPS)
- EBITDA
- Free cash flow
- Interest coverage
- Net debt
- Net margin
- Revenue vs net income
- Stock buyback
Each explains the term in plain English, with the same number from other companies on Cityfort.
Go deeper
More detail from the same filings. Open any section.
12What it sells
12What it sells
What does FICO sell?
FICO Score for lenders
FICO applies its formulas to credit files kept by Experian, TransUnion and Equifax. The 10-K says the score is used in most US credit decisions, by nearly all major banks, card issuers, mortgage lenders and auto lenders.
myFICO and other consumer products
People can buy their own FICO Scores, credit reports and credit-monitoring alerts on myFICO.com, or get them through partners such as Experian.
FICO Platform and decision software
Software for decisions such as account opening, customer management, marketing and fraud detection, sold mostly as multi-year subscriptions priced on usage, in the cloud or on the customer's own computers.
Professional services
Help with setting up and running the software; this brought in $74.5 million in FY2026.
What it does
- Does: Writes and updates the scoring formulas (the latest, FICO Score 10T, came out in 2020)
- Does: Sells consumers their own scores through myFICO.com
- Does: Sells decision and fraud software to businesses in more than 70 countries
What it does not do
- Does not: Does not collect or store the consumer credit data its scores are calculated from
- Does not: In most cases does not sell scores directly to lenders; the credit bureaus do
- Does not: Does not lend money or take deposits
- Does not: Has not paid a cash dividend since May 2017
Sources (1)
13How the money flows
13How the money flows · FY2026
How does money flow through FICO?
Money in
- Revenue$2.5B
- Other income (mostly a gain on selling an investment)$57.7M
The company
FICO
$2.6B came in
Money out
- Running the services (cost of revenues)$352M
- Sales, marketing and administration$681M
- Research and development$209M
- Restructuring charges$27.3M
- Interest on debt$223M
- Income tax$265M
- Net income$835M
- FY2026 revenue was $2,534.9 million: $1,652.2 million from scores and $882.7 million from software.
- Sales, marketing and administration was the largest cost, at $681.1 million. According to the FY2026 10-K, it includes a $65.0 million accrual for a proposed settlement of alleged antitrust claims.
- Running the services cost $351.5 million and research and development $209.3 million.
- Interest on FICO's debt took $223.3 million, up from $133.6 million in FY2025.
- After $265.1 million of income tax, $835.0 million was left as net income.
14What it needs to run
14What it needs to run
What does FICO need to run?
Credit files held by the bureaus
FICO's formulas run on credit data that Experian, TransUnion and Equifax collect and keep; FICO does not hold that data itself.
Staff
3,747 employees in 31 countries at Sep 30, 2026: 1,400 in India, 1,386 in the US and 247 in the UK.
Patents and scoring know-how
The 10-K says FICO holds over 130 US and international patents covering AI and related analytics.
Borrowed money
FICO had $5,259.1 million of debt at Sep 30, 2026. In FY2026 it borrowed $3,095.0 million under its bank loans and spent $3,046.0 million buying back its own shares.
Sources (1)
15Where it sells
15Where it sells · FY2026
Where does FICO sell?
- Americas89%
- Europe, Middle East and Africa7%
- Asia Pacific4%
Sources (1)
16Competitors and what protects it
16Competitors and what protects it
Who does FICO compete with?
VantageScore
A joint venture set up by Experian, TransUnion and Equifax that sells a rival credit score, according to the FICO 10-K.
Experian, TransUnion and Equifax
The 10-K names the bureaus as competitors in scores as well as partners that sell FICO Scores; Experian and TransUnion also sell scores to consumers.
IBM
NYSE: IBM
Named in the FICO 10-K as a competitor for decision-platform software.
SAS and Pegasystems
Also named in the 10-K as decision-software competitors, alongside smaller specialist vendors and customers building their own tools.
Credit Karma and Credit Sesame
Named in the 10-K as competitors to myFICO in selling credit scores and monitoring to consumers.
What protects the business
Each strength is scored 1 (weak) to 5 (strong) for the business, with the reason. It is not a rating of the share.
- Industry standard5 of 5
The 10-K says the FICO Score is used in most US credit decisions, by nearly all major banks, card issuers, mortgage lenders and auto lenders.
- Pricing power in scores4 of 5
Scores revenue rose 41% in FY2026 to $1,652.2 million; FICO's FY2026 10-K said B2B scores growth came mainly from both a higher price and more mortgage origination scores.
- Software customers staying3 of 5
Software customers spent 112% of what they spent a year earlier, by the company's net retention measure at Sep 30, 2026; Software kept $28 of operating profit per $100.
Weak spot
Sales run through rivals
Three bureaus brought in 60% of FY2026 revenue and also own VantageScore. The 10-K says Fannie Mae and Freddie Mac being able to use a competing score has had, and could keep having, a material adverse effect on its stock price.
17Where growth could come from
17Where growth could come from
Where could FICO's growth come from?
On Nov 4, 2026 FICO said it was not giving FY2027 guidance because it is in the middle of moving to custom ("bespoke") pricing for mortgage scores. It also said high interest rates were keeping mortgage lending below historical norms.
Mortgage score pricing
WorkingScores revenue +41% in FY2026
Scores revenue reached $1,652.2 million in FY2026, from $1,168.6 million. FICO's FY2026 10-K said B2B scores growth came mainly from both a higher price and more mortgage origination scores.
Status: Working, on track against what the company said.
FICO Platform
WorkingPlatform yearly recurring revenue +72%
Yearly recurring revenue from FICO Platform software was 72% higher at Sep 30, 2026 than a year earlier, by the company's measure.
Status: Working, on track against what the company said.
Older software products
MixedNon-platform recurring revenue −18%
Recurring revenue from software outside FICO Platform was 18% lower at Sep 30, 2026; total software recurring revenue still grew 14%.
Status: Mixed, partly on track.
Direct mortgage licensing
NewAnnounced Oct 2025
Under the program FICO announced in Oct 2025, resellers and mortgage platforms will have the option to calculate and sell FICO Scores without the bureaus; in Apr 2026 FICO said FICO Score 10T would also be offered through it.
Status: New, recently announced.
Bespoke mortgage pricing
EarlyFICO Preferred Program
FICO said on Nov 4, 2026 that its FICO Preferred Program had several deals already announced, with more being worked on for calendar 2027.
Status: Early, too early to judge.
Status compares progress with what the company itself said it would do: Working = on track against what the company said; Mixed = partly on track; Behind = behind the company's own plan; New = recently announced; Early = too early to judge.
18The company's own measures (non-GAAP)
18The company's own measures · FY2026
What do FICO's own measures show?
Official (GAAP): Net income, FY2026
$835M
Company's own measure: Non-GAAP net income, FY2026
$988M
FICO leaves out stock-based payPay given as shares instead of cash, which spreads ownership more thinly. Learn more ($185.5 million), restructuring ($27.3 million), the $65.0 million proposed settlement, a $47.9 million investment gain and some tax items.
Official (GAAP): Diluted EPS, FY2026
$36.32
Company's own measure: Non-GAAP diluted EPS, FY2026
$42.99
Same exclusions, per share. It was $29.88 in FY2025, against GAAP EPS of $26.54.
Official (GAAP): Net cash from operating activities, FY2026
$1.1B
Company's own measure: Company free cash flow, FY2026
$1.0B
FICO deducts $37.7 million of capital spending, including capitalized software. The free cash flowCash from operations minus spending on buildings and equipment. Learn more column in the numbers above deducts only property and equipment.
Official (GAAP)
No official figure measures this; it is the company's own operating measure.
Company's own measure: Software net retention rate, Sep 30, 2026
112%
Company measure of what software customers spend now compared with a year earlier. It was 102% at Sep 30, 2025; 156% for FICO Platform and 82% for other software.
Official (GAAP)
No official figure measures this; it is the company's own operating measure.
Company's own measure: Software yearly recurring revenue growth, Sep 30, 2026
14%
Company measure of growth in the yearly value of recurring software contracts; it was 4% a year earlier.
These are the company's own measures, defined by the company. They are not comparable across companies, and they are not added together. Each sits beside the nearest official (GAAP) figure.
Learn: Non-GAAP measures: what a company's "adjusted" numbers leave out · Stock-based compensation and dilution: pay that becomes shares
19Financial strength and debt
19Financial strength · Sep 30, 2026
How much debt does FICO have?
- Total debt$5.3B
- Cash and investments$218M
- Net debt (debt minus cash)$5.0B
- Net worth (shareholders' money)−$3.9B
- Interest cover
- 5.7×
- how many times operating profit covers interest
- Net debt = debt of $5,259.1 million − cash of $217.6 million = $5,041.5 million, about 3.9 times FY2026 operating income plus depreciation and amortization (Cityfort calculation from the FY2026 10-K).
- Operating income was 5.7 times net interest expense of $223.3 million in FY2026 (Cityfort calculation from the FY2026 10-K).
- Debt rose from $3,055.7 million a year earlier. It includes $3,400.0 million of senior notes (face value), $1,185.0 million of term loan due May 15, 2028 and $700.0 million drawn on a $1.0 billion credit line due May 13, 2030.
- Of the term loan, $337.5 million is due in FY2027 and $847.5 million in FY2028; FICO said it met its loan covenants at Sep 30, 2026.
- Equity is negative because FICO has spent $10,539.2 million in total buying back shares, held as treasury stock; a debt-to-equity ratio is not shown.
20Who owns it
20Who owns it · ownership as of Nov 28, 2025
Who owns FICO?
- Officers and directors (as a group), shares
- 3.0%
Share classes
Holders of 5% or more
From the company's proxy statement (DEF 14A), later Schedule 13G filings and the share counts on its latest annual or quarterly report. Each holder row shows the date of its own filing.
Learn: How to read a proxy statement (DEF 14A): Nvidia's 2026 proxy · Form 4 insider filings: who files, the codes and the footnotes
21What it does with profit
21What it does with profit
What does FICO do with its profit?
Buyback · Sep 30, 2024
Spent $821.7 million on buying back shares in FY2024.
$822M
Buyback · Sep 30, 2025
Spent $1,414.5 million on buying back shares in FY2025.
$1.4B
Buyback · Jun 5, 2026
Board approved a $2.0 billion buyback program and FICO prepaid $1.5 billion to Wells Fargo Securities for an accelerated buyback, funded by a new term loan; 1,284,743 shares were delivered by Jul 2026.
$1.5B
Buyback · Sep 30, 2026
Spent $3,046.0 million on buying back shares in FY2026; $500.0 million of the June 2026 program was left at Sep 30, 2026.
$3.0B
22Governance signals
22Governance signals
What do FICO's governance filings show?
- Auditor
- Deloitte & Touche LLP
- Auditor changes
- None in the period covered
- Audit qualifications
- None reported
- Related-party dealings
- The Audit Committee reviews related-person transactions under a written policy; the 2026 proxy statement says none occurred in FY2025.
- Credit rating
- Not checked for this page
23How it got here
23How it got here
How did FICO get here?
1956
Milestone
Founded
The 10-K says FICO was founded on the idea that data, used well, can improve business decisions.
1989
Milestone
FICO Score launched in the US
FICO introduced the score in the US and has updated it many times since; it now brings in most of FICO's profit.
2017
Business-model change
Last cash dividend
FICO stopped paying cash dividends after May 2017; since then it has returned cash through buybacks.
2020
Milestone
FICO Score 10T
Introduced FICO Score 10T, which adds trended credit data (a borrower's history over time).
2025
Business-model change
Direct licensing for mortgage scores
In Oct 2025 FICO announced a direct licensing program under which mortgage resellers can calculate and sell FICO Scores without the bureaus.
2026
Milestone
$3.0 billion of buybacks, funded with debt
Spent $3,046.0 million on buybacks in FY2026, including a $1.5 billion accelerated buyback funded by a new term loan.
2026
Crisis
Lawsuit settlement and job cuts
According to the FY2026 10-K, FICO signed a $65.0 million term sheet in Sep 2026 to settle proposed (putative) class actions alleging antitrust violations. In Oct 2026 it announced a cut of about 15% of positions.
24Sources and changes
Where every number on this page comes from
Sources (26 documents)
- S1Form 10-K for FY2026 · SEC EDGAR · Tier 1: company or exchange filing · Nov 6, 2026
- S2Form 10-Q for Q3 FY2026 · SEC EDGAR · Tier 1: company or exchange filing · Jul 29, 2026
- S3Form 10-Q for Q2 FY2026 · SEC EDGAR · Tier 1: company or exchange filing · Apr 28, 2026
- S4Form 10-Q for Q1 FY2026 · SEC EDGAR · Tier 1: company or exchange filing · Jan 28, 2026
- S5Form 10-K for FY2025 · SEC EDGAR · Tier 1: company or exchange filing · Nov 7, 2025
- S6Form 10-Q for Q3 FY2025 · SEC EDGAR · Tier 1: company or exchange filing · Jul 30, 2025
- S7Form 10-Q for Q2 FY2025 · SEC EDGAR · Tier 1: company or exchange filing · Apr 29, 2025
- S8Form 10-Q for Q1 FY2025 · SEC EDGAR · Tier 1: company or exchange filing · Feb 4, 2025
- S9Form 10-K for FY2024 · SEC EDGAR · Tier 1: company or exchange filing · Nov 6, 2024
- S10Form 10-Q for Q3 FY2024 · SEC EDGAR · Tier 1: company or exchange filing · Jul 31, 2024
- S11Form 10-Q for Q2 FY2024 · SEC EDGAR · Tier 1: company or exchange filing · Apr 25, 2024
- S12Form 10-Q for Q1 FY2024 · SEC EDGAR · Tier 1: company or exchange filing · Jan 25, 2024
- S13Form 10-K for FY2023 · SEC EDGAR · Tier 1: company or exchange filing · Nov 8, 2023
- S14Form 10-K for FY2022 · SEC EDGAR · Tier 1: company or exchange filing · Nov 9, 2022
- S152026 proxy statement (DEF 14A) · SEC EDGAR · Tier 1: company or exchange filing · Jan 27, 2026
- S16Q4 FY2026 earnings release (8-K Exhibit 99.1) · SEC EDGAR · Tier 1: company or exchange filing · Nov 4, 2026
- S17Q3 FY2026 earnings release (8-K Exhibit 99.1) · SEC EDGAR · Tier 1: company or exchange filing · Jul 29, 2026
- S18Q2 FY2026 earnings release (8-K Exhibit 99.1) · SEC EDGAR · Tier 1: company or exchange filing · Apr 28, 2026
- S19Q1 FY2026 earnings release (8-K Exhibit 99.1) · SEC EDGAR · Tier 1: company or exchange filing · Jan 28, 2026
- S20Q4 FY2025 earnings release (8-K Exhibit 99.1) · SEC EDGAR · Tier 1: company or exchange filing · Nov 5, 2025
- S21Q3 FY2025 earnings release (8-K Exhibit 99.1) · SEC EDGAR · Tier 1: company or exchange filing · Jul 30, 2025
- S22Q2 FY2025 earnings release (8-K Exhibit 99.1) · SEC EDGAR · Tier 1: company or exchange filing · Apr 29, 2025
- S23Q1 FY2025 earnings release (8-K Exhibit 99.1) · SEC EDGAR · Tier 1: company or exchange filing · Feb 4, 2025
- S248-K filed Oct 6, 2026: workforce restructuring plan (Item 2.05) · SEC EDGAR · Tier 1: company or exchange filing · Oct 6, 2026
- S258-K filed Jun 8, 2026: credit agreement amendment, term loan and share repurchase (Item 1.01) · SEC EDGAR · Tier 1: company or exchange filing · Jun 8, 2026
- S268-K filed Mar 20, 2026: 6.250% senior notes due 2034 (Item 1.01) · SEC EDGAR · Tier 1: company or exchange filing · Mar 20, 2026
Changes to this page (v1 · Nov 20, 2026)
- v1 · Nov 20, 2026First version. (first version)
Numbers come only from tier 1 and tier 2 sources. Read how we research.
Disclaimer
For learning only. Cityfort is not a registered investment adviser or broker-dealer and does not recommend buying or selling any security. Prices shown are dated and may be out of date.
Investing in securities involves risk, including loss of capital. Before making any investment decision, do your own research and consider consulting a registered investment adviser or other qualified professional.
Cityfort, its owners and contributors may or may not hold securities of companies covered. Cityfort is not paid by any company it covers. Content is not an offer or solicitation to buy or sell any security, including in any initial public offering.
Read the positions policyRead the full disclaimerHide the full disclaimer
Cityfort publishes general educational content that explains how listed companies work. Cityfort is not registered with the US Securities and Exchange Commission or any state securities regulator as an investment adviser, and is not a broker-dealer or a member of FINRA. Cityfort does not provide investment, tax or legal advice, recommendations, ratings, price targets or any opinion on whether to buy, sell or hold any security. Nothing on the site is tailored to any person's circumstances.
All information is taken from publicly available sources, mainly company filings with the SEC, which are listed on each page with dates. We work to keep it accurate and correct errors publicly, but we do not guarantee that it is complete, accurate or up to date. Any market price or price-based ratio shown is dated, may be out of date by the time you read it, and is included only to explain concepts.
Statements by company management, including forward-looking statements and guidance, are reported as the company's statements, with their date and source; they are not our forecasts. Adjusted (non-GAAP) figures are the company's own measures and are shown next to the official (GAAP) figures.