Technology · NYSE: IT
Gartner: how the business works
Gartner sells research subscriptions, conferences and consulting to managers at over 13,000 client organizations, with revenue of $6,497M in FY2025.
By Hardik Bhandare · Checked against filings: . Editorial policy. Corrections
Follow Gartner
Email me when Gartner's page is updated after earnings.
We'll send a confirmation email first. See our privacy policy.
Gartner, Inc. · Stamford, Connecticut
Updated for Q3 FY2026 · checked
- Revenue, FY2025
- $6,497M
- Net income, FY2025
- $729M
- Research subscriptions, share of FY2025 revenue
- 78%
- Client enterprises, 2025
- Over 13,000
- Employees, Dec 31, 2025
- 20,244
The short version
Gartner in 5 points
1 · What it sells
Gartner sells research subscriptions, conferences and consulting to company managers, with revenue of $6,497M in FY2025.
2 · Who pays it
In FY2025, research subscription clients paid 78.1% of Gartner's revenue, conference attendees and exhibitors 9.9%, consulting clients 8.5% and customers of the since-sold Digital Markets unit 3.5%.
3 · What it keeps from $100
Of every $100 that came in during FY2025, Gartner kept $11.1 as net income, which includes interest and other income and a one-off $150M goodwill write-down; operating income was $1,026M.
4 · Where the operating profit comes from
Gartner reports gross contribution (segment revenue minus direct costs, before sales and overhead), not segment operating profit: in FY2025 Insights earned $3,890M, Conferences $323M and Consulting $186M.
5 · The one thing to watch
CEO Gene Hall said on Feb 3, 2026 that Gartner expects contract value growth to accelerate throughout 2026; currency-neutral growth was +2.1% (GTS) and +3.7% (GBS) at Sep 30, 2026, against 0% and +3% at Dec 31, 2025.
Sources: From Gartner's FY2025 10-K, the Q3 FY2026 10-Q and the Q4 2025 and Q3 2026 earnings releases · checked
01Where the money goes · FY2025
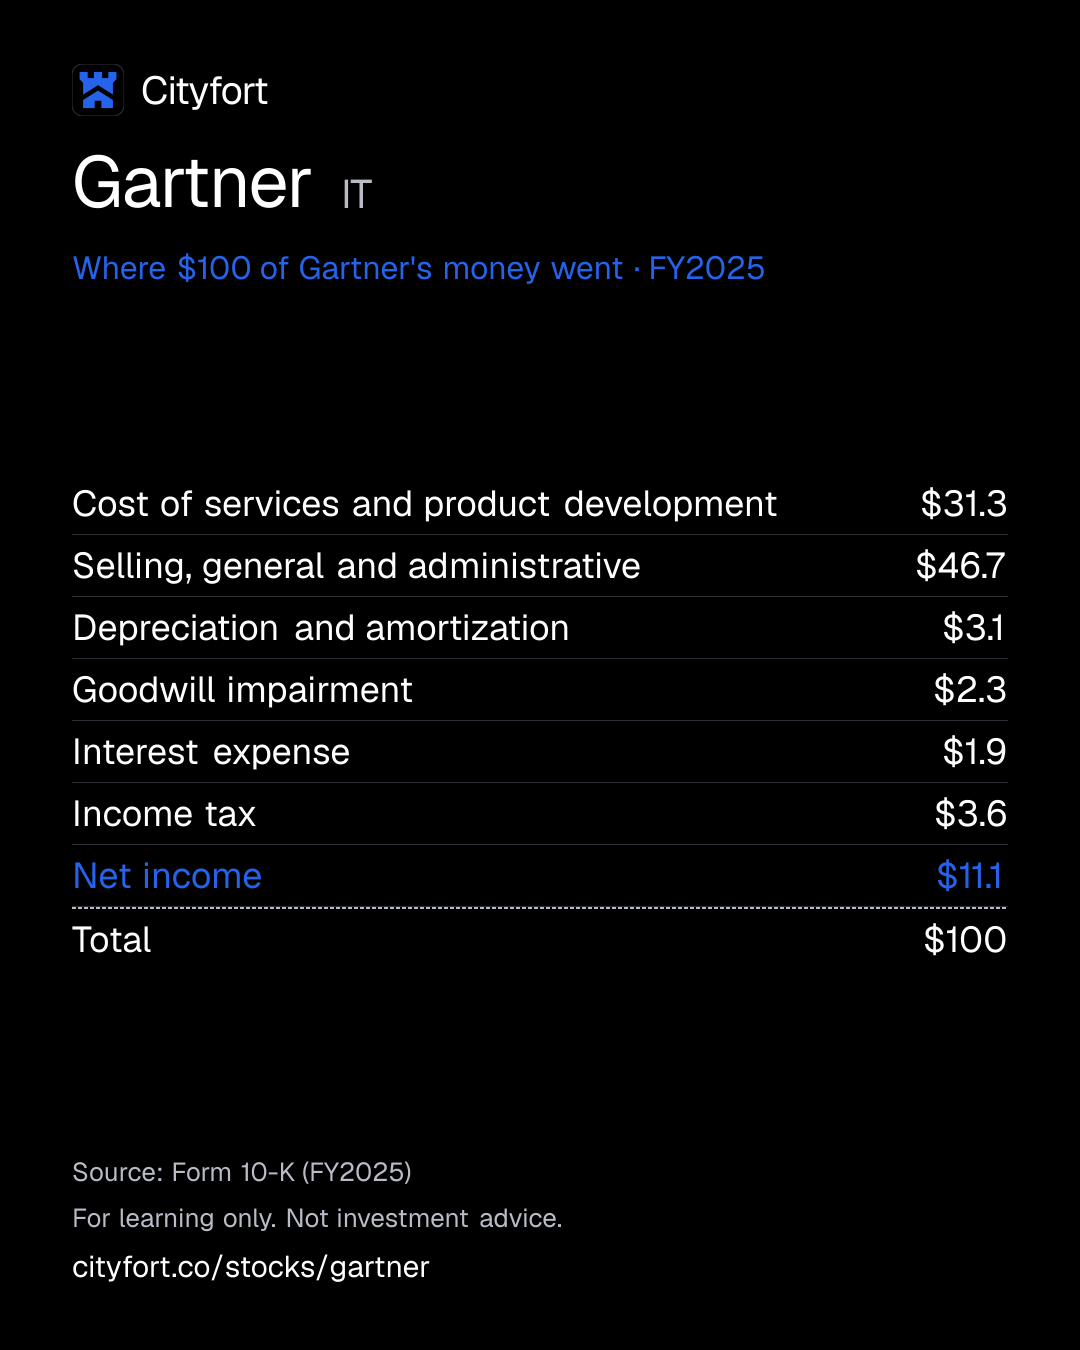
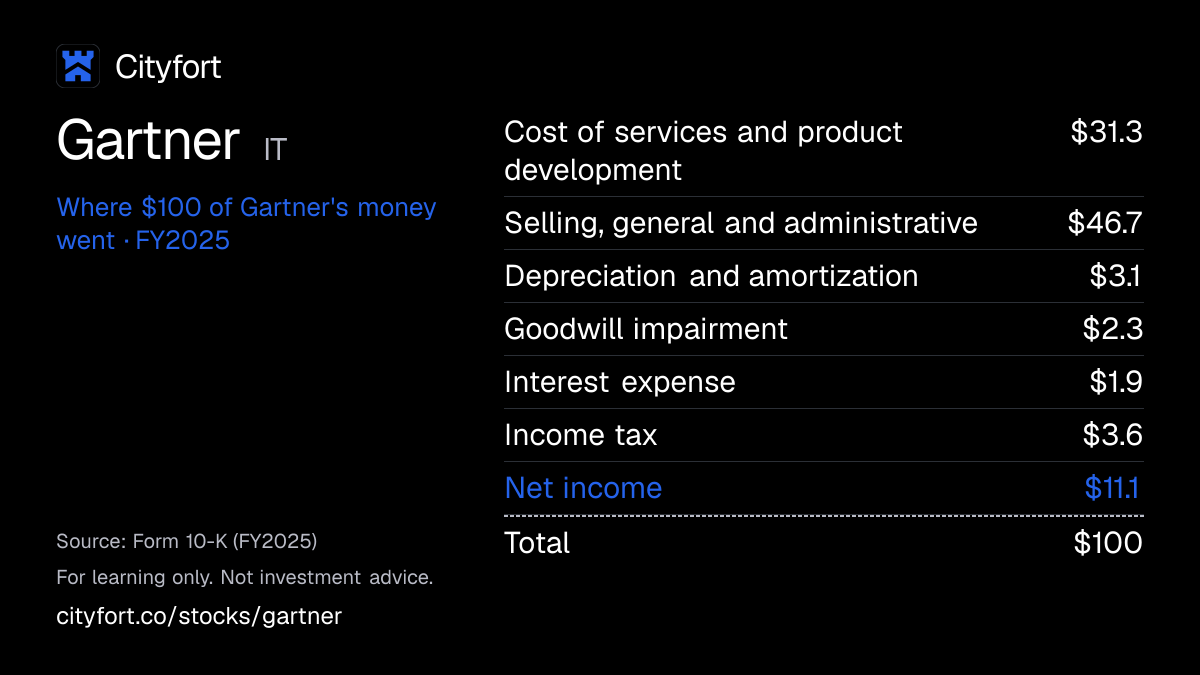
Where does $100 of Gartner's money go?
Gartner · FY2025
Receipt for every $100
| Cost of services and product development | $31.3 |
|---|---|
| Selling, general and administrative | $46.7 |
| Depreciation and amortization | $3.1 |
| Goodwill impairment | $2.3 |
| Interest expense | $1.9 |
| Income tax | $3.6 |
| Net income | $11.1 |
| Total | $100 |
Each line = amount ÷ total money in × 100. Lines may not add to exactly $100 because of rounding.
How this is worked out
Of every $100 that came in during FY2025 (revenue plus interest and other income, $6,565M). Cityfort calculation from the FY2025 10-K.
Save this receipt as an image
Embed this receipt or the key numbers
Paste this code into a blog or website to show the card you choose, with a link back to this page.
Each week: the next company due to report earnings, explained in 5 points.
No tips. Unsubscribe anytime.
We'll send a confirmation email. See our privacy policy.
02The business in one line
What does Gartner do?
Companies pay Gartner, mostly upfront, for yearly or multi-year access to its research and experts. Most of the money goes on sales staff and on making the research, and $11.1 of every $100 was left as net income in FY2025.
- Research subscriptions (the Insights segment) brought in $5,073M, 78% of FY2025 revenue; conferences and consulting brought in most of the rest.
- Selling, general and administrative costs took $46.7 of every $100 in FY2025, and making and delivering the research, events and projects took $31.3.
- Gartner pays no cash dividend; it spent $1,991M buying back its own shares in 2025.
03Who pays it
Who pays Gartner?
Companies buying research subscriptions
78.1%
of revenue
Global Technology Sales sells to users and providers of technology; Global Business Sales sells to other leaders such as HR, supply chain, finance and marketing.
Conference attendees and exhibitors
9.9%
of revenue
Executives and their teams who pay to attend Gartner events. Revenue is counted when each conference ends.
Consulting clients
8.5%
of revenue
Chief information officers and other senior executives paying for fixed-fee, time-based or results-based projects.
Digital Markets customers (sold)
3.5%
of revenue
Customers of the Digital Markets unit, which Gartner sold in February 2026; the filings show it as Other.
- Companies buying research subscriptions78.1%
- Conference attendees and exhibitors9.9%
- Consulting clients8.5%
- Digital Markets customers (sold)3.5%
How spread out the customers are
No single client brought in 10% or more of FY2025 revenue. US federal government Insights contract value was about $126M at Dec 31, 2025, and less than half of the Dec 31, 2024 federal contract value was kept in 2025.
04How it makes money
How does Gartner make money?
Gartner writes research once and sells access to it many times, and clients pay upfront.
Insights kept $77 of gross contribution per $100 of its revenue in FY2025, against $50 for Conferences and $34 for Consulting (segment note). Clients are mostly billed upfront, so cash comes in early. In FY2025 it spent $1,991M on buybacks, against $1,290M of cash from operations.
Diluted shares, millions (weighted average)
M79.7M63.9
FY2023 to Q3 FY2026
- Experts publish research and answer client questions
- Sales staff sell multi-year subscriptions, mostly billed upfront
- The 10-K says the model has operating leverage: the same research feeds subscriptions, conferences and consulting
- Upfront payments bring in cash: $1,290M from operations in FY2025
- Buybacks use that cash and cut the share count
↺ Step 5 feeds back into step 1.
05Business segments · FY2025
Which businesses make up Gartner?
Insights
78.1%Research subscriptions. Gross contribution was $3,890M, 77% of segment revenue, in FY2025.
Revenue $5.1B ($5,073M)
Conferences
9.9%Paid events; revenue grew 11% in FY2025. Gross contribution was $323M, 50% of segment revenue.
Revenue $645M
Consulting
8.5%IT advisory projects; revenue fell 1% in FY2025. Gross contribution was $186M, 34% of segment revenue.
Revenue $553M
Other
3.5%Digital Markets, moved out of Insights in Q3 2025 and sold in February 2026.
Revenue $227M
How the mix changed
- Insights
- Conferences
- Consulting
- Other
Revenue by segment, FY2023 to FY2025.
US$
See the numbers
06The numbers · Consolidated · US$
How has Gartner done?
Revenue
$6.5BFY2025
Revenue rose every year, from $4,734M in FY2021 to $6,497M in FY2025 ($6,267M in FY2024).
US$
See the numbers
Net income
$729MFY2025
Net income fell to $729M in FY2025 from $1,254M in FY2024, a year that included a $300M insurance gain; FY2025 carried a $150M goodwill impairment.
US$
See the numbers
Net income for every $100 of revenue
$11.2FY2025
Net income per $100 of revenue was $11.2 in FY2025, down from $20.0 in FY2024 and $16.8 in FY2021.
Net margin: $ of net income per $100 of revenue
See the numbers
Free cash flow
$1.2BFY2025
Free cash flow was $1,175M in FY2025, down from $1,383M in FY2024, when insurance proceeds lifted operating cash flow; FY2021 capital spending is not shown on this page.
US$ · cash from operations minus spending on plants and equipment
See the numbers
See all yearly numbers
EBITDA here = operating income plus depreciation and amortization (from the cash flow statement). Fiscal years are the company's own: Fiscal year ends Dec 31 (the calendar year). Net income is the share belonging to the company's owners.
Learn: Fiscal years that don't end in December: Nvidia's FY2027 explained · Stock-based compensation and dilution: pay that becomes shares
Sources (16)
- Form 10-K for FY2021
- Form 10-K for FY2022
- Form 10-K for FY2023
- Form 10-K for FY2024
- Form 10-K for FY2025
- Form 10-Q for Q1 FY2024
- Form 10-Q for Q2 FY2024
- Form 10-Q for Q3 FY2024
- Q4 2024 earnings release (8-K Ex. 99.1)
- Q4 2025 earnings release (8-K Ex. 99.1)
- Form 10-Q for Q1 FY2025
- Form 10-Q for Q2 FY2025
- Form 10-Q for Q3 FY2025
- Form 10-Q for Q1 FY2026
- Form 10-Q for Q2 FY2026
- Form 10-Q for Q3 FY2026
07Who runs it
Who runs Gartner, and did they deliver?
Eugene A. Hall
Chairman and Chief Executive Officer · since 2004
CEO since August 2004 and Chairman since July 2024. His employment agreement requires Gartner to nominate him to the board.
Craig W. Safian
Executive Vice President and Chief Financial Officer · since 2014
CFO since June 2014, with more than 23 years at Gartner.
Scott Hensel
Executive Vice President, Global Services and Delivery
A named executive officer in the 2026 proxy statementThe yearly filing about shareholder votes, the board and executive pay. Learn more.
Robin Kranich
Executive Vice President and Chief Human Resources Officer · since 2008
In the role since May 2008, with more than 31 years at Gartner.
Karen E. Dykstra
Lead Independent Director
Leads the independent directors on a 13-member board whose directors serve one-year terms.
What they said, and what happened
1 too early to tell · 1 delivered
Said on Feb 3, 2026
CEO Gene Hall said in the Q4 2025 earnings release that Gartner expects contract value growth to accelerate throughout 2026.
Too early to tellWhat happened
Currency-neutral growth in GTS contract value went from 0% at Dec 31, 2025 to +0.4%, +1.1% and +2.1% in the next three quarters; GBS from +3% to +3.2%, +3.3% and +3.7%. The year ends Dec 31, 2026.
Said on Feb 3, 2026
Gartner said in the Q4 2025 earnings release that it had signed a definitive agreement to sell the Digital Markets business.
DeliveredWhat happened
The sale closed in February 2026 for about $99.8M net of cash transferred, with a pre-tax gain of $6.8M (Q3 FY2026 10-Q).
08What could go wrong
What could go wrong for Gartner?
- Technology
AI tools and free information
Gartner’s 10-K says limited barriers to entry exist in its markets, free internet sources compete, and it expects more competition as AI services spread. Its research subscriptions were 78% of FY2025 revenue.
Watch GTS and GBS wallet retention in the 10-Q and 10-K filings (96% and 99% at Dec 31, 2025).
- Concentration
US federal government cuts
Federal Insights contract value was about $126M at Dec 31, 2025, and less than half of the prior year’s federal contract value was kept in 2025. Government contracts can be ended at any time without penalty.
Watch Public sector contract value in the quarterly filings.
- Demand
Clients spending less on renewal
GTS wallet retention fell from 102% to 96% in 2025 and GBS from 106% to 99%; the 10-K links this mostly to lower spending by existing clients. Contract value grew 1% in 2025.
Watch Contract value growth, currency-neutral, each quarter.
- Debt
More debt and a stockholders’ deficit
Gartner raised $800M of notes in November 2025 while spending $1,991M on buybacks that year. Debt principal was $3,000M and stockholders’ equity a deficit of $34.7M at Sep 30, 2026; the credit agreement caps leverage.
Watch Net debt and buyback spending in each 10-Q.
- Currency
Currency swings
About 38% of FY2025 revenue was from sales fulfilled outside the United States and Canada (Cityfort calculation from the FY2025 10-K). Adjusted EBITDAOperating profit before wear-and-tear charges (depreciation and amortization). As a margin: per $100 of sales. rose 5% as reported in Q4 2025 but 1% on a currency-neutral basis.
Watch The gap between reported and currency-neutral growth in each earnings release.
09Supporters vs. critics
What do supporters and critics point to?
What supporters point to
- Research subscriptions were 78% of Gartner's FY2025 revenue; 77% of Insights contracts were multi-year at Dec 31, 2025, and most are billed upfront (FY2025 10-K).
- Gartner reported $1,290M of operating cash flow and $1,175M of free cash flow in FY2025.
- Currency-neutral contract value growth rose in each of the first three quarters of 2026: from 0% to +2.1% for GTS and from +3% to +3.7% for GBS.
- Diluted shares (weighted average) fell from 79.7 million in FY2023 to 63.9 million in Q3 FY2026 as Gartner bought back stock.
- Gartner serves over 13,000 client enterprises, and no single client brought in 10% or more of FY2025 revenue.
What critics point to
- Existing clients renewed for less in 2025: GTS wallet retention fell from 102% to 96% and GBS from 106% to 99%.
- The FY2025 10-K says limited barriers to entry exist in Gartner's markets, free internet sources compete, and it expects more competition as AI services spread.
- Gartner issued $800M of notes in November 2025 and spent $1,991M on buybacks that year; at Sep 30, 2026 debt principal was $3,000M and stockholders' equity a deficit of $34.7M.
- Less than half of Gartner's Dec 31, 2024 US federal contract value was kept in 2025, leaving about $126M at Dec 31, 2025.
10What to watch next
What should you watch next at Gartner?
Next event
Q4 FY2026 results
Date not announced yet.
Contract value growth
CEO Gene Hall said on Feb 3, 2026 that Gartner expects contract value growth to accelerate throughout 2026. Currency-neutral growth was +2.1% (GTS) and +3.7% (GBS) at Sep 30, 2026.
Wallet retention
The share of last year's contract value that existing clients renewed, currency-neutral. It was 96% (GTS) and 99% (GBS) at Dec 31, 2025, down from 102% and 106%.
Buybacks against debt
Gartner had $1.1B of buyback authorization left at Sep 30, 2026. Net debt was $1,367M and stockholders' equity a deficit of $34.7M on that date.
Full-year 2026 results against guidance
Gartner said on Nov 3, 2026 that it raised its full-year 2026 guidance for revenues, adjusted EBITDA excluding the divested operation, adjusted EPS and free cash flowCash from operations minus spending on buildings and equipment. Learn more. The Q4 FY2026 release will show the full year.
11Key facts
Key facts about Gartner
- What does Gartner do?
- Gartner, Inc. sells research and advice to company managers: subscriptions to its research and experts, paid conferences and consulting projects. Research subscriptions brought in $5,073M, 78% of Gartner's FY2025 revenue of $6,497M.
- How does Gartner make money?
- Gartner makes most of its money from subscriptions with a minimum term of 12 months, mostly billed upfront. In FY2025, Insights subscriptions were 78.1% of Gartner's revenue, Conferences 9.9%, Consulting 8.5% and the since-sold Digital Markets unit 3.5%.
- Who are Gartner's customers?
- Gartner served over 13,000 client enterprises in about 90 countries and territories in 2025, and no single client brought in 10% or more of its FY2025 revenue. Sales fulfilled in the United States and Canada were 62.1% of Gartner's FY2025 revenue (Cityfort calculation from the FY2025 10-K).
- How big is Gartner?
- Gartner had revenue of $6,497M and net income of $729M in FY2025, against $6,267M and $1,254M in FY2024, a year that included a $300M insurance gain. Gartner had 20,244 employees at Dec 31, 2025.
- How much operating profit does Gartner make?
- Gartner's operating income was $1,026M in FY2025, down 11% from $1,156M in FY2024. FY2025 included a $150M goodwill write-down on the Digital Markets business, which Gartner sold in February 2026.
- Does Gartner pay a dividend?
- Gartner pays no cash dividend. It spent $1,991M buying back 7.04 million of its shares in 2025 and $1,220M buying back 7.83 million in the first nine months of 2026.
- How much debt does Gartner have?
- Gartner had $3,000M of fixed-rate senior notes and $1,633M of cash at Sep 30, 2026, which is net debt of $1,367M (Cityfort calculation from the Q3 FY2026 10-Q). Gartner's stockholders' equity was a deficit of $34.7M on that date.
- Who owns Gartner?
- Gartner has one class of common stock, listed on the NYSE as IT. Gartner's 2026 proxy statement lists The Vanguard Group with 14.2% and BlackRock with 10.8%, and its directors and executive officers as a group held 2.6% as of Apr 2, 2026.
Terms on this page
- Capital expenditures (capex)
- Earnings per share (EPS)
- EBITDA
- Free cash flow
- Net debt
- Net margin
- Remaining performance obligations (RPO)
- Revenue vs net income
- Stock buyback
Each explains the term in plain English, with the same number from other companies on Cityfort.
Go deeper
More detail from the same filings. Open any section.
12What it sells
12What it sells
What does Gartner sell?
Insights subscriptions
Yearly or multi-year access to research reports, data, benchmarks and calls with experts. Insights brought in $5,073M, or 78% of revenue, in FY2025.
Conferences
Paid events such as the Gartner Symposium/Xpo series, for IT and business executives. Gartner held 53 destination conferences with 83,727 attendees in 2025.
Consulting
Projects for chief information officers on IT costs, digital change and IT sourcing, using Gartner research and benchmarks.
AskGartner
An AI tool launched in August 2025 that lets licensed users ask questions in plain language and get answers drawn from Gartner research.
Think of it like this
Like a library with a help desk: clients pay a yearly fee to read Gartner research and to put questions to its experts.
What it does
- Does: Signs subscriptions with a minimum term of 12 months; 77% of Insights contracts were multi-year at Dec 31, 2025
- Does: Bills most subscription contracts upfront, so cash arrives before revenue is counted
- Does: Serves over 13,000 client enterprises in about 90 countries and territories
What it does not do
- Does not: Does not own the Digital Markets business any more: it sold it in February 2026
- Does not: Does not pay a cash dividend; it returns cash through share buybacks
- Does not: Does not depend on one client: none brought in 10% or more of FY2025 revenue
13How the money flows
13How the money flows · FY2025
How does money flow through Gartner?
Money in
- Insights subscriptions$5.1B
- Conferences$645M
- Consulting$553M
- Other (Digital Markets, since sold)$227M
- Interest income and other income$67.7M
The company
Gartner
$6.6B came in
Money out
- Cost of services and product development (making and delivering research, events and projects)$2.1B
- Selling, general and administrative (sales and overhead)$3.1B
- Depreciation and amortization of intangibles$200M
- Goodwill impairment (Digital Markets write-down)$150M
- Interest expense$125M
- Income tax$239M
- Net income$729M
- Clients sign subscriptions, mostly billed upfront, and pay for conference seats and consulting work: $6,497M in FY2025.
- It spent $2,054M on making and delivering its research, events and consulting work.
- The largest cost is selling, general and administrative spending: $3,068M, 47% of revenue.
- After wear-and-tear, a $150M write-down, interest and tax, $729M was left as net income.
Sources (1)
14What it needs to run
14What it needs to run
What does Gartner need to run?
Experts and consultants
More than 2,400 business and technology experts and 920 consultants at Dec 31, 2025, in more than 30 countries and territories. Their research is the product.
A sales force
Quota-bearing sales staff sell and renew subscriptions: 3,704 in Global Technology Sales and 1,280 in Global Business Sales at Dec 31, 2025, down 3% and 1%.
Employees
20,244 employees at Dec 31, 2025, 9,994 of them outside the US; 19,460 at Sep 30, 2026, down 7% in a year.
The Gartner name
The 10-K says Gartner has sold research under its own name for more than 40 years and lists the brand as a factor that sets it apart.
Sources (2)
15Where it sells
15Where it sells · FY2025
Where does Gartner sell?
- United States and Canada62.1%
- Europe, Middle East and Africa26.1%
- Other international11.9%
Sources (1)
16Where growth could come from
16Where growth could come from
Where could Gartner's growth come from?
Gartner said in its Q3 2026 earnings release (Nov 3, 2026) that it raised its full-year 2026 guidance for revenues, adjusted EBITDA excluding the divested operation, adjusted EPS and free cash flow. The figures are in a separate supplement that this page does not use.
Insights contract value
Mixed$5,340M at Sep 30, 2026, +2%
Contract value is a company measure of the subscription contracts in force, on a currency-neutral basis; it is not revenue. Growth slowed from +7% (GTS) and +12% (GBS) at Dec 31, 2024 to 0% and +3% a year later, then reached +2.1% and +3.7% at Sep 30, 2026.
Status: Mixed, partly on track.
Conferences
Working+11% revenue in FY2025
Gartner held 53 destination conferences in 2025, up from 51, though attendees fell 3% to 83,727. In the first nine months of 2026 it held 41, up from 39.
Status: Working, on track against what the company said.
Consulting backlog
Mixed$216.9M at Sep 30, 2026, +9%
Consulting revenue fell 1% in FY2025 and backlog ended 2025 at $173.7M, down 7%. By Sep 30, 2026 backlog was up 9% on a currency-neutral basis, with 12% fewer billable consultants.
Status: Mixed, partly on track.
AskGartner AI tool
NewLaunched August 2025
An AI tool that answers client questions from Gartner research. CEO Gene Hall said in the Q2 2025 earnings release that clients “will realize even more value from their licenses” as it rolls out.
Status: New, recently announced.
Status compares progress with what the company itself said it would do: Working = on track against what the company said; Mixed = partly on track; Behind = behind the company's own plan; New = recently announced; Early = too early to judge.
17The company's own measures (non-GAAP)
17The company's own measures · FY2025 (year ended Dec 31, 2025), unless stated
What do Gartner's own measures show?
Official (GAAP): Net income (GAAP), FY2025
$729M
Company's own measure: Adjusted EBITDA, FY2025
$1.6B
Gartner adds back interest, tax, stock-based payPay given as shares instead of cash, which spreads ownership more thinly. Learn more, depreciation and amortization, the $150M goodwill impairment and workforce reduction and other one-off costs.
Official (GAAP): Net income (GAAP), Q3 FY2026
$214M
Company's own measure: Adjusted EBITDA excluding divested operation, Q3 FY2026
$364M
Same add-backs; this version also leaves out the Digital Markets business sold in February 2026.
Official (GAAP): Remaining performance obligations on contracts over one year, Sep 30, 2026
$6.3B
Company's own measure: Insights contract value, Sep 30, 2026
$5.3B
Contract value is a currency-neutral company measure of Insights subscriptions in force. The 10-Q puts revenue still to be earned on contracts longer than a year at about $6.3B.
These are the company's own measures, defined by the company. They are not comparable across companies, and they are not added together. Each sits beside the nearest official (GAAP) figure.
Learn: Non-GAAP measures: what a company's "adjusted" numbers leave out · Stock-based compensation and dilution: pay that becomes shares
18Financial strength and debt
18Financial strength · Sep 30, 2026
How much debt does Gartner have?
- Total debt$3.0B
- Cash and investments$1.6B
- Net debt (debt minus cash)$1.4B
- Net worth (shareholders' money)−$34.7M
- All $3,000M is fixed-rate senior notes: $800M at 4.50% due 2028, $600M at 3.625% due 2029, $800M at 3.75% due 2030, $350M at 4.95% due 2031 and $450M at 5.60% due 2035.
- A $1.0B revolving credit line was undrawn at Sep 30, 2026. The credit agreement sets a maximum leverage ratio and other limits.
- Stockholders’ equity was a deficit of $34.7M at Sep 30, 2026, against equity of $319.9M at Dec 31, 2025. The 10-Q shows $10,236M of shares bought back and held as treasury stock.
- Deferred revenue, money billed for service not yet delivered, was $2,576M at Sep 30, 2026.
Sources (2)
19Who owns it
19Who owns it · ownership as of Apr 2, 2026
Who owns Gartner?
- Officers and directors (as a group), shares
- 2.6%
Share classes
Holders of 5% or more
From the company's proxy statement (DEF 14A), later Schedule 13G filings and the share counts on its latest annual or quarterly report. Each holder row shows the date of its own filing.
Learn: How to read a proxy statement (DEF 14A): Nvidia's 2026 proxy · Form 4 insider filings: who files, the codes and the footnotes
20What it does with profit
20What it does with profit
What does Gartner do with its profit?
Buyback · Dec 31, 2023
Bought back 1.81 million shares for treasury in 2023, spending $606M in cash.
$606M
Buyback · Dec 31, 2024
Bought back 1.62 million shares in 2024, spending $735M in cash.
$735M
Buyback · Sep 12, 2025
The board added $1.0B to the share repurchase authorization.
$1.0B
Buyback · Dec 31, 2025
Bought back 7.04 million shares in 2025, spending $1,991M in cash; $745M of authorization was left at year end.
$2.0B
Buyback · Sep 30, 2026
Bought back 7.83 million shares in the first nine months of 2026 for $1,220M in cash; $1.1B of authorization was left at Sep 30, 2026.
$1.2B
Money raised · Nov 20, 2025
Issued $800M of senior notes: $350M at 4.95% due 2031 and $450M at 5.60% due 2035. Part of the money repaid $274.4M drawn on the credit line.
$800M
21Governance signals
21Governance signals
What do Gartner's governance filings show?
- Auditor
- KPMG LLP, since 1996
- Auditor changes
- None in the period covered
- Audit qualifications
- None reported
- Related-party dealings
- The 2026 proxy says that since Jan 1, 2025 there were no related party transactions in which a director, executive officer or holder of more than 5% had a material interest.
- Credit rating
- No public credit rating found in a search of rating agency sites on Nov 20, 2026
Flags to know about
other
One person is Chairman and CEO
Eugene Hall has been CEO since 2004 and Chairman since July 2024. The board has a Lead Independent Director, and its Audit, Compensation and Governance committees are all independent.
other
Chief Legal Officer left in October 2026
An 8-K filed Oct 8, 2026 says Thomas Kim, Chief Legal Officer and Secretary, stepped down effective Oct 16, 2026 to pursue a new senior executive role. The filing says there was no disagreement between Mr. Kim and the company.
other
Executive pay changes, November 2026
An 8-K filed Nov 19, 2026 says the Compensation Committee raised base salaries and approved time-based stock grants worth $6.5M for CFO Craig Safian and $4.3M each for Scott Hensel and Robin Kranich, vesting over four years.
22How it got here
22How it got here
How did Gartner get here?
2004
Milestone
Eugene Hall becomes CEO
Hall has led Gartner since August 2004 and became Chairman in July 2024.
2015
Milestone
Buyback program starts
The board authorized $1.2B of share repurchases, later topped up by $7.4B from February 2021 to July 2026.
2023
Business-model change
Sells TalentNeuron
Gartner sold the TalentNeuron business, booking a $135.4M gain in 2023.
2024
Milestone
$300M insurance gain
Gartner booked a $300M gain on event cancellation insurance claims in 2024. FY2024 net income was $1,254M, against $882M in FY2023.
2025
Crisis
Federal cuts and a write-down
Less than half of US federal contract value was kept in 2025. Gartner wrote down Digital Markets goodwill by $150M in Q3 2025.
2025
Business-model change
Biggest buyback quarter, more debt
Gartner spent $1,991M on buybacks in 2025, including more than $1B in Q3, which the CEO called a Gartner record for a single quarter. It issued $800M of notes in November 2025.
2026
Business-model change
Digital Markets sold
The sale closed in February 2026, leaving Insights, Conferences and Consulting as the three businesses.
23Sources and changes
Where every number on this page comes from
Sources (26 documents)
- S1Form 10-Q for Q3 FY2026 · SEC EDGAR · Tier 1: company or exchange filing · Nov 3, 2026
- S2Form 10-Q for Q2 FY2026 · SEC EDGAR · Tier 1: company or exchange filing · Aug 4, 2026
- S3Form 10-Q for Q1 FY2026 · SEC EDGAR · Tier 1: company or exchange filing · May 5, 2026
- S4Form 10-K for FY2025 · SEC EDGAR · Tier 1: company or exchange filing · Feb 12, 2026
- S5Form 10-Q for Q3 FY2025 · SEC EDGAR · Tier 1: company or exchange filing · Nov 4, 2025
- S6Form 10-Q for Q2 FY2025 · SEC EDGAR · Tier 1: company or exchange filing · Aug 5, 2025
- S7Form 10-Q for Q1 FY2025 · SEC EDGAR · Tier 1: company or exchange filing · May 6, 2025
- S8Form 10-K for FY2024 · SEC EDGAR · Tier 1: company or exchange filing · Feb 13, 2025
- S9Form 10-Q for Q3 FY2024 · SEC EDGAR · Tier 1: company or exchange filing · Nov 5, 2024
- S10Form 10-Q for Q2 FY2024 · SEC EDGAR · Tier 1: company or exchange filing · Jul 30, 2024
- S11Form 10-Q for Q1 FY2024 · SEC EDGAR · Tier 1: company or exchange filing · Apr 30, 2024
- S12Form 10-K for FY2023 · SEC EDGAR · Tier 1: company or exchange filing · Feb 15, 2024
- S13Form 10-K for FY2022 · SEC EDGAR · Tier 1: company or exchange filing · Feb 16, 2023
- S14Form 10-K for FY2021 · SEC EDGAR · Tier 1: company or exchange filing · Feb 23, 2022
- S152026 proxy statement (DEF 14A) · SEC EDGAR · Tier 1: company or exchange filing · Apr 15, 2026
- S16Q3 2026 earnings release (8-K Ex. 99.1) · SEC EDGAR · Tier 1: company or exchange filing · Nov 3, 2026
- S17Q2 2026 earnings release (8-K Ex. 99.1) · SEC EDGAR · Tier 1: company or exchange filing · Aug 4, 2026
- S18Q1 2026 earnings release (8-K Ex. 99.1) · SEC EDGAR · Tier 1: company or exchange filing · May 5, 2026
- S19Q4 2025 earnings release (8-K Ex. 99.1) · SEC EDGAR · Tier 1: company or exchange filing · Feb 3, 2026
- S20Q3 2025 earnings release (8-K Ex. 99.1) · SEC EDGAR · Tier 1: company or exchange filing · Nov 4, 2025
- S21Q2 2025 earnings release (8-K Ex. 99.1) · SEC EDGAR · Tier 1: company or exchange filing · Aug 5, 2025
- S23Q4 2024 earnings release (8-K Ex. 99.1) · SEC EDGAR · Tier 1: company or exchange filing · Feb 4, 2025
- S248-K filed Nov 20, 2025 (Items 1.01, 2.03, 8.01: debt) · SEC EDGAR · Tier 1: company or exchange filing · Nov 20, 2025
- S258-K filed Sep 12, 2025 (Item 8.01: $1.0B repurchase authorization) · SEC EDGAR · Tier 1: company or exchange filing · Sep 12, 2025
- S268-K filed Nov 19, 2026 (Item 5.02: executive compensation) · SEC EDGAR · Tier 1: company or exchange filing · Nov 19, 2026
- S278-K filed Oct 8, 2026 (Item 5.02) · SEC EDGAR · Tier 1: company or exchange filing · Oct 8, 2026
Changes to this page (v1 · Nov 20, 2026)
- v1 · Nov 20, 2026First version. (first version)
Numbers come only from tier 1 and tier 2 sources. Read how we research.
Disclaimer
For learning only. Cityfort is not a registered investment adviser or broker-dealer and does not recommend buying or selling any security. Prices shown are dated and may be out of date.
Investing in securities involves risk, including loss of capital. Before making any investment decision, do your own research and consider consulting a registered investment adviser or other qualified professional.
Cityfort, its owners and contributors may or may not hold securities of companies covered. Cityfort is not paid by any company it covers. Content is not an offer or solicitation to buy or sell any security, including in any initial public offering.
Read the positions policyRead the full disclaimerHide the full disclaimer
Cityfort publishes general educational content that explains how listed companies work. Cityfort is not registered with the US Securities and Exchange Commission or any state securities regulator as an investment adviser, and is not a broker-dealer or a member of FINRA. Cityfort does not provide investment, tax or legal advice, recommendations, ratings, price targets or any opinion on whether to buy, sell or hold any security. Nothing on the site is tailored to any person's circumstances.
All information is taken from publicly available sources, mainly company filings with the SEC, which are listed on each page with dates. We work to keep it accurate and correct errors publicly, but we do not guarantee that it is complete, accurate or up to date. Any market price or price-based ratio shown is dated, may be out of date by the time you read it, and is included only to explain concepts.
Statements by company management, including forward-looking statements and guidance, are reported as the company's statements, with their date and source; they are not our forecasts. Adjusted (non-GAAP) figures are the company's own measures and are shown next to the official (GAAP) figures.