Industrials · NYSE: EMR
Emerson: how the business works
Emerson sells the sensors, valves, control systems and software that run refineries, chemical plants and power stations, with $18,982 million of net sales in FY2026.
By Hardik Bhandare · Checked against filings: . Editorial policy. Corrections
Follow Emerson
Email me when Emerson's page is updated after earnings.
We'll send a confirmation email first. See our privacy policy.
Emerson Electric Co. · St. Louis, Missouri · Founded 1890
Updated for Q4 FY2026 · checked
- Net sales, FY2026
- $19.0B
- Net income, FY2026
- $2.7B
- Manufacturing locations, Sep 30, 2026
- About 115
- Employees, Sep 30, 2026
- About 70,000
- Incorporated in Missouri
- 1890
The short version
Emerson in 5 points
1 · What it sells
Emerson sells sensors, valves, control systems and software, test equipment and tools for tradespeople to plants and factories, with net sales of $18,982 million in FY2026.
2 · Who pays it
Emerson names no customer and gives no split by industry; by region, the Americas paid 51.5% of FY2026 net sales, Asia, Middle East & Africa 29.8% and Europe 18.7%.
3 · What it keeps from $100
Of every $100 of FY2026 net sales, Emerson kept $14.18 as net income, which includes one-off tariff refunds of $121 million; it reports no operating income line, and its segments earned $21.83 per $100 of sales.
4 · Where the operating profit comes from
Sensors and valves made $2,643 million of FY2026 segment earnings on $10,496 million of sales, and the software, control systems and test businesses made $1,085 million.
5 · The one thing to watch
Emerson's backlog was $9,593 million on Sep 30, 2026, up from $8,629 million, and its FY2026 10-K (filed Nov 9, 2026) expects about 70% to become sales within 12 months, against about 75% a year earlier.
Sources: From Emerson's FY2026 and FY2025 10-Ks · checked
01Where the money goes · FY2026
Where does $100 of Emerson's money go?
Emerson · FY2026
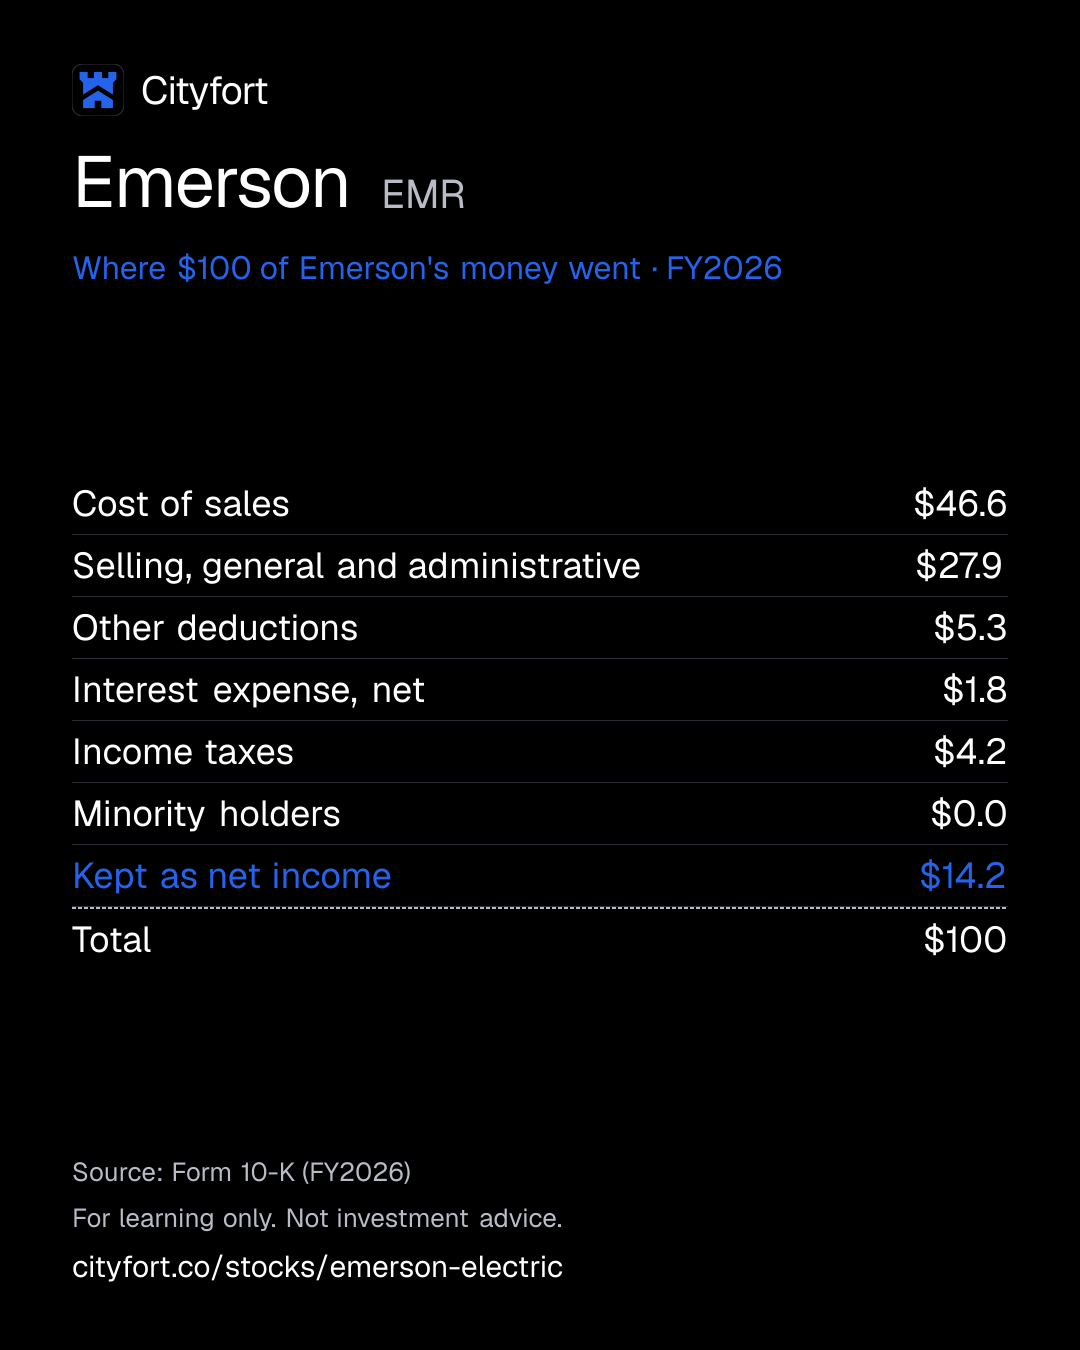
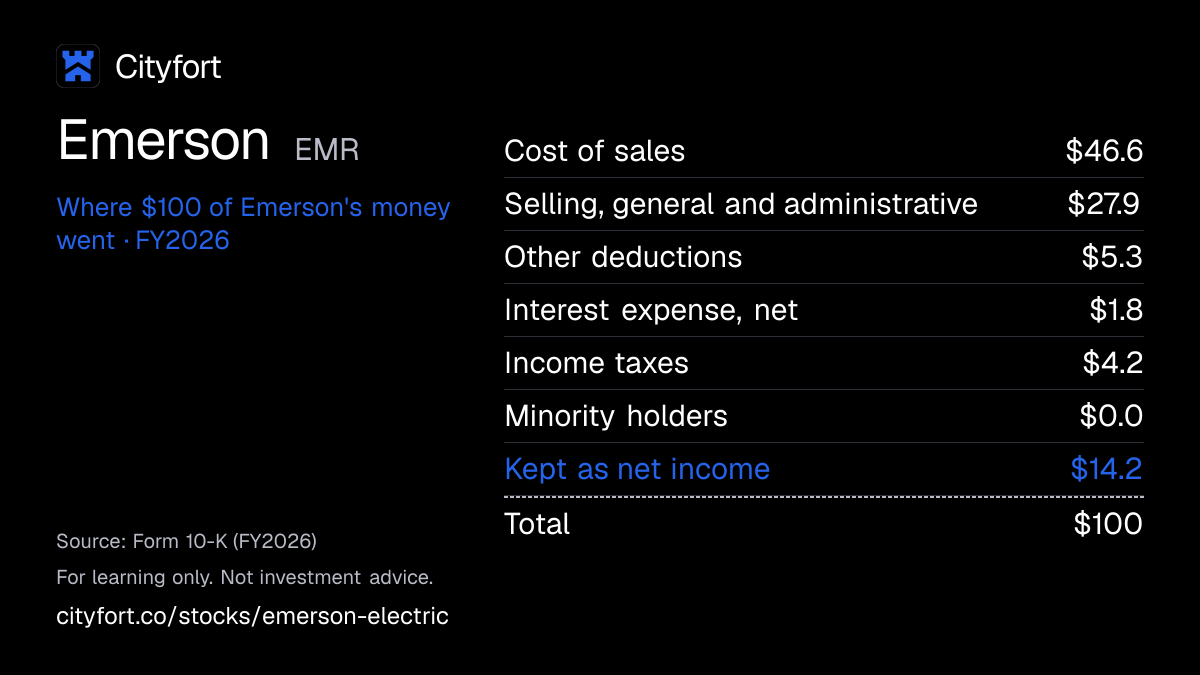
Receipt for every $100
| Cost of sales | $46.6 |
|---|---|
| Selling, general and administrative | $27.9 |
| Other deductions | $5.3 |
| Interest expense, net | $1.8 |
| Income taxes | $4.2 |
| Minority holders | $0.0 |
| Kept as net income | $14.2 |
| Total | $100 |
Each line = amount ÷ total money in × 100. Lines may not add to exactly $100 because of rounding.
How this is worked out
Cityfort calculation from the FY2026 10-K. Of every $100 of net sales in FY2026: each line = line ÷ $18,982 million × 100 (Emerson reports no separate other income).
Save this receipt as an image
Embed this receipt or the key numbers
Paste this code into a blog or website to show the card you choose, with a link back to this page.
Each week: the next company due to report earnings, explained in 5 points.
No tips. Unsubscribe anytime.
We'll send a confirmation email. See our privacy policy.
02The business in one line
What does Emerson do?
Plant and factory owners pay Emerson for instruments, valves, control systems and software. Cost of sales takes $46.64 of every $100 of FY2026 net sales, and $14.18 is left as net income.
- Buyers are power, chemical and energy companies, other plant operators such as mining and food producers, makers of chips, cars and aircraft, and tradespeople who buy its tools.
- Valves and sensors (Final Control and Sensors) made $2,643 million of FY2026 segment earnings, more than the other three segments combined.
03Who pays it
Who pays Emerson?
Emerson does not disclose how much each type of customer pays.
Process industries
Power, chemical and energy companies that buy control systems, sensors and valves for their plants.
Hybrid industries
Life sciences, metals and mining, food and beverage, and pulp and paper producers.
Discrete manufacturers
Semiconductor, aerospace and defense, automotive, medical and packaging companies, including buyers of NI test systems.
Trade professionals
Mechanical, electrical and plumbing workers in construction and maintenance who buy Safety & Productivity tools ($2,174 million of FY2026 sales).
Where its revenue came from · FY2026
- Americas51.5%
- Asia, Middle East & Africa29.8%
- Europe18.7%
How spread out the customers are
The FY2026 10-K does not name any customer or give the share of sales from its largest customers. It does not split sales by industry served.
Sources (1)
04How it makes money
How does Emerson make money?
Devices and systems sold into plants, with acquired software and test businesses on top
Emerson earns most of its segment profit from sensors and valves: Intelligent Devices (the Sensors and Final Control segments) made $2,643 million of segment earnings on $10,496 million of FY2026 sales. Software and test businesses bought since 2023 added sales and also amortization, a yearly non-cash charge for the value of what was bought; amortization of acquired intangibles was $816 million in FY2026. Software & Systems segment earnings rose from $279 million in FY2024 to $1,085 million in FY2026. Segment earnings per $100 of sales is a Cityfort calculation from the FY2026 10-K, on the five-segment layout it recast back to FY2024.
Segment earnings per $100 of sales
$17.7$21.8
FY2024 to FY2026
- Sell sensors, valves and control systems for a new or upgraded plant
- Add software that runs and tunes the plant
- Book orders ahead: backlog was $9,593 million on Sep 30, 2026
- Emerson said in its FY2026 10-K (Nov 9, 2026) that it expects about 70% of backlog to become sales within 12 months
- Spend the cash on dividends, buybacks and acquisitions
↺ Step 5 feeds back into step 1.
Sources (1)
05Business segments · FY2026
Which businesses make up Emerson?
Control Systems & Software
24.1%DeltaV and Ovation plant control systems, AspenTech software and programmable controllers.
Revenue $4.6B ($4,580M) · Operating profit $1.0B ($1,038M)
Test & Measurement
9.1%NI automated test hardware and software, bought in Oct 2023.
Revenue $1.7B ($1,732M) · Operating profit $47M
Sensors
22.7%Rosemount and Micro Motion measuring instruments.
Revenue $4.3B ($4,302M) · Operating profit $1.2B ($1,184M)
Final Control
32.6%Fisher, ASCO and Bettis valves, actuators and regulators.
Revenue $6.2B ($6,194M) · Operating profit $1.5B ($1,459M)
Safety & Productivity
11.5%Tools and equipment for mechanical, electrical and plumbing professionals.
Revenue $2.2B ($2,174M) · Operating profit $416M
How the mix changed
- Control Systems & Software
- Test & Measurement
- Sensors
- Final Control
- Safety & Productivity
Revenue by segment, FY2024 to FY2026.
US$
See the numbers
Sources (1)
06The numbers · Consolidated · US$
How has Emerson done?
Revenue
$19.0BFY2026
Net sales from continuing operations rose every year, from $13,804 million in FY2022 to $18,982 million in FY2026; FY2024 is the first year with NI, bought in Oct 2023.
US$
See the numbers
Net income
$2.7BFY2026
Net income was $13,219 million in FY2023 because it includes the gain on selling Copeland, a discontinued business, and $2,691 million in FY2026, up from $2,270 million in FY2025; FY2024 to FY2026 and Q1 FY2025 to Q4 FY2026 reflect the mark-to-market pension accounting Emerson adopted in 2026, while earlier years and Q1 to Q4 FY2024 are as reported before that change.
US$
See the numbers
Net income for every $100 of revenue
$14.2FY2026
EBITDA (pretax earnings plus net interest, minus related-party interest income, plus depreciation and amortization; Cityfort calculation from the FY2024 and FY2026 10-Ks) per $100 of sales rose from $21.8 in FY2024 to $27.9 in FY2026.
Net margin: $ of net income per $100 of revenue
See the numbers
Free cash flow
$3.5BFY2026
Free cash flow (operating cash flow, including discontinued operations, minus capital spending) was $274 million in FY2023 and $3,535 million in FY2026.
US$ · cash from operations minus spending on plants and equipment
See the numbers
See all yearly numbers
EBITDA here = operating income plus depreciation and amortization (from the cash flow statement). Fiscal years are the company's own: Fiscal year ends Sep 30 (runs October to September). Net income is the share belonging to the company's owners.
Learn: Fiscal years that don't end in December: Nvidia's FY2027 explained · Stock-based compensation and dilution: pay that becomes shares
Sources (10)
07Who runs it
Who runs Emerson, and did they deliver?
Lal Karsanbhai
President and Chief Executive Officer · since 2021
CEO since February 2021 and President since March 2021; earlier ran Automation Solutions.
Ram Krishnan
Executive Vice President and Chief Operating Officer · since 2021
Executive officer since 2021.
Michael Baughman
Executive Vice President, Chief Financial Officer and Chief Accounting Officer · since 2023
Chief Financial Officer since May 2023 and Chief Accounting Officer since February 2018.
Michael Tang
Senior Vice President, Secretary and Chief Legal Officer · since 2024
Executive officer since 2024.
Rudy Sengupta
Senior Vice President, Chief Technology and AI Officer · since 2026
Executive officer since 2026.
Sabyasachi Mitra
Group President, Systems & Software · since 2021
Group President, Systems & Software since January 2021; executive officer since 2026.
James S. Turley
Independent Board Chair
Retired Chair and CEO of Ernst & Young.
What they said, and what happened
2 delivered · 1 too early to tell
Said on Nov 5, 2025
Emerson said in its Nov 5, 2025 release that it expected FY2026 adjusted EPS of $6.35 to $6.55.
DeliveredWhat happened
FY2026 adjusted EPS was $6.59. Emerson raised the range on Feb 3, 2026 and May 5, 2026, and to about $6.55 on Aug 4, 2026.
Said on Nov 5, 2025
Emerson said in its Nov 5, 2025 release that it expected FY2026 free cash flowCash from operations minus spending on buildings and equipment. Learn more of $3.5 billion to $3.6 billion.
DeliveredWhat happened
FY2026 free cash flow was $3,535 million, as stated in the Q4 FY2026 release.
Said on Nov 4, 2026
Emerson said in its Nov 4, 2026 release that it plans to return about $3.8 billion to shareholders in FY2027: about $2.5 billion of buybacks and about $1.3 billion of dividends.
Too early to tellWhat happened
Not yet reported.
08What could go wrong
What could go wrong for Emerson?
- Demand
Middle East conflict
Emerson said the conflict in the Middle East affected sales in Q2 FY2026. Its FY2027 outlook assumes the conflict stays contained within the region.
Watch Underlying sales growth in Asia, Middle East & Africa (+3% in FY2026)
- Execution
Acquisitions must earn back their price
Emerson paid an equity value of $8.2 billion for NI and about $7.2 billion for the rest of AspenTech. Goodwill was $18,104 million on Sep 30, 2026; the 10-K names impairment charges as a possible effect of weaker markets.
Watch Test & Measurement segment earnings ($47 million in FY2026)
- Debt
More debt since FY2024
Total debt was $12,175 million on Sep 30, 2026, against $7,687 million two years earlier. The 10-K lists access to capital markets as a risk to its business plan.
Watch Total debt to total capital (37.0% in FY2026)
- Demand
China sales have fallen
Sales to China were $1,773 million in FY2026, down from $1,829 million in FY2025 and $1,901 million in FY2024.
Watch China sales in the FY2027 10-K
- Regulation
Tariffs and trade rules
Most of its production sites are outside the US, and the 10-K names tariffs and trade barriers as a risk. In Feb 2026 the US Supreme Court ruled that IEEPA does not authorize tariffs. Emerson recorded $121 million of tariff refunds in FY2026.
Watch Tariff costs and refunds in the quarterly results
- Technology
Cyber attacks and product failures
The 10-K says its systems may be open to cyber attacks that go undetected for a long time. It also says a major failure of its specialized products could harm its business and reputation.
Watch Any cybersecurity incident reported in an 8-K
- Legal
Lawsuits, including asbestos claims
The 10-K says Emerson faces product liability claims, including asbestos claims, several of which seek substantial damages. It says it knew of no contingent liabilities likely to be material on Sep 30, 2026.
Watch Legal accruals and contingencies in each 10-K and 10-Q
09Supporters vs. critics
What do supporters and critics point to?
What supporters point to
- Net sales rose every year, from $13,804 million in FY2022 to $18,982 million in FY2026.
- Segment earnings per $100 of sales rose from $17.66 in FY2024 to $21.83 in FY2026 (Cityfort calculation from the FY2026 10-K).
- Backlog was $9,593 million on Sep 30, 2026, up from $8,629 million a year earlier (FY2026 10-K), and underlying orders (excluding AspenTech) rose 9% in FY2026, the Nov 4, 2026 release says.
- Free cash flow was $3,535 million in FY2026, and FY2026 adjusted EPS of $6.59 was above the $6.35 to $6.55 range Emerson gave on Nov 5, 2025.
- On Nov 4, 2026 Emerson raised its quarterly dividend 7% to $0.595 a share.
What critics point to
- Total debt was $12,175 million on Sep 30, 2026, against $7,687 million on Sep 30, 2024; net debt of $10,369 million was about 2.6 years of FY2026 operating cash flow (Cityfort calculation from the FY2026 10-K).
- Goodwill and other intangible assets were 63% of total assets on Sep 30, 2026 (Cityfort calculation from the FY2026 10-K).
- Test & Measurement, built on NI (bought for an equity value of $8.2 billion), made $47 million of segment earnings on $1,732 million of FY2026 sales.
- Sales to China fell from $1,901 million in FY2024 to $1,773 million in FY2026.
- Emerson's FY2026 10-K (filed Nov 9, 2026) expects about 70% of its Sep 30, 2026 backlog to become sales within 12 months, against about 75% in its FY2025 10-K.
10What to watch next
What should you watch next at Emerson?
Next event
Q1 FY2027 results
Date not announced yet.
FY2027 outlook against results
Management said in its Nov 4, 2026 earnings release that it expects FY2027 net sales growth of about 5% and GAAP EPS of about $5.70. FY2026 GAAP EPS was $4.79.
Backlog turning into sales
Backlog was $9,593 million on Sep 30, 2026. Emerson's FY2026 10-K expects about 70% of it to become sales within 12 months.
Middle East conflict
The Nov 4, 2026 release says the FY2027 outlook assumes the conflict stays contained within the region. Underlying sales in Asia, Middle East & Africa grew 3% in FY2026.
Buybacks and debt
Emerson said on Nov 4, 2026 that it plans about $2.5 billion of buybacks in FY2027. Total debt was $12,175 million on Sep 30, 2026, and it agreed on Nov 10, 2026 to sell €750 million of 4.000% notes due 2032 (8-K filed Nov 12, 2026).
11Key dates
What are the key dates for Emerson?
| Event | Date | Source |
|---|---|---|
| Quarterly dividend of $0.595 a share paidFor shareholders of record on Nov 13, 2026. | Q4 FY2026 earnings release (8-K Ex. 99.1) | |
| 2027 annual meeting of shareholdersDate given in the 2026 proxy statement. | 2026 proxy statement (DEF 14A) | |
| Fiscal 2027 ends | Form 10-K for FY2026 |
Learn: How to read a proxy statement (DEF 14A): Nvidia's 2026 proxy · Fiscal years that don't end in December: Nvidia's FY2027 explained
12Key facts
Key facts about Emerson
- What does Emerson Electric do?
- Emerson Electric sells sensors, valves, control systems, software and test equipment that run and test plants and factories, plus tools for tradespeople. Its net sales were $18,982 million in FY2026, the year ended Sep 30, 2026.
- How does Emerson Electric make money?
- Most of Emerson Electric's segment earnings come from sensors and valves: its Sensors and Final Control segments made $2,643 million on $10,496 million of FY2026 sales. Final Control, at $6,194 million of FY2026 sales, is its largest segment.
- Who are Emerson Electric's customers?
- Emerson Electric sells to power, chemical and energy companies, to life sciences, mining, food and paper producers, to chip, car and aerospace makers, and to tradespeople. Its FY2026 10-K names no customer and gives no share of sales for its largest customers.
- Where does Emerson Electric sell?
- In FY2026 the Americas made up 51.5% of Emerson Electric's net sales, Asia, Middle East & Africa 29.8% and Europe 18.7%. Its sales to China were $1,773 million in FY2026.
- How big is Emerson Electric?
- Emerson Electric had net sales of $18,982 million and net income of $2,691 million in FY2026, up from $18,016 million and $2,270 million in FY2025. It had about 70,000 employees on Sep 30, 2026.
- How much debt does Emerson Electric have?
- Emerson Electric had total debt of $12,175 million and cash of $1,806 million on Sep 30, 2026, against total debt of $7,687 million on Sep 30, 2024.
- Does Emerson Electric pay a dividend?
- Emerson Electric paid dividends of $2.22 a share in FY2026, a total of $1,244 million, and bought back $1,000 million of its shares. On Nov 4, 2026 it raised its quarterly dividend to $0.595 a share.
- Who owns Emerson Electric?
- Emerson Electric's directors and executive officers held 1,297,097 shares as a group on Sep 30, 2025, about 0.23% (Cityfort calculation from the 2026 proxy statementThe yearly filing about shareholder votes, the board and executive pay. Learn more). The 2026 proxy lists The Vanguard Group at 9.2% and BlackRock at 6.5%, from their filings of early 2024.
Terms on this page
- Capital expenditures (capex)
- Debt-to-equity
- Earnings per share (EPS)
- EBITDA
- Free cash flow
- Net debt
- Net margin
- Revenue vs net income
Each explains the term in plain English, with the same number from other companies on Cityfort.
Go deeper
More detail from the same filings. Open any section.
13What it sells
13What it sells
What does Emerson sell?
Control systems and software
DeltaV and Ovation control systems run whole plants; AspenTech software helps design and tune them. FY2026 sales were $4,580 million.
Test and measurement systems
NI-brand test hardware and software that companies use to test products before launch. FY2026 sales were $1,732 million.
Sensors
Rosemount and Micro Motion instruments that measure what is happening inside pipes and tanks. FY2026 sales were $4,302 million.
Valves and actuators
Fisher, ASCO and Bettis valves, regulators and actuators that control the flow of liquids and gases. FY2026 sales were $6,194 million, the largest segment.
Tools for tradespeople
Tools and equipment for mechanical, electrical and plumbing professionals, sold by the Safety & Productivity segment. FY2026 sales were $2,174 million.
Think of it like this
A plant is like a body: Emerson sells the nerves (sensors), the muscles (valves) and the brain (control systems).
What it does
- Does: Sells to process industries such as power, chemicals and energy
- Does: Sells to hybrid industries such as life sciences, mining, food and paper
- Does: Sells to discrete makers such as chipmakers, carmakers and aerospace firms
- Does: Sells mainly through its own sales force, plus independent representatives and distributors
What it does not do
- Does not: No longer owns its former Climate Technologies business (now Copeland): it sold a majority stake in May 2023 and its last 40% in August 2024
- Does not: Does not report any single customer or a share of sales for its largest customers
Sources (1)
14How the money flows
14How the money flows · FY2026
How does money flow through Emerson?
Money in
- Net sales$19.0B
The company
Emerson
$19.0B came in
Money out
- Cost of sales$8.9B
- Selling, general and administrative$5.3B
- Other deductions (mostly amortization of acquired intangibles and restructuring)$1.0B
- Interest expense, net$334M
- Income taxes$796M
- Share of profit owed to minority holders$2M
- Net income to Emerson stockholders$2.7B
- Customers paid Emerson $18,982 million for products, systems and software in FY2026.
- Making and buying what it sold cost $8,854 million, leaving a gross profit of $10,128 million.
- Selling and running the company took $5,296 million; other deductions, mostly amortization of acquired intangibles ($816 million) and restructuring ($187 million), took $1,009 million.
- Net interest took $334 million and income taxes $796 million.
- $2,691 million was left as net income for Emerson stockholders.
Sources (1)
15What it needs to run
15What it needs to run
What does Emerson need to run?
Raw materials
Steel, cast iron, electronics, rare earth metals, aluminum and brass. The 10-K says Emerson seeks many suppliers for each to avoid relying on a few.
Factories around the world
Most of its production sites are outside the US. Property, plant and equipment was $2,859 million on Sep 30, 2026: $1,685 million in the Americas, $598 million in Asia, Middle East & Africa and $576 million in Europe.
Engineers and new products
Spending on research, development and engineering, including work paid for by customers, was 8.3% of sales in FY2026. Research and development expense alone was $812 million.
People
About 70,000 employees on Sep 30, 2026.
Sources (1)
16Where it sells
16Where it sells · FY2026
Where does Emerson sell?
- Americas51.5%
- Asia, Middle East & Africa29.8%
- Europe18.7%
Sources (1)
17Where growth could come from
17Where growth could come from
Where could Emerson's growth come from?
Management said in its Nov 4, 2026 earnings release that it expects FY2027 net sales growth of about 5%, GAAP EPS of about $5.70 and adjusted EPS of about $7.25, with operating cash flow of $4.3 billion to $4.4 billion. The release says the outlook assumes the Middle East conflict stays contained within the region.
Orders
WorkingUnderlying orders +9% in FY2026
Underlying orders, Emerson's own measure that leaves out AspenTech, rose 14% in Q4 FY2026 and 9% for the year, the Nov 4, 2026 release says.
Status: Working, on track against what the company said.
Software & Systems
WorkingUnderlying sales +7% in FY2026
Sales of the Software & Systems group reached $6,312 million in FY2026, up from $5,819 million; its segment earnings rose to $1,085 million from $835 million.
Status: Working, on track against what the company said.
Test & Measurement (NI)
WorkingSales +17% in FY2026
Sales rose to $1,732 million from $1,485 million, and segment earnings turned to $47 million from a $68 million loss.
Status: Working, on track against what the company said.
Backlog
Working$9,593 million on Sep 30, 2026
Backlog rose from $8,629 million a year earlier. In its FY2026 10-K (filed Nov 9, 2026) Emerson expects about 70% to become sales within 12 months, against about 75% in its FY2025 10-K.
Status: Working, on track against what the company said.
Asia, Middle East & Africa
MixedUnderlying sales +3% in FY2026
Underlying sales grew 7% in the Americas and fell 1% in Europe. Emerson said the Middle East conflict affected sales in Q2 FY2026.
Status: Mixed, partly on track.
Status compares progress with what the company itself said it would do: Working = on track against what the company said; Mixed = partly on track; Behind = behind the company's own plan; New = recently announced; Early = too early to judge.
18The company's own measures (non-GAAP)
18The company's own measures · FY2026
What do Emerson's own measures show?
Official (GAAP): Diluted EPS, FY2026
$4.79
Company's own measure: Adjusted EPS, FY2026
$6.59
Emerson leaves out amortization of acquired intangibles ($1.38 a share), restructuring ($0.36) and acquisition fees ($0.14), and takes out tariff refunds net of a charitable trust contribution ($0.12). Adjusted EPS was $6.01 in FY2025.
Official (GAAP): Pretax earnings, FY2026
$3.5B
Company's own measure: Adjusted EBITA, FY2026
$5.1B
Emerson defines it as earnings before net interest, related-party interest income, income taxes, amortization of intangibles and some other items such as restructuring. It was 26.6% of sales, against 26.1% in FY2025.
Official (GAAP): Operating cash flow, FY2026
$4.0B
Company's own measure: Free cash flow, FY2026
$3.5B
Emerson subtracts capital spending ($443 million) from operating cash flow of continuing operations. It was 18.6% of sales, against 18.0% in FY2025.
Official (GAAP): Net sales growth, FY2026
5.0%
Company's own measure: Underlying sales growth, FY2026
4%
Underlying growth leaves out acquisitions, divestitures and currency moves. Prices added about 3 points and volume about 1 point.
These are the company's own measures, defined by the company. They are not comparable across companies, and they are not added together. Each sits beside the nearest official (GAAP) figure.
Learn: Non-GAAP measures: what a company's "adjusted" numbers leave out
19Financial strength and debt
19Financial strength · Sep 30, 2026
How much debt does Emerson have?
- Total debt$12.2B
- Cash and investments$1.8B
- Net debt (debt minus cash)$10.4B
- Net worth (shareholders' money)$20.7B
- Debt to equity
- 0.59×
- $ of debt for every $1 of shareholders' money
- Total debt of $12,175 million is short-term borrowings and current maturities ($4,667 million) plus long-term debt ($7,508 million); net debt subtracts $1,806 million of cash (Cityfort calculation from the FY2026 10-K).
- In FY2025 Emerson paid $7,244 million for the AspenTech shares it did not own; total debt was $7,687 million on Sep 30, 2024 and $13,116 million on Sep 30, 2025.
- The FY2026 10-K puts total debt at 37.0% of total capital and interest coverage at 9.0 times for FY2026.
- Goodwill ($18,104 million) and other intangible assets ($8,442 million) were 63% of total assets of $41,814 million on Sep 30, 2026 (Cityfort calculation from the FY2026 10-K).
- A $2 billion 364-day backup credit facility signed Feb 10, 2026 replaced a $3 billion facility; Emerson also has a $3.5 billion five-year facility. On Nov 12, 2026 it sold €750 million of 4.000% notes due 2032.
- From FY2026 Emerson counts pension and retiree-benefit gains and losses each year at market value (mark-to-market) and recast FY2024 and FY2025 the same way; the FY2022 and FY2023 figures on this page use the old method.
20Who owns it
20Who owns it · ownership as of Sep 30, 2025
Who owns Emerson?
- Officers and directors (as a group), shares
- 0.2%
Share classes
Holders of 5% or more
From the company's proxy statement (DEF 14A), later Schedule 13G filings and the share counts on its latest annual or quarterly report. Each holder row shows the date of its own filing.
Learn: How to read a proxy statement (DEF 14A): Nvidia's 2026 proxy · Form 4 insider filings: who files, the codes and the footnotes
21What it does with profit
21What it does with profit
What does Emerson do with its profit?
Dividend per share
$2.22FY2026
Dividend paid for each share, by financial year.
$ per share
See the numbers
No buybacks or fund raises in the period covered.
Sources (1)
22Governance signals
22Governance signals
What do Emerson's governance filings show?
- Auditor
- KPMG LLP, since 1938
- Auditor changes
- None in the period covered
- Audit qualifications
- None reported
- Related-party dealings
- The FY2026 10-K reports interest income from a related party only in FY2024 ($86 million, on Emerson's note receivable from Copeland, which it sold in August 2024); none in FY2025 or FY2026.
- Credit rating
- No public credit rating found in a search of rating agency sites on Nov 20, 2026
Flags to know about
other
Classified board
Directors serve staggered three-year terms. The 2026 proxy statement included a management proposal to declassify the board.
23How it got here
23How it got here
How did Emerson get here?
1890
Milestone
Incorporated in Missouri
Emerson grew through its own businesses and through acquisitions, the 10-K says.
2023
Business-model change
Sold most of Climate Technologies
On May 31, 2023 Emerson sold a majority stake to Blackstone funds and kept 40% of the new company, Copeland.
2023
Milestone
Bought National Instruments (NI)
Completed on Oct 11, 2023 at an equity value of $8.2 billion; NI is now the Test & Measurement segment.
2024
Business-model change
Left Copeland
In August 2024 Emerson sold its 40% stake for $1.5 billion and its note receivable from Copeland for $1.9 billion.
2025
Milestone
Took full ownership of AspenTech
On Mar 12, 2025 Emerson bought the AspenTech shares it did not own for about $7.2 billion.
2026
Milestone
Five segments
From FY2026 Emerson reports five segments in three groups and recast earlier years; Discrete Automation is no longer a segment.
2026
Milestone
New pension accounting
On Oct 13, 2026 Emerson said it would count pension gains and losses at market valueShare price × number of shares: what all the shares were worth at one dated price. Learn more each year, and recast its earlier results.
24Sources and changes
Where every number on this page comes from
Sources (18 documents)
- S1Form 10-K for FY2026 · SEC EDGAR · Tier 1: company or exchange filing · Nov 9, 2026
- S5Form 10-K for FY2025 · SEC EDGAR · Tier 1: company or exchange filing · Nov 10, 2025
- S9Form 10-K for FY2024 · SEC EDGAR · Tier 1: company or exchange filing · Nov 12, 2024
- S10Form 10-Q for Q3 FY2024 · SEC EDGAR · Tier 1: company or exchange filing · Aug 7, 2024
- S11Form 10-Q for Q2 FY2024 · SEC EDGAR · Tier 1: company or exchange filing · May 8, 2024
- S12Form 10-Q for Q1 FY2024 · SEC EDGAR · Tier 1: company or exchange filing · Feb 7, 2024
- S13Form 10-K for FY2023 · SEC EDGAR · Tier 1: company or exchange filing · Nov 13, 2023
- S14Form 10-K for FY2022 · SEC EDGAR · Tier 1: company or exchange filing · Nov 14, 2022
- S15Q4 FY2026 earnings release (8-K Ex. 99.1) · SEC EDGAR · Tier 1: company or exchange filing · Nov 4, 2026
- S16Q3 FY2026 earnings release (8-K Ex. 99.1) · SEC EDGAR · Tier 1: company or exchange filing · Aug 4, 2026
- S17Q2 FY2026 earnings release (8-K Ex. 99.1) · SEC EDGAR · Tier 1: company or exchange filing · May 5, 2026
- S18Q1 FY2026 earnings release (8-K Ex. 99.1) · SEC EDGAR · Tier 1: company or exchange filing · Feb 3, 2026
- S19Q4 FY2025 earnings release (8-K Ex. 99.1) · SEC EDGAR · Tier 1: company or exchange filing · Nov 5, 2025
- S202026 proxy statement (DEF 14A) · SEC EDGAR · Tier 1: company or exchange filing · Dec 12, 2025
- S218-K filed Oct 13, 2026: pension accounting change and recast results (Ex. 99.1) · SEC EDGAR · Tier 1: company or exchange filing · Oct 13, 2026
- S228-K filed Feb 13, 2026: 364-day credit facility · SEC EDGAR · Tier 1: company or exchange filing · Feb 13, 2026
- S238-K filed Mar 10, 2025: AspenTech merger agreement · SEC EDGAR · Tier 1: company or exchange filing · Mar 10, 2025
- S248-K filed Nov 12, 2026: euro notes offering · SEC EDGAR · Tier 1: company or exchange filing · Nov 12, 2026
Changes to this page (v1 · Nov 20, 2026)
- v1 · Nov 20, 2026First version. (first version)
Numbers come only from tier 1 and tier 2 sources. Read how we research.
Disclaimer
For learning only. Cityfort is not a registered investment adviser or broker-dealer and does not recommend buying or selling any security. Prices shown are dated and may be out of date.
Investing in securities involves risk, including loss of capital. Before making any investment decision, do your own research and consider consulting a registered investment adviser or other qualified professional.
Cityfort, its owners and contributors may or may not hold securities of companies covered. Cityfort is not paid by any company it covers. Content is not an offer or solicitation to buy or sell any security, including in any initial public offering.
Read the positions policyRead the full disclaimerHide the full disclaimer
Cityfort publishes general educational content that explains how listed companies work. Cityfort is not registered with the US Securities and Exchange Commission or any state securities regulator as an investment adviser, and is not a broker-dealer or a member of FINRA. Cityfort does not provide investment, tax or legal advice, recommendations, ratings, price targets or any opinion on whether to buy, sell or hold any security. Nothing on the site is tailored to any person's circumstances.
All information is taken from publicly available sources, mainly company filings with the SEC, which are listed on each page with dates. We work to keep it accurate and correct errors publicly, but we do not guarantee that it is complete, accurate or up to date. Any market price or price-based ratio shown is dated, may be out of date by the time you read it, and is included only to explain concepts.
Statements by company management, including forward-looking statements and guidance, are reported as the company's statements, with their date and source; they are not our forecasts. Adjusted (non-GAAP) figures are the company's own measures and are shown next to the official (GAAP) figures.