Industrials · NASDAQ: FAST
Fastenal: how the business works
Fastenal sells bolts, gloves, tools and other supplies that factories and builders use up, with net sales of $8.2 billion in FY2025.
By Hardik Bhandare · Checked against filings: . Editorial policy. Corrections
Follow Fastenal
Email me when Fastenal's page is updated after earnings.
We'll send a confirmation email first. See our privacy policy.
Fastenal Company · Winona, Minnesota · Founded 1967
Updated for Q3 FY2026 · checked
- Net sales, FY2025
- $8.2B
- Net income, FY2025
- $1.26B
- Branch locations, end of 2025
- 1,595
- Employees, Dec 31, 2025
- 24,489
- Business began
- 1967
The short version
Fastenal in 5 points
1 · What it sells
Fastenal sells bolts, gloves, tools and other supplies that factories and builders use up, through 1,595 branches and bins and vending devices in customer plants, with net sales of $8,200.5 million in FY2025.
2 · Who pays it
In FY2025, manufacturers paid 75.9% of Fastenal's net sales, non-residential construction 8.1% and other customers such as resellers, transport firms and government bodies 16%.
3 · What it keeps from $100
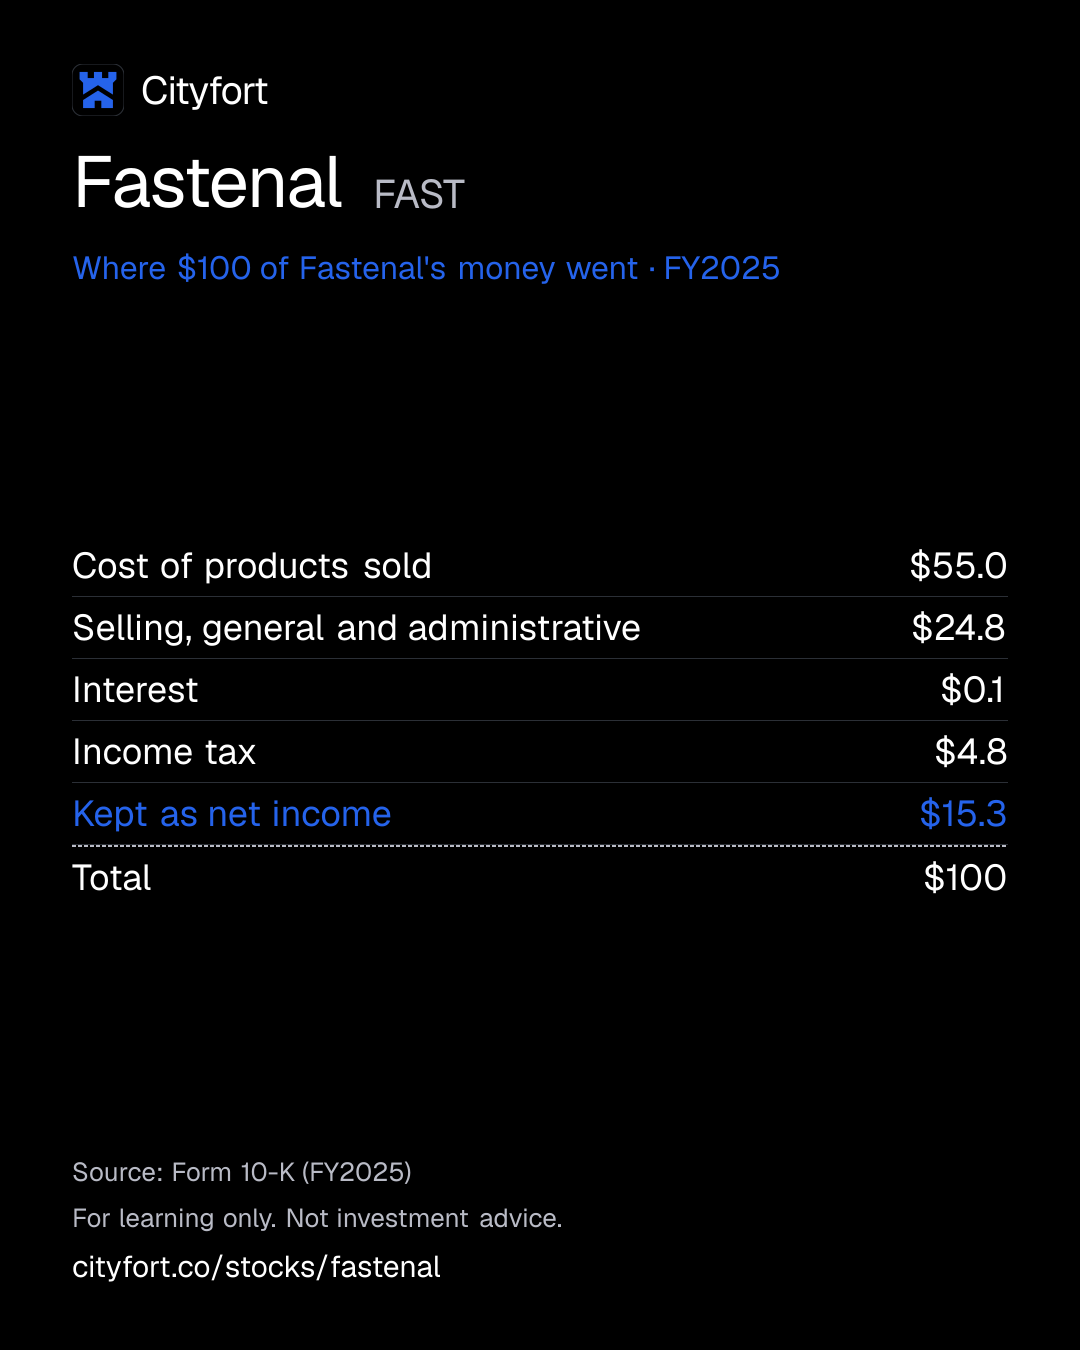
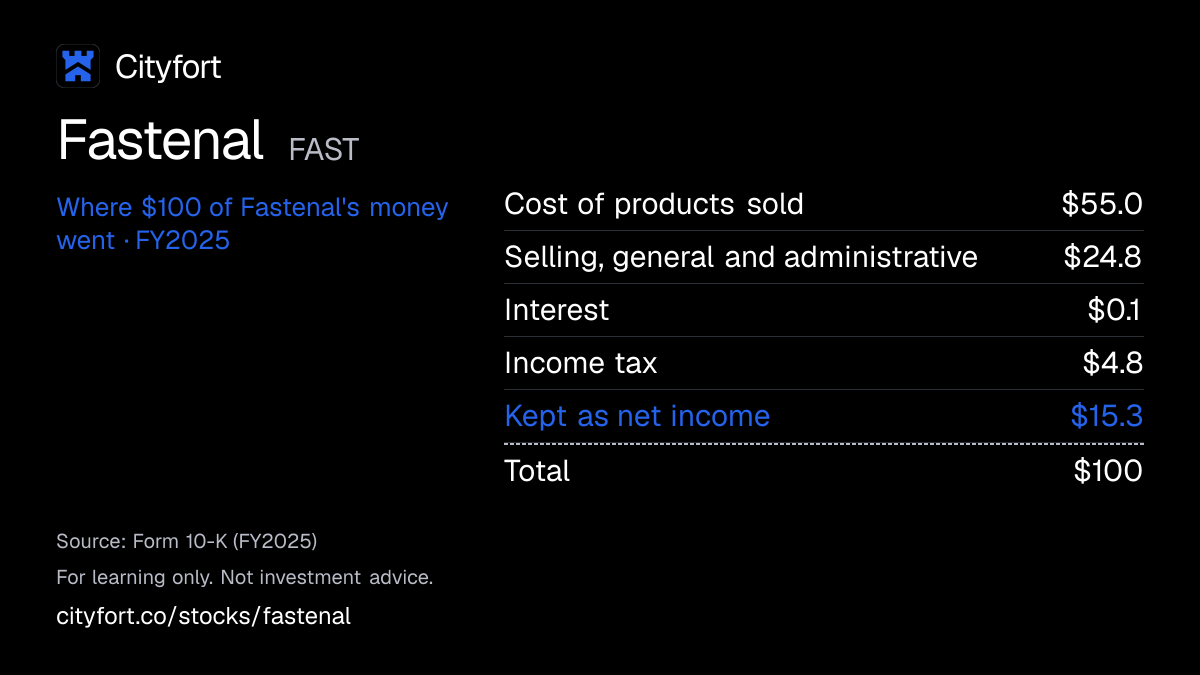
Of every $100 that came in during FY2025, Fastenal kept $15.34 as net income; the only income besides sales was $5.5 million of interest, and $20.2 of each $100 of sales was left after all operating costs.
4 · Where the operating profit comes from
The United States segment, 83.2% of FY2025 net sales, made $1,432.5 million of pre-tax profit on Fastenal's segment measure in FY2025; Canada and Mexico added $1,110.2 million of sales.
5 · The one thing to watch
Fastenal's gross margin was 44.8% in Q3 FY2026, against 45.3% a year earlier, while daily sales rose to $38.5 million from $33.3 million.
Sources: From Fastenal's FY2025 10-K, the Q3 FY2026 10-Q and the Q3 FY2026 earnings release · checked
01Where the money goes · FY2025
Where does $100 of Fastenal's money go?
Fastenal · FY2025
Receipt for every $100
| Cost of products sold | $55.0 |
|---|---|
| Selling, general and administrative | $24.8 |
| Interest | $0.1 |
| Income tax | $4.8 |
| Kept as net income | $15.3 |
| Total | $100 |
Each line = amount ÷ total money in × 100. Lines may not add to exactly $100 because of rounding.
How this is worked out
Cityfort calculation from FY2025 10-K. Of every $100 that came in during FY2025: each line = line ÷ $8,206.0 million × 100 (net sales $8,200.5 million + interest income $5.5 million).
Save this receipt as an image
Embed this receipt or the key numbers
Paste this code into a blog or website to show the card you choose, with a link back to this page.
Each week: the next company due to report earnings, explained in 5 points.
No tips. Unsubscribe anytime.
We'll send a confirmation email. See our privacy policy.
02The business in one line
What does Fastenal do?
Factories and builders pay Fastenal to keep the parts and supplies they use up close at hand; about $55 of every $100 is spent buying those products, and $15.34 is left as net income.
- Manufacturers paid 75.9% of Fastenal's FY2025 net sales. No single customer reached 5% of sales in 2025, 2024 or 2023.
- About 96% of FY2025 sales were products made by other companies. Fastenal stocks them in branches and in bins and vending devices inside customer plants.
03Who pays it
Who pays Fastenal?
Manufacturers
75.9%
of revenue
Factories in heavy and other manufacturing buy parts, safety gear and tools for their lines. 76.6% of sales in Q3 FY2026.
Non-residential construction
8.1%
of revenue
Builders of offices, plants and other non-housing projects.
Other customers
16%
of revenue
Resellers, transportation firms, mining and oil companies, government bodies, schools, warehouses and data centers.
- Manufacturers75.9%
- Non-residential construction8.1%
- Other customers16%
How spread out the customers are
No customer was 5% or more of net sales in 2025, 2024 or 2023. About 74% of 2025 sales came from customers with a contract, and national accounts were 65%.
04How it makes money
How does Fastenal make money?
It buys parts in bulk and sells them in small amounts where they are used, keeping about $45 of each $100 after product costs.
In FY2025 Fastenal kept $45.0 of each $100 of sales after product costs, and $20.2 after all operating costs. Gross profit per $100 of sales fell from $46.2 in FY2021. The 10-K says contract customers and non-fastener products carry lower gross margins.
Gross profit per $100 of sales
$46.2$45.0
FY2021 to FY2025
- Win a factory or contract customer
- Put stock on site in bins, vending devices or shelves
- The customer uses parts and Fastenal refills them
- More sales spread the cost of branches and hubs
- Cash pays dividends and buys more devices
↺ Step 5 feeds back into step 1.
05Business segments · FY2025
Which businesses make up Fastenal?
United States
83.2%The only reportable segment. Its pre-tax profit on the company’s segment measure was $1,432.5 million in FY2025.
Revenue $6.8B ($6,819M)
Other regions
16.8%Canada and Mexico ($1,110.2 million) plus all other countries ($271.4 million); each region is an operating segment too small to report alone, and the FY2025 10-K reports them together as other operating segment net sales. The FY2021 figure of $977.6 million is Canada and Mexico ($749.0 million) plus all other countries ($228.6 million), a Cityfort calculation from FY2023 10-K.
Revenue $1.4B ($1,382M)
How the mix changed
- United States
- Other regions
Revenue by segment, FY2021 to FY2025.
US$
See the numbers
06The numbers · Consolidated · US$
How has Fastenal done?
Revenue
$8.2BFY2025
Net sales grew every year, from $6,010.9 million in FY2021 to $8,200.5 million in FY2025.
US$
See the numbers
Net income
$1.3BFY2025
Net income rose from $925.0 million in FY2021 to $1,258.4 million in FY2025, with a dip to $1,150.6 million in FY2024 from $1,155.0 million in FY2023. EPS for FY2021, FY2022 and Q1 FY2024 is split-adjusted, Cityfort calculation (net income ÷ diluted shares as filed × 2, for the 2-for-1 stock split of May 2025) from the FY2021 and FY2022 10-Ks and the Q1 FY2024 10-Q.
US$
See the numbers
Net income for every $100 of revenue
$15.3FY2025
Net income per $100 of sales stayed between $15.2 and $15.7 in every year from FY2021 to FY2025.
Net margin: $ of net income per $100 of revenue
See the numbers
Free cash flow
$1.1BFY2025
Free cash flow (cash left after running and investing in the business) was $1,050.6 million in FY2025, up from $613.5 million in FY2021, after $245.3 million of capital spending.
US$ · cash from operations minus spending on plants and equipment
See the numbers
See all yearly numbers
EBITDA here = operating income plus depreciation and amortization (from the cash flow statement). Fiscal years are the company's own: Fiscal year ends Dec 31. Net income is the share belonging to the company's owners.
Learn: Fiscal years that don't end in December: Nvidia's FY2027 explained · Stock-based compensation and dilution: pay that becomes shares
Sources (22)
- Form 10-K for FY2021
- Form 10-K for FY2022
- Form 10-K for FY2023
- Form 10-K for FY2025
- Form 10-K for FY2024
- Form 10-Q for Q1 FY2024
- Q1 FY2025 earnings release (8-K Ex. 99.1)
- Form 10-Q for Q2 FY2024
- Form 10-Q for Q2 FY2025
- Q2 FY2025 earnings release (8-K Ex. 99.1)
- Form 10-Q for Q3 FY2024
- Form 10-Q for Q3 FY2025
- Q3 FY2025 earnings release (8-K Ex. 99.1)
- Q4 FY2025 earnings release (8-K Ex. 99.1)
- Q4 FY2024 earnings release (8-K Ex. 99.1)
- Form 10-Q for Q1 FY2025
- Form 10-Q for Q1 FY2026
- Q1 FY2026 earnings release (8-K Ex. 99.1)
- Form 10-Q for Q2 FY2026
- Q2 FY2026 earnings release (8-K Ex. 99.1)
- Form 10-Q for Q3 FY2026
- Q3 FY2026 earnings release (8-K Ex. 99.1)
07Who runs it
Who runs Fastenal, and did they deliver?
Jeffery M. Watts
Chief Executive Officer and President · since 2026
With Fastenal since 1996 and its president and chief sales officer before. The board named him CEO effective Jul 16, 2026, and said it intended to appoint him a director then.
Daniel L. Florness
Chief Executive Officer until Jul 16, 2026 · since 2016
CEO from January 2016 and CFO from 1996 to 2015. He announced on Dec 19, 2025 that he would step out of the CEO and director roles. His 2025 pay totaled $4,183,328, 88 times the median employee’s.
Max H. Tunnicliff
Senior Executive Vice President and Chief Financial Officer · since 2025
Joined in November 2025 from Beko Europe, where he was CFO; earlier at Whirlpool. The previous CFO, Holden Lewis, resigned effective Apr 16, 2025.
Sheryl A. Lisowski
Executive Vice President, Chief Accounting Officer and Treasurer · since 1994
With Fastenal since 1994; interim CFO from April to November 2025.
Scott A. Satterlee
Chair of the board · since 2021
An independent director, retired from C.H. Robinson. The 2026 proxy lists nine independent directors.
What they said, and what happened
1 missed · 1 delivered · 2 too early to tell
Said on Feb 6, 2025
Fastenal said it expected 66% to 68% of its sales to run through its Digital Footprint at some point during 2025.
MissedWhat happened
Digital Footprint reached 62.4% of sales in December 2025. The company linked the gap to lower volume through its FMI devices amid tariff disruption.
Said on Jul 14, 2025
Fastenal set a goal of 25,000 to 26,000 weighted FASTBin and FASTVend signings for 2025, cut from 28,000 to 30,000.
DeliveredWhat happened
It signed 25,892 in 2025.
Said on Jul 14, 2026
Fastenal set a goal of 27,000 to 29,000 weighted FASTBin and FASTVend signings for 2026, cut from 28,000 to 30,000.
Too early to tellWhat happened
It signed 21,428 in the first nine months of 2026.
Said on Oct 14, 2026
Fastenal said it expects 2026 net spending on property and equipment of $310 million to $330 million, up from $230.6 million in 2025.
Too early to tellWhat happened
Reasons it gave: replacing its Atlanta hub, IT projects delayed from 2025 and more trucking spend. Q3 FY2026 net spending was $71.8 million.
08What could go wrong
What could go wrong for Fastenal?
- Regulation
Tariffs and sourcing from Asia
Fasteners and private-label products come mostly from suppliers in Asia, mainly China and Taiwan. The Q3 FY2026 10-Q says tariff uncertainty remains after the Supreme Court struck down tariffs set under an emergency powers law (IEEPA) and new tariffs followed.
Watch Gross margin and tariff comments in each quarterly release.
- Pricing
Growth mix lowers gross margin
The 10-K says contract customers and non-fastener products carry lower gross margins. Gross margin was 45.0% in FY2025, against 46.2% in FY2021.
Watch Gross margin against the year-earlier quarter (44.8% in Q3 FY2026, 45.3% a year before).
- Demand
Factory demand
Manufacturing customers gave 76.6% of Q3 FY2026 sales. The 10-K notes the US manufacturing index (PMI) averaged 48.9 in 2025, below 50 in 10 of 12 months. A reading below 50 means factory activity shrank.
Watch Daily sales growth to heavy manufacturing (+20.2% in Q3 FY2026).
- Execution
Leadership change
The CEO changed on Jul 16, 2026, and the CFO changed in 2025. The 10-K lists the transition of key executives as a risk.
Watch Strategy or goal changes in the next releases and the 2027 proxy.
- Execution
Digital goals missed
Digital Footprint (sales through its in-plant devices plus online and electronic orders) reached 62.4% of sales in December 2025, short of the 66% to 68% goal. In its Q3 FY2026 investor presentation (Oct 14, 2026), the company put 2026 at 62% to 63%, against an original 66%.
Watch Digital Footprint share of sales each quarter (61.4% in Q3 FY2026).
- Concentration
Few equipment and product suppliers
One main supplier provides its vending equipment. The 10-K also notes consolidation among its suppliers, which could give them more bargaining power.
Watch Device signings and any change of equipment supplier in the 10-K.
09Supporters vs. critics
What do supporters and critics point to?
What supporters point to
- Net sales grew every year, from $6,010.9 million in FY2021 to $8,200.5 million in FY2025.
- Customers with contracts gave 76.5% of Q3 FY2026 sales, and their daily sales grew 18.8%, against 7.8% for other customers.
- Customer sites spending $50,000 or more a month rose to 3,288 in Q3 FY2026 from 2,771.
- No customer reached 5% of net sales in 2025, 2024 or 2023.
- Cash of $211.9 million was more than debt of $100.0 million on Sep 30, 2026.
What critics point to
- Gross margin was 45.0% in FY2025, against 46.2% in FY2021, and the 10-K says contract customers and non-fastener products carry lower gross margins.
- Digital Footprint reached 62.4% of sales in December 2025, short of the 66% to 68% goal the company set in February 2025.
- In July 2026 the company cut its 2026 goal for device signings to 27,000 to 29,000, from 28,000 to 30,000.
- Fasteners and private-label products come mostly from suppliers in Asia, and the Q3 FY2026 10-Q says tariff uncertainty remains.
- The CFO changed in 2025 and the CEO changed on Jul 16, 2026.
10What to watch next
What should you watch next at Fastenal?
Next event
Q4 FY2026 results
Date not announced yet.
Gross margin
Gross margin was 44.8% in Q3 FY2026, against 45.3% a year earlier. The 10-K links lower margins to contract customers and non-fastener products.
Device signings against the 2026 goal
Fastenal signed 21,428 weighted FASTBin and FASTVend devices in the first nine months of 2026. Its goal, cut on Jul 14, 2026, is 27,000 to 29,000 for the year.
Capital spending
In its Q3 FY2026 release (Oct 14, 2026), the company said it expects 2026 net spending on property and equipment of $310 million to $330 million, up from $230.6 million in 2025.
Tariffs and the new CEO
The Q3 FY2026 10-Q says tariff uncertainty remains. Jeffery Watts became CEO on Jul 16, 2026; any change of goals under him would appear in the quarterly releases and the 2027 proxy.
11Key dates
What are the key dates for Fastenal?
| Event | Date | Source |
|---|---|---|
| Q4 2026 dividend of $0.26 per share paid | Form 10-Q for Q3 FY2026 | |
| Fiscal 2026 ends | Form 10-K for FY2025 |
Learn: Fiscal years that don't end in December: Nvidia's FY2027 explained
12Key facts
Key facts about Fastenal
- What does Fastenal do?
- Fastenal Company, based in Winona, Minnesota, sells fasteners, safety gear, tools and other industrial and construction supplies. At the end of 2025 it had 1,595 branch locations in 25 countries.
- How does Fastenal make money?
- Fastenal mostly resells products made by other companies (about 96% of FY2025 sales). In FY2025 it kept $45.0 of each $100 of sales after product costs and $15.34 of every $100 that came in as net income (Cityfort calculation from the FY2025 10-K).
- Who are Fastenal's customers?
- Manufacturers paid 75.9% of Fastenal's FY2025 net sales and non-residential construction 8.1%. No Fastenal customer reached 5% of net sales in 2025, 2024 or 2023.
- How big is Fastenal?
- Fastenal had net sales of $8,200.5 million and net income of $1,258.4 million in FY2025, up from $7,546.0 million and $1,150.6 million in FY2024. It had 24,489 employees on Dec 31, 2025.
- How did Fastenal do in Q3 FY2026?
- Fastenal's net sales were $2,463.3 million in Q3 FY2026 (July to September 2026), up from $2,133.3 million a year earlier. Net income was $401.6 million, up from $335.5 million.
- How much of Fastenal's sales come through devices in customer plants?
- Fastenal's FMI sales, made through FASTStock shelves, FASTBin bins and FASTVend vending devices at customer sites, were $1,121.3 million in Q3 FY2026, or 44.8% of net sales.
- How much debt does Fastenal have?
- Fastenal had $100.0 million of debt and $211.9 million of cash on Sep 30, 2026, according to its Q3 FY2026 10-Q.
- Who owns Fastenal?
- Fastenal has one class of common stock with one vote per share. Its 2026 proxy says directors and officers owned under 1%, and quotes The Vanguard Group at 12.25% and BlackRock at 8.02% as of Dec 31, 2023.
Terms on this page
- Capital expenditures (capex)
- Debt-to-equity
- Earnings per share (EPS)
- EBITDA
- Free cash flow
- Net debt
- Net margin
- Revenue vs net income
- Stock buyback
Each explains the term in plain English, with the same number from other companies on Cityfort.
Go deeper
More detail from the same filings. Open any section.
13What it sells
13What it sells
What does Fastenal sell?
Fasteners
Bolts, nuts, screws and other hardware that hold things together. Its first product line (1967) and 30.5% of FY2025 sales.
Safety supplies
Gloves, glasses and other protective gear for workers. 22.2% of FY2025 sales.
Other supplies
Janitorial (9.0%), tools (8.3%), hydraulics and pneumatics (6.9%), material handling (5.7%), cutting tools (5.2%), electrical (4.7%) and welding (4.3%) items in FY2025.
FMI: stock inside the customer plant
FASTStock shelves, FASTBin smart bins and FASTVend vending devices that Fastenal places and refills at customer sites. 44.8% of Q3 FY2026 sales.
eBusiness
Orders placed through customers’ purchasing systems or Fastenal’s website. 28.8% of Q3 FY2026 sales.
Manufacturing and services
Nine manufacturing locations and industrial services that make, modify or repair parts. About 4% of FY2025 sales.
What it does
- Does: Resells products made by other companies: about 96% of FY2025 sales
- Does: Places and refills bins and vending devices inside customer plants
- Does: Runs 15 distribution centers in North America, plus two in Asia and two in Europe
What it does not do
- Does not: Does not rely on one customer: none reached 5% of sales in 2025, 2024 or 2023
- Does not: Is not the importer of record (the firm that clears goods through customs) for most products it sells, its Q3 FY2026 10-Q says
14How the money flows
14How the money flows · FY2025
How does money flow through Fastenal?
Money in
- Net sales$8.2B
- Interest income$5.5M
The company
Fastenal
$8.2B came in
Money out
- Cost of products sold$4.5B
- Selling, general and administrative$2.0B
- Interest$6.2M
- Income tax$397M
- Net income$1.3B
- Fastenal took in $8,200.5 million of net sales in FY2025, plus $5.5 million of interest income.
- Buying the products it resold cost $4,509.3 million, leaving $3,691.2 million of gross profit.
- Selling, general and administrative costs took $2,035.5 million.
- Interest of $6.2 million and income tax of $396.6 million left net income of $1,258.4 million.
Sources (1)
15What it needs to run
15What it needs to run
What does Fastenal need to run?
Suppliers in Asia
Its fasteners and private-label products come from many suppliers concentrated in Asia, mainly China and Taiwan. One supplier was above 5% of 2025 inventory purchases.
Vending equipment
One main supplier provides its industrial vending equipment, the FY2025 10-K says.
Inventory
$1,748.0 million of stock on Dec 31, 2025, and $1,776.6 million on Sep 30, 2026.
Salespeople near the customer
24,489 employees at the end of 2025, about 70% of them in selling roles.
Distribution centers
15 in North America (12 in the US, two in Canada, one in Mexico), plus two in Asia and two in Europe.
16Where it sells
16Where it sells · FY2025
Where does Fastenal sell?
- United States83.2%
- Canada and Mexico13.5%
- All other countries3.3%
Sources (1)
17Where growth could come from
17Where growth could come from
Where could Fastenal's growth come from?
Fastenal’s Q3 FY2026 earnings release gives no sales or earnings forecast. It sets a 2026 goal of 27,000 to 29,000 weighted FASTBin and FASTVend signings. The company says it expects 2026 net spending on property and equipment of $310 million to $330 million, up from $230.6 million in 2025.
Large customer sites
Working3,288 sites (Q3 FY2026), up from 2,771
The company says its strategy prioritizes sites with monthly sales potential of $50,000 or more. Their sales rose to $1,456.6 million in Q3 FY2026 from $1,141.9 million.
Status: Working, on track against what the company said.
Contract customers
Working76.5% of Q3 FY2026 sales
Contract customers’ daily sales grew 18.8% in Q3 FY2026, against 7.8% for other customers.
Status: Working, on track against what the company said.
Vending and bin devices
Mixed21,428 signed in 9 months of 2026
Signings rose from 19,925 a year earlier, but the company cut its 2026 goal from 28,000–30,000 to 27,000–29,000.
Status: Mixed, partly on track.
Digital Footprint
Behind61.4% of Q3 FY2026 sales
In its Q3 FY2026 investor presentation (Oct 14, 2026), the company put 2026 at 62% to 63% of sales, against its original 2026 estimate of 66%.
Status: Behind, behind the company's own plan.
Heavy manufacturing demand
Working+20.2% daily sales, Q3 FY2026
Heavy manufacturing was 44.6% of Q3 FY2026 sales, its largest end market.
Status: Working, on track against what the company said.
Status compares progress with what the company itself said it would do: Working = on track against what the company said; Mixed = partly on track; Behind = behind the company's own plan; New = recently announced; Early = too early to judge.
18The company's own measures (non-GAAP)
18The company's own measures · Q3 FY2026
What do Fastenal's own measures show?
Official (GAAP): Net sales, Q3 FY2026
$2.5B
Company's own measure: Daily sales, Q3 FY2026
$38.5M
Net sales divided by 64 US business days; $33.3 million a year earlier, also 64 days.
Official (GAAP): Net sales, Q3 FY2026
$2.5B
Company's own measure: FMI sales, Q3 FY2026
$1.1B
Sales through FASTStock, FASTBin and FASTVend at customer sites: 44.8% of sales.
Official (GAAP): Net sales, Q3 FY2026
$2.5B
Company's own measure: Digital Footprint sales, Q3 FY2026
$1.5B
FMI sales plus eBusiness sales that are not FMI billings: 61.4% of sales, against 61.3% a year earlier.
These are the company's own measures, defined by the company. They are not comparable across companies, and they are not added together. Each sits beside the nearest official (GAAP) figure.
Learn: Non-GAAP measures: what a company's "adjusted" numbers leave out
19Financial strength and debt
19Financial strength · Sep 30, 2026
How much debt does Fastenal have?
- Total debt$100M
- Cash and investments$212M
- Net cash (cash minus debt)$112M
- Net worth (shareholders' money)$4.1B
- Debt to equity
- 0.02×
- $ of debt for every $1 of shareholders' money
- Net cash of $111.9 million is cash of $211.9 million minus debt of $100.0 million (Cityfort calculation from the Q3 FY2026 10-Q).
- The debt is two unsecured notes: $50.0 million at 2.72% due May 15, 2027, and $50.0 million at 2.50% due Jun 24, 2030.
- An $835.0 million unsecured credit line, amended and restated on Jun 18, 2026 and now maturing Jun 18, 2031, had nothing drawn on Sep 30, 2026 (Q3 FY2026 10-Q).
- Lease liabilities of $316.9 million on Dec 31, 2025 are not counted as debt here.
20Who owns it
20Who owns it · ownership as of Feb 1, 2026
Who owns Fastenal?
- Officers and directors (as a group), shares
- 0.3%
Share classes
Holders of 5% or more
From the company's proxy statement (DEF 14A), later Schedule 13G filings and the share counts on its latest annual or quarterly report. Each holder row shows the date of its own filing.
Learn: How to read a proxy statement (DEF 14A): Nvidia's 2026 proxy · Form 4 insider filings: who files, the codes and the footnotes
21What it does with profit
21What it does with profit
What does Fastenal do with its profit?
Dividend per share
$0.88FY2025
Dividend paid for each share, by financial year.
$ per share
See the numbers
Buyback · Dec 31, 2022
5,000,000 shares bought in FY2022 (before the 2025 split).
$238M
Buyback · Sep 30, 2026
Buybacks in the first nine months of FY2026.
$80.8M
22Governance signals
22Governance signals
What do Fastenal's governance filings show?
- Auditor
- PricewaterhouseCoopers LLP, since 2025
- Auditor changes
- Feb 6, 2025: KPMG LLP → PricewaterhouseCoopers LLP (The audit committee decided on the change on Jul 19, 2024. The 2026 proxy says KPMG’s reports for 2023 and 2024 were unqualified, with no disagreements.)
- Audit qualifications
- None reported
- Related-party dealings
- The 2026 proxy says there were no related person transactions during 2025 that it was required to report.
- Credit rating
- No public credit rating found in a search of rating agency sites on Nov 20, 2026
Flags to know about
other · Jul 16, 2026
New CEO and new CFO within 15 months
The CFO resigned effective Apr 16, 2025, and a new CFO joined in November 2025. Jeffery Watts became CEO effective Jul 16, 2026.
23How it got here
23How it got here
How did Fastenal get here?
1967
Milestone
First branch in Winona
Fastenal began as a partnership with one branch in Winona, Minnesota, selling fasteners; it incorporated in 1968.
1992
Business-model change
First Onsite
Fastenal signed its first Onsite: staff and stock placed in or near a customer’s plant. The model grew slowly, as a local option.
1993
Business-model change
Beyond fasteners
Tools were added in 1993; cutting tools, hydraulics, material handling and janitorial in 1996; electrical and welding in 1997; safety in 1999.
2022
Milestone
Share buyback
Fastenal bought 5,000,000 shares for $237.8 million; it made no buybacks from 2023 to 2025.
2023
Milestone
Fifth dividend
It paid a supplemental fifth dividend in the fourth quarter of 2023.
2025
Milestone
Two-for-one stock split
Announced on Apr 23, 2025, the split doubled the share count; per-share figures since then are split-adjusted.
2025
Business-model change
Reporting by customer Sites
From 2025 Fastenal reports customer Sites instead of public branches and Onsites, and from Q4 2025 splits sales into direct and indirect materials.
2026
Milestone
New CEO
Jeffery Watts succeeded Daniel Florness as CEO on Jul 16, 2026; the CEO became the sole chief operating decision maker.
24Sources and changes
Where every number on this page comes from
Sources (24 documents)
- S1Form 10-Q for Q3 FY2026 · SEC EDGAR · Tier 1: company or exchange filing · Oct 19, 2026
- S2Form 10-Q for Q2 FY2026 · SEC EDGAR · Tier 1: company or exchange filing · Jul 16, 2026
- S3Form 10-Q for Q1 FY2026 · SEC EDGAR · Tier 1: company or exchange filing · Apr 16, 2026
- S4Form 10-K for FY2025 · SEC EDGAR · Tier 1: company or exchange filing · Feb 5, 2026
- S5Form 10-Q for Q3 FY2025 · SEC EDGAR · Tier 1: company or exchange filing · Oct 16, 2025
- S6Form 10-Q for Q2 FY2025 · SEC EDGAR · Tier 1: company or exchange filing · Jul 17, 2025
- S7Form 10-Q for Q1 FY2025 · SEC EDGAR · Tier 1: company or exchange filing · Apr 16, 2025
- S8Form 10-K for FY2024 · SEC EDGAR · Tier 1: company or exchange filing · Feb 6, 2025
- S9Form 10-Q for Q3 FY2024 · SEC EDGAR · Tier 1: company or exchange filing · Oct 16, 2024
- S10Form 10-Q for Q2 FY2024 · SEC EDGAR · Tier 1: company or exchange filing · Jul 17, 2024
- S11Form 10-Q for Q1 FY2024 · SEC EDGAR · Tier 1: company or exchange filing · Apr 16, 2024
- S12Form 10-K for FY2023 · SEC EDGAR · Tier 1: company or exchange filing · Feb 6, 2024
- S13Form 10-K for FY2022 · SEC EDGAR · Tier 1: company or exchange filing · Feb 7, 2023
- S14Form 10-K for FY2021 · SEC EDGAR · Tier 1: company or exchange filing · Feb 7, 2022
- S152026 proxy statement (DEF 14A) · SEC EDGAR · Tier 1: company or exchange filing · Feb 25, 2026
- S16Q3 FY2026 earnings release (8-K Ex. 99.1) · SEC EDGAR · Tier 1: company or exchange filing · Oct 14, 2026
- S17Q2 FY2026 earnings release (8-K Ex. 99.1) · SEC EDGAR · Tier 1: company or exchange filing · Jul 14, 2026
- S18Q1 FY2026 earnings release (8-K Ex. 99.1) · SEC EDGAR · Tier 1: company or exchange filing · Apr 13, 2026
- S19Q4 FY2025 earnings release (8-K Ex. 99.1) · SEC EDGAR · Tier 1: company or exchange filing · Jan 20, 2026
- S20Q3 FY2025 earnings release (8-K Ex. 99.1) · SEC EDGAR · Tier 1: company or exchange filing · Oct 14, 2025
- S21Q2 FY2025 earnings release (8-K Ex. 99.1) · SEC EDGAR · Tier 1: company or exchange filing · Jul 14, 2025
- S22Q1 FY2025 earnings release (8-K Ex. 99.1) · SEC EDGAR · Tier 1: company or exchange filing · Apr 11, 2025
- S23Q4 FY2024 earnings release (8-K Ex. 99.1) · SEC EDGAR · Tier 1: company or exchange filing · Jan 17, 2025
- S24Q3 FY2026 investor presentation · Fastenal Company · Tier 1: company or exchange filing · Oct 14, 2026
Changes to this page (v1 · Nov 20, 2026)
- v1 · Nov 20, 2026First version. (first version)
Numbers come only from tier 1 and tier 2 sources. Read how we research.
Disclaimer
For learning only. Cityfort is not a registered investment adviser or broker-dealer and does not recommend buying or selling any security. Prices shown are dated and may be out of date.
Investing in securities involves risk, including loss of capital. Before making any investment decision, do your own research and consider consulting a registered investment adviser or other qualified professional.
Cityfort, its owners and contributors may or may not hold securities of companies covered. Cityfort is not paid by any company it covers. Content is not an offer or solicitation to buy or sell any security, including in any initial public offering.
Read the positions policyRead the full disclaimerHide the full disclaimer
Cityfort publishes general educational content that explains how listed companies work. Cityfort is not registered with the US Securities and Exchange Commission or any state securities regulator as an investment adviser, and is not a broker-dealer or a member of FINRA. Cityfort does not provide investment, tax or legal advice, recommendations, ratings, price targets or any opinion on whether to buy, sell or hold any security. Nothing on the site is tailored to any person's circumstances.
All information is taken from publicly available sources, mainly company filings with the SEC, which are listed on each page with dates. We work to keep it accurate and correct errors publicly, but we do not guarantee that it is complete, accurate or up to date. Any market price or price-based ratio shown is dated, may be out of date by the time you read it, and is included only to explain concepts.
Statements by company management, including forward-looking statements and guidance, are reported as the company's statements, with their date and source; they are not our forecasts. Adjusted (non-GAAP) figures are the company's own measures and are shown next to the official (GAAP) figures.