Industrials · NYSE: GWW
Grainger: how the business works
Grainger resells safety gear, pumps, plumbing parts and hand tools that keep businesses running, with $17,942M of net sales in FY2025.
By Hardik Bhandare · Checked against filings: . Editorial policy. Corrections
Follow Grainger
Email me when Grainger's page is updated after earnings.
We'll send a confirmation email first. See our privacy policy.
W.W. Grainger, Inc. · Lake Forest, Illinois · Founded 1928
Updated for Q3 FY2026 · checked
- Net sales, FY2025
- $17,942M
- Net income, FY2025
- $1,706M
- Customers
- More than 4.6 million
- Team members, Dec 31, 2025
- About 25,000
- Incorporated
- 1928
The short version
Grainger in 5 points
1 · What it sells
Grainger resells maintenance, repair and operating (MRO) supplies such as safety gear, pumps and hand tools, about 2 million products in its High-Touch Solutions businesses, with FY2025 net sales of $17,942M.
2 · Who pays it
Mid-size and large businesses served by High-Touch Solutions N.A. paid 78% of Grainger's FY2025 sales, online buyers at Zoro and MonotaRO 20.2%, and UK customers of the now-sold Cromwell 1.8%.
3 · What it keeps from $100
Of every $100 that came in during FY2025, Grainger kept $9.5 as net income, after a $196M loss on leaving the UK; its operating earnings were 13.9% of sales.
4 · Where the operating profit comes from
High-Touch Solutions N.A. made $2,354M of Grainger's FY2025 segment operating earnings and Endless Assortment $345M, while Other businesses, mainly the UK, lost $204M.
5 · The one thing to watch
High-Touch Solutions N.A. sales grew 2.0% in FY2025 and 13.8% in Q3 FY2026; the company credited the Q3 rise to double-digit volume growth and price inflation passed on to customers.
Sources: From Grainger's FY2025 10-K, Q3 FY2026 10-Q and earnings releases · checked
01Where the money goes · FY2025
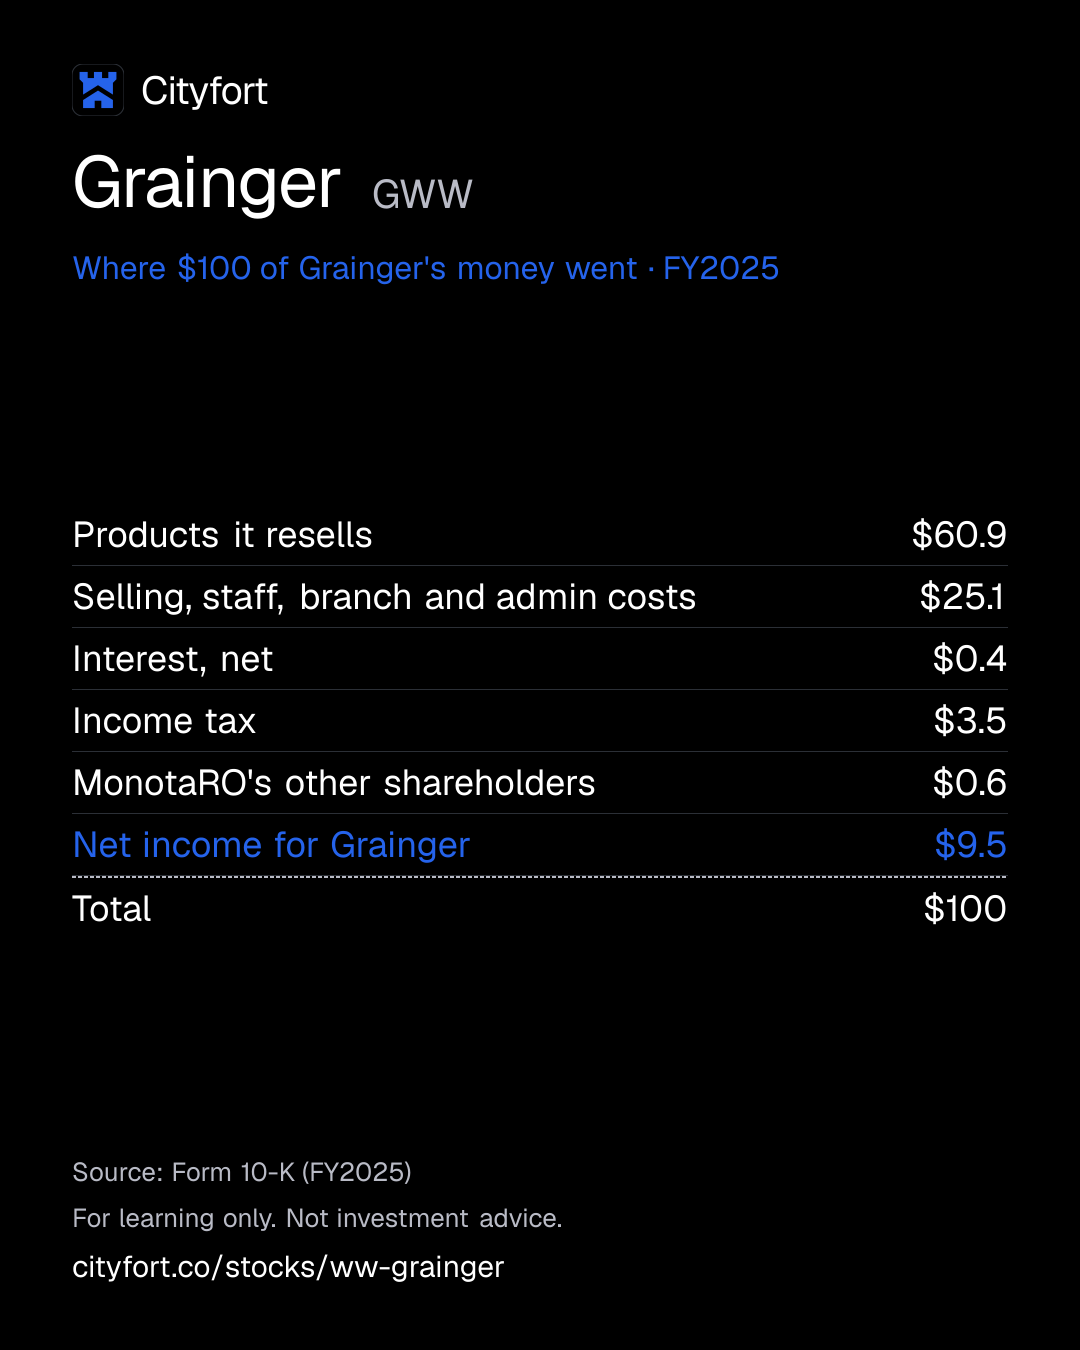
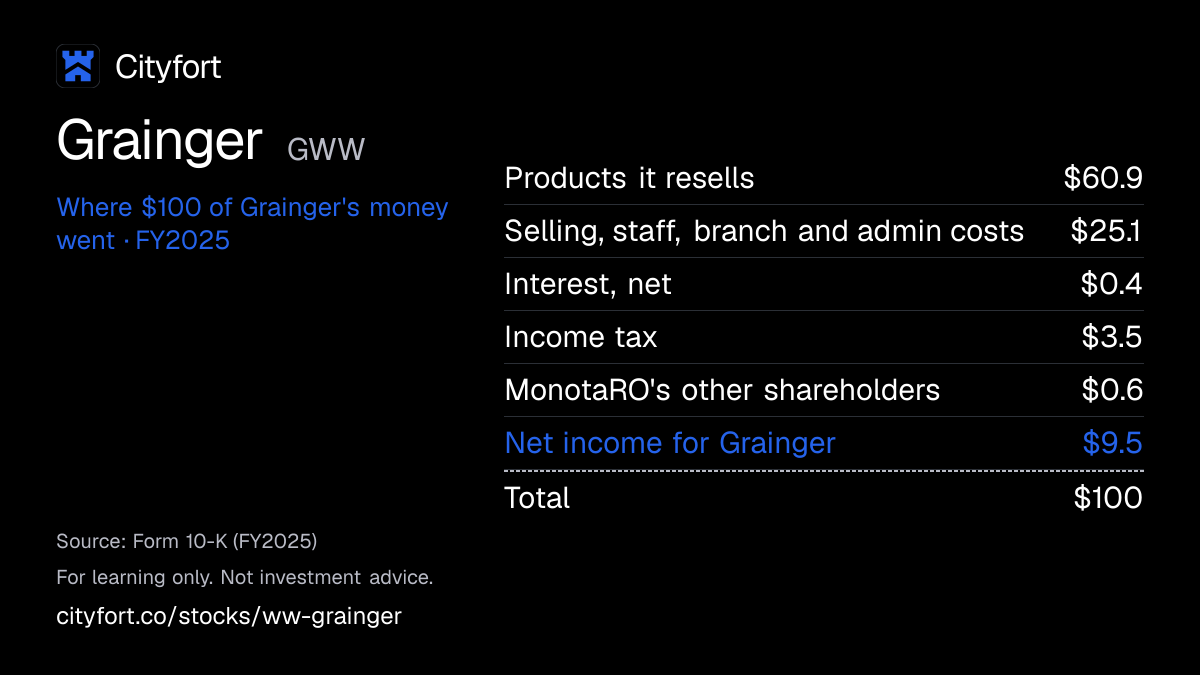
Where does $100 of Grainger's money go?
Grainger · FY2025
Receipt for every $100
| Products it resells | $60.9 |
|---|---|
| Selling, staff, branch and admin costs | $25.1 |
| Interest, net | $0.4 |
| Income tax | $3.5 |
| MonotaRO's other shareholders | $0.6 |
| Net income for Grainger | $9.5 |
| Total | $100 |
Each line = amount ÷ total money in × 100. Lines may not add to exactly $100 because of rounding.
How this is worked out
Cityfort calculation from the FY2025 10-K: each line ÷ total money in (net sales of $17,942M plus $16M of other income) × 100.
Save this receipt as an image
Embed this receipt or the key numbers
Paste this code into a blog or website to show the card you choose, with a link back to this page.
Each week: the next company due to report earnings, explained in 5 points.
No tips. Unsubscribe anytime.
We'll send a confirmation email. See our privacy policy.
02The business in one line
What does Grainger do?
Businesses pay Grainger for supplies they need quickly; of every $100 that came in during FY2025, $60.9 paid suppliers for the products, $25.1 went on staff, branches and admin, and $9.5 was left as net income.
- Mid-size and large businesses buying through Grainger.com, sales staff and branches made up 78% of FY2025 sales; the Zoro and MonotaRO online stores made up 20.2%.
- Gross profit, the gap between what Grainger pays suppliers and what customers pay, was 39.1% of FY2025 sales.
03Who pays it
Who pays Grainger?
Mid-size and large businesses (High-Touch Solutions N.A.)
78%
of revenue
Companies with complex purchasing that want product depth, advice and onsite inventory help; $13,993M of FY2025 sales.
Smaller and mid-size businesses online (Zoro, MonotaRO)
20.2%
of revenue
Buyers with simple needs who want clear prices and easy ordering; MonotaRO also serves large companies in Japan. $3,625M of FY2025 sales.
UK customers (Cromwell, sold Dec 2025)
1.8%
of revenue
Sales of the UK businesses Grainger has now exited; $324M in FY2025.
- Mid-size and large businesses (High-Touch Solutions N.A.)78%
- Smaller and mid-size businesses online (Zoro, MonotaRO)20.2%
- UK customers (Cromwell, sold Dec 2025)1.8%
How spread out the customers are
Grainger has more than 4.6 million customers, and no single customer was more than 10% of FY2025 sales. It does not disclose top-5 or top-10 shares.
Sources (1)
04How it makes money
How does Grainger make money?
Grainger earns a markup on millions of small orders, spread over a warehouse and branch network it already pays for.
Gross profit was 39.1% of FY2025 sales: the gap between what Grainger pays suppliers and what customers pay. Warehouses, branches and staff are a cost it carries whatever the volume. The FY2025 figure below includes the $196M UK exit loss.
Net income kept per $100 of sales
$8.0$9.5
FY2021 to FY2025
- Stock a wide range of products close to customers
- Customers order often, online or through their purchasing systems
- More orders share the same warehouse, branch and staff costs
- Earn a markup of about $39 per $100 of sales
- Reinvest in distribution centers, websites and inventory tools
↺ Step 5 feeds back into step 1.
05Business segments · FY2025
Which businesses make up Grainger?
High-Touch Solutions N.A.
78%Grainger-branded sales with service and inventory help in the US, Canada, Mexico and Puerto Rico.
Revenue $14.0B ($13,993M) · Operating profit $2.4B ($2,354M)
Endless Assortment
20.2%Online stores Zoro (US) and MonotaRO (Japan) with millions of products.
Revenue $3.6B ($3,625M) · Operating profit $345M
Other businesses
1.8%Mainly Cromwell in the UK, sold Dec 17, 2025, and an insurance unit; the loss includes the UK exit.
Revenue $324M · Operating profit −$204M
How the mix changed
- High-Touch Solutions N.A.
- Endless Assortment
- Other businesses
Revenue by segment, FY2023 to FY2025.
US$
See the numbers
Sources (1)
06The numbers · Consolidated · US$
How has Grainger done?
Revenue
$17.9BFY2025
Net sales rose every year, from $13,022M in FY2021 to $17,942M in FY2025, and reached $5,181M in Q3 FY2026.
US$
See the numbers
Net income
$1.7BFY2025
Net income attributable to Grainger fell to $1,706M in FY2025 from $1,909M in FY2024, after a $196M loss on leaving the UK.
US$
See the numbers
Net income for every $100 of revenue
$9.5FY2025
Grainger kept $9.50 of net income per $100 of sales in FY2025, down from $11.10 in FY2023 and FY2024.
Net margin: $ of net income per $100 of revenue
See the numbers
Free cash flow
$1.3BFY2025
Free cash flow (operating cash flow minus capital spending) was $1,331M in FY2025, down from $1,570M in FY2024, while capital spending rose to $684M.
US$ · cash from operations minus spending on plants and equipment
See the numbers
See all yearly numbers
EBITDA here = operating income plus depreciation and amortization (from the cash flow statement). Fiscal years are the company's own: Fiscal year is the calendar year (ends Dec 31). Net income is the share belonging to the company's owners. Total net income differs from net profit to the company's owners: Total net earnings include the share of MonotaRO profit that belongs to its other shareholders.
Learn: Fiscal years that don't end in December: Nvidia's FY2027 explained · Stock-based compensation and dilution: pay that becomes shares
Sources (22)
- Form 10-K for FY2021
- Form 10-K for FY2022
- Form 10-K for FY2024
- Form 10-K for FY2023
- Form 10-K for FY2025
- Form 10-Q for Q1 FY2024
- Q1 FY2025 earnings release (8-K Ex. 99.1)
- Form 10-Q for Q2 FY2024
- Q2 FY2025 earnings release (8-K Ex. 99.1)
- Form 10-Q for Q3 FY2024
- Q3 FY2025 earnings release (8-K Ex. 99.1)
- Q4 FY2024 earnings release (8-K Ex. 99.1)
- Form 10-Q for Q1 FY2025
- Form 10-Q for Q2 FY2025
- Form 10-Q for Q3 FY2025
- Q4 FY2025 earnings release (8-K Ex. 99.1)
- Form 10-Q for Q1 FY2026
- Q1 FY2026 earnings release (8-K Ex. 99.1)
- Form 10-Q for Q2 FY2026
- Q2 FY2026 earnings release (8-K Ex. 99.1)
- Form 10-Q for Q3 FY2026
- Q3 FY2026 earnings release (8-K Ex. 99.1)
07Who runs it
Who runs Grainger, and did they deliver?
D.G. Macpherson
Chairman and Chief Executive Officer · since 2016
CEO since October 2016 and chairman since October 2017; earlier chief operating officer and a Boston Consulting Group partner.
Laurie R. Thomson
Interim Chief Financial Officer, Vice President and Controller · since 2021
Controller since May 2021; signed the Q3 FY2026 10-Q as Interim CFO. The FY2025 10-K had listed Deidra C. Merriwether as CFO.
Paige K. Robbins
Senior Vice President and President, Grainger Business Unit · since 2021
In the role since January 2021; joined Grainger in 2010.
Nancy L. Berardinelli-Krantz
Senior Vice President and Chief Legal Officer · since 2023
Joined in January 2023 from Eaton.
Jonny LeRoy
Senior Vice President and Chief Technology Officer · since 2020
Joined in April 2020 from ThoughtWorks.
What they said, and what happened
1 delivered · 2 too early to tell
Said on Jan 31, 2025
FY2025 adjusted diluted EPS of $39.00–41.50 (outlook given with Q4 FY2024 results).
DeliveredWhat happened
FY2025 adjusted diluted EPS was $39.48, inside the range; reported diluted EPS was $35.40.
Said on Feb 3, 2026
FY2026 net sales of $18.7–19.1 billion (first FY2026 outlook).
Too early to tellWhat happened
Net sales were $14,944M in the first nine months; the company raised the range to $19.8–20.0 billion on Nov 4, 2026.
Said on Feb 3, 2026
FY2026 share buybacks of $0.95–1.05 billion.
Too early to tellWhat happened
The Nov 4, 2026 outlook narrowed the range to $0.975–1.025 billion.
08What could go wrong
What could go wrong for Grainger?
- Pricing
Tariffs and product cost inflation
The 10-K says tariffs and trade policy changes could raise product costs and hurt margins. FY2025 gross margin fell to 39.1%, which the company tied mainly to tariff-related inflation.
Watch Quarterly gross margin against the 39.4–39.6% the company guided for FY2026 on Nov 4, 2026.
- Demand
Demand follows US industry
About 81% of FY2025 sales came from the US. The 10-K says demand depends on customers' production, capital spending and the wider economy.
Watch Daily organic sales growth in High-Touch Solutions N.A. each quarter.
- Competition
Competition and the shift online
Grainger competes with manufacturers selling direct, distributors, retailers and internet businesses. The 10-K says its eCommerce growth depends on continued investment in its platforms, and results could suffer if competitors' similar investments work better.
Watch Endless Assortment growth and gross margin in each segment.
- Currency
Japan and currency exposure
Japan was 12.1% of FY2025 sales through MonotaRO, which reports in yen and is listed in Tokyo with its own disclosure rules. The 10-K says currency moves affect reported results.
Watch Gap between reported sales growth and constant-currency growth (with exchange-rate moves taken out) in Endless Assortment.
- Debt
More borrowing
Total debt was $2,685M at Sep 30, 2026, up from $2,488M at Dec 31, 2025. Grainger then priced $400M of new notes in November 2026. The 10-K says a rating cut could raise borrowing costs.
Watch Total debt in the FY2026 10-K and any change to the A2 / A+ ratings.
- Technology
Cyber attacks and system outages
Grainger sells through websites and purchasing systems linked to its own. The 10-K says breaches or outages could disrupt operations; it reports no material cybersecurity incident so far.
Watch Any incident disclosed in an 8-K or 10-Q.
- Execution
Finance leadership change
An interim CFO signed the Q3 FY2026 10-Q. The research for this page does not include the filing that explains the change.
Watch An 8-K naming a permanent chief financial officer.
09Supporters vs. critics
What do supporters and critics point to?
What supporters point to
- High-Touch Solutions N.A. sales grew 2.0% in FY2025, then 10.5%, 11.9% and 13.8% in the first three quarters of FY2026.
- Endless Assortment sales rose to $3,625M in FY2025 from $3,134M, and its segment operating earnings to $345M from $260M.
- Free cash flow was $1,331M in FY2025; Grainger paid $467M of dividends and bought back $1,045M of shares that year.
- FY2025 adjusted diluted EPS of $39.48 was inside the $39.00–41.50 range Grainger gave on Jan 31, 2025; reported diluted EPS was $35.40.
- No single customer was more than 10% of FY2025 sales, across more than 4.6 million customers.
What critics point to
- Net income attributable to Grainger fell to $1,706M in FY2025 from $1,909M in FY2024, after a $196M loss on leaving the UK.
- Gross margin fell to 39.1% in FY2025, which the company tied mainly to tariff-related inflation.
- Total debt rose from $2,488M at Dec 31, 2025 to $2,685M at Sep 30, 2026, and Grainger priced $400M of new notes on Nov 12, 2026.
- About 81% of FY2025 sales came from the US; the 10-K says demand depends on customers' production, capital spending and the wider economy.
- An interim CFO signed the Q3 FY2026 10-Q, while the FY2025 10-K had listed Deidra C. Merriwether as CFO.
10What to watch next
What should you watch next at Grainger?
Next event
Q4 FY2026 results
Date not announced yet.
Sales growth at Grainger North America
High-Touch Solutions N.A. sales grew 13.8% in Q3 FY2026, after 2.0% in FY2025. The company credited the Q3 FY2026 rise to double-digit volume growth and price inflation passed on to customers.
Gross margin and tariffs
Gross margin was 39.1% in FY2025. On Nov 4, 2026 the company said it expects 39.4–39.6% for FY2026.
Debt after the new notes
Total debt was $2,685M at Sep 30, 2026, and Grainger priced $400M of 5.400% notes due 2031 on Nov 12, 2026. The FY2026 10-K will show the year-end total.
A permanent finance chief
Laurie R. Thomson signed the Q3 FY2026 10-Q as Interim CFO. A permanent appointment would be disclosed in an 8-K.
11Key facts
Key facts about Grainger
- What does Grainger do?
- W.W. Grainger, Inc. (NYSE: GWW), based in Lake Forest, Illinois, resells maintenance, repair and operating (MRO) supplies such as safety gear, pumps and hand tools to businesses and institutions. Grainger buys from more than 5,000 primary suppliers and sells through Grainger.com, branches, Zoro and MonotaRO.
- How does Grainger make money?
- Grainger earns the gap between what it pays suppliers and what customers pay; gross profit was 39.1% of FY2025 sales. In FY2025, Grainger's High-Touch Solutions N.A. segment made $2,354M of operating earnings and Endless Assortment made $345M.
- Who are Grainger's customers?
- Grainger has more than 4.6 million customers, and no single customer was more than 10% of its FY2025 sales. Mid-size and large businesses served by Grainger's High-Touch Solutions N.A. segment made up 78% of FY2025 sales.
- How big is Grainger?
- Grainger had FY2025 net sales of $17,942M, up from $17,168M in FY2024. Net income attributable to Grainger was $1,706M in FY2025, down from $1,909M, after a $196M loss on leaving the UK.
- How did Grainger do in Q3 FY2026?
- Grainger's Q3 FY2026 net sales were $5,181M, up from $4,657M in Q3 FY2025. Grainger's Q3 FY2026 diluted EPS was $12.42, against $6.12 in Q3 FY2025, the quarter in which it booked a $186M impairment on its UK business.
- How much debt does Grainger have?
- Grainger had total debt of $2,685M and cash of $768M at Sep 30, 2026, so its net debt was $1,917M (Cityfort calculation from the Q3 FY2026 10-Q). Grainger's FY2025 10-K states its ratings at Dec 31, 2025 as A2 from Moody's and A+ from S&P.
- Does Grainger pay a dividend?
- Grainger paid $467M of dividends and bought back $1,045M of its shares in FY2025, per its FY2025 10-K. Grainger declared a quarterly dividend of $2.49 per share on Oct 28, 2026.
- Who owns Grainger?
- Grainger has one class of common stock, with 46,814,148 shares outstanding at Oct 28, 2026. Grainger's 2026 proxy names The Vanguard Group (11.71%), BlackRock (8.1%) and director Susan Slavik Williams (5.9%) as holders of more than 5%.
Terms on this page
- Capital expenditures (capex)
- Debt-to-equity
- Earnings per share (EPS)
- EBITDA
- Free cash flow
- Net debt
- Net margin
- Operating margin
- Revenue vs net income
- Stock buyback
Each explains the term in plain English, with the same number from other companies on Cityfort.
Go deeper
More detail from the same filings. Open any section.
12What it sells
12What it sells
What does Grainger sell?
Grainger (High-Touch Solutions N.A.)
About 2 million products sold through Grainger.com, sales staff and branches in the US, Canada, Mexico and Puerto Rico, mostly to mid-size and large businesses.
KeepStock inventory service
Grainger manages stockrooms and supplies on the customer's own site, so the customer does not run out of parts.
Zoro (US online store)
A website with about 13 million products for smaller businesses that want simple online buying and visible prices.
MonotaRO (Japan online store)
A Tokyo-listed online seller with access to about 29 million products; Grainger holds a controlling interest.
Own brands
Brands such as DAYTON, WESTWARD and TOUGH GUY made up about 19% of FY2025 US stocked product sales in High-Touch Solutions N.A.
Think of it like this
Like a giant hardware store for businesses, which also ships next day and can run the customer's supply room.
What it does
- Does: Stocks more than 1.5 million products in its distribution centers and branches
- Does: Ships most High-Touch orders from automated distribution centers for next-day delivery
- Does: Connects to customers' purchasing systems so orders flow in electronically
What it does not do
- Does not: Does not make most of what it sells: it buys from more than 5,000 primary suppliers
- Does not: Does not sell mainly to households: buyers are businesses, governments and institutions
- Does not: No longer runs a UK business: it sold Cromwell on Dec 17, 2025 and closed Zoro U.K.
Sources (1)
13How the money flows
13How the money flows · FY2025
How does money flow through Grainger?
Money in
- Net sales$17.9B
- Other income, net$16M
The company
Grainger
$18.0B came in
Money out
- Cost of the products it resells$10.9B
- Selling, staff, branch and admin costs (incl. $186M UK impairment)$4.5B
- Interest, net$81M
- Income tax$622M
- Profit belonging to MonotaRO's other shareholders$102M
- Net income attributable to Grainger$1.7B
- Businesses ordered $17,942M of supplies in FY2025, online, by phone, through purchasing systems or at branches.
- Grainger paid suppliers $10,933M for those products, leaving $7,009M of gross profit.
- Staff, warehouses, branches, marketing and technology cost $4,514M, which included a $186M write-down of the UK business.
- After $16M of other income, $81M of net interest and $622M of tax, $1,808M was left; $102M of it belonged to MonotaRO's other shareholders.
- Grainger's own shareholders were left with $1,706M of net income.
Sources (2)
14What it needs to run
14What it needs to run
What does Grainger need to run?
Warehouses and branches
Facilities of 28.7 million square feet, including 21 US distribution centers and 245 US branches at the end of FY2025.
Suppliers
More than 5,000 primary suppliers; none was more than 5% of FY2025 purchases.
People
About 25,000 team members at Dec 31, 2025, about 90% of them in North America.
Websites and ordering systems
Grainger.com, Zoro and MonotaRO, plus links into customers' purchasing software; the 10-K names AI and eCommerce change as competitive risks.
Sources (1)
15Where it sells
15Where it sells · FY2025
Where does Grainger sell?
- United States80.5%
- Japan12.1%
- Canada3.8%
- Other countries3.6%
Sources (1)
16Where growth could come from
16Where growth could come from
Where could Grainger's growth come from?
On Nov 4, 2026 Grainger said it expects FY2026 net sales of $19.8–20.0 billion and adjusted diluted EPS of $47.00–48.00. Its first FY2026 outlook, on Feb 3, 2026, was $18.7–19.1 billion and $42.25–44.75.
Online stores (Endless Assortment)
WorkingSales +15.7% in FY2025
Zoro and MonotaRO sales grew to $3,625M in FY2025 from $3,134M, and segment operating earnings rose to $345M from $260M. Sales rose 11.9% in Q3 FY2026.
Status: Working, on track against what the company said.
Higher volumes at Grainger North America
WorkingSales +13.8% in Q3 FY2026
High-Touch Solutions N.A. sales grew 2.0% in FY2025, then 10.5%, 11.9% and 13.8% in the first three quarters of FY2026. The company credited double-digit volume growth and price inflation passed on to customers.
Status: Working, on track against what the company said.
Inventory-management technology (Adroit assets)
New$215M purchase, Aug 26, 2026
Grainger bought technology, intellectual property and staff from Adroit Worldwide Media. The 10-Q says it expects this to enhance inventory management in High-Touch Solutions N.A.
Status: New, recently announced.
Status compares progress with what the company itself said it would do: Working = on track against what the company said; Mixed = partly on track; Behind = behind the company's own plan; New = recently announced; Early = too early to judge.
17The company's own measures (non-GAAP)
17The company's own measures · FY2025
What do Grainger's own measures show?
Official (GAAP): Operating earnings
$2.5B
Company's own measure: Adjusted operating earnings
$2.7B
Leaves out the $186M loss on the Cromwell sale and the $10M cost of closing Zoro U.K.
Official (GAAP): Net earnings attributable to Grainger
$1.7B
Company's own measure: Adjusted net earnings attributable to Grainger
$1.9B
Same UK exit items removed, after their tax effect.
Official (GAAP): Diluted EPS ($)
$35.4M
Company's own measure: Adjusted diluted EPS ($)
$39.5M
Adjusted EPS rose 1.3% from FY2024 while reported EPS fell 8.6%.
Official (GAAP): Operating margin
13.9%
Company's own measure: Adjusted operating margin
15.0%
Operating earnings per $100 of sales, before and after the UK exit items.
These are the company's own measures, defined by the company. They are not comparable across companies, and they are not added together. Each sits beside the nearest official (GAAP) figure.
Learn: Non-GAAP measures: what a company's "adjusted" numbers leave out
Sources (1)
18Financial strength and debt
18Financial strength · Sep 30, 2026
How much debt does Grainger have?
- Total debt$2.7B
- Cash and investments$768M
- Net debt (debt minus cash)$1.9B
- Net worth (shareholders' money)$4.3B
- Debt to equity
- 0.62×
- $ of debt for every $1 of shareholders' money
- Total debt is borrowings only (notes, yen term loans and commercial paper); it excludes operating lease liabilities. Net debt = total debt minus cash (Cityfort calculation from the Q3 FY2026 10-Q).
- Net worth is equity belonging to Grainger shareholders; MonotaRO minority holders had another $397M at Sep 30, 2026.
- On Nov 12, 2026 Grainger priced $400M of 5.400% senior notes due 2031, after this balance sheet date.
19Who owns it
19Who owns it · ownership as of Dec 31, 2025
Who owns Grainger?
Share classes
Holders of 5% or more
From the company's proxy statement (DEF 14A), later Schedule 13G filings and the share counts on its latest annual or quarterly report. Each holder row shows the date of its own filing.
Learn: How to read a proxy statement (DEF 14A): Nvidia's 2026 proxy · Form 4 insider filings: who files, the codes and the footnotes
20What it does with profit
20What it does with profit
What does Grainger do with its profit?
Dividend per share
$8.83FY2025
Dividend paid for each share, by financial year.
$ per share
See the numbers
Buyback · Dec 31, 2024
Share repurchases in FY2024: 1,192,316 shares.
$1.2B
Buyback · Dec 31, 2025
Share repurchases in FY2025: 1,038,509 shares.
$1.0B
Sources (1)
21Governance signals
21Governance signals
What do Grainger's governance filings show?
- Auditor
- Ernst & Young LLP, since 2005
- Auditor changes
- None in the period covered
- Audit qualifications
- None reported
- Related-party dealings
- The 2026 proxy says the board's nominating committee found no related person transactions from Jan 1, 2025 to the proxy date.
- Credit rating
- Moody's and S&P Global Ratings, as stated in Grainger's FY2025 10-K A2 (Moody's) / A+ (S&P) (outlook Not stated in the 10-K), Dec 31, 2025
A credit rating describes the company's ability to repay debt. It is not a rating of the share.
Flags to know about
other · Nov 4, 2026
Interim finance chief
Laurie R. Thomson signed the Q3 FY2026 10-Q as Interim Chief Financial Officer. The FY2025 10-K had listed Deidra C. Merriwether as CFO; the 8-K explaining the change was not part of this research.
22How it got here
22How it got here
How did Grainger get here?
1928
Milestone
Incorporated in Illinois
W.W. Grainger, Inc. was incorporated in the State of Illinois in 1928.
2016
Milestone
D.G. Macpherson becomes CEO
He took over as chief executive in October 2016 and became chairman in October 2017.
2024
Milestone
New buyback program
On Apr 24, 2024 Grainger announced a program to buy back up to 5 million shares.
2025
Business-model change
Agreement to sell Cromwell
On Oct 6, 2025 it agreed to sell its UK business and booked a $186M impairment in Q3 FY2025.
2025
Business-model change
UK exit completed
The Cromwell sale closed on Dec 17, 2025, and Zoro U.K. was closed in Q4 FY2025.
2026
Milestone
Tariff refunds
Refunds of IEEPA tariffs on goods Grainger imported directly cut Q2 FY2026 cost of goods sold by $43M.
2026
Milestone
Adroit technology purchase
On Aug 26, 2026 it bought technology, intellectual property and staff from Adroit Worldwide Media for $215M.
2026
Milestone
New five-year bonds
On Nov 12, 2026 Grainger priced $400M of 5.400% senior notes due 2031.
23Sources and changes
Where every number on this page comes from
Sources (24 documents)
- S1Form 10-Q for Q3 FY2026 · SEC EDGAR · Tier 1: company or exchange filing · Nov 4, 2026
- S2Form 10-Q for Q2 FY2026 · SEC EDGAR · Tier 1: company or exchange filing · Aug 4, 2026
- S3Form 10-Q for Q1 FY2026 · SEC EDGAR · Tier 1: company or exchange filing · May 7, 2026
- S4Form 10-K for FY2025 · SEC EDGAR · Tier 1: company or exchange filing · Feb 19, 2026
- S5Form 10-Q for Q3 FY2025 · SEC EDGAR · Tier 1: company or exchange filing · Oct 31, 2025
- S6Form 10-Q for Q2 FY2025 · SEC EDGAR · Tier 1: company or exchange filing · Aug 1, 2025
- S7Form 10-Q for Q1 FY2025 · SEC EDGAR · Tier 1: company or exchange filing · May 1, 2025
- S8Form 10-K for FY2024 · SEC EDGAR · Tier 1: company or exchange filing · Feb 20, 2025
- S9Form 10-Q for Q3 FY2024 · SEC EDGAR · Tier 1: company or exchange filing · Oct 31, 2024
- S10Form 10-Q for Q2 FY2024 · SEC EDGAR · Tier 1: company or exchange filing · Aug 1, 2024
- S11Form 10-Q for Q1 FY2024 · SEC EDGAR · Tier 1: company or exchange filing · Apr 25, 2024
- S12Form 10-K for FY2023 · SEC EDGAR · Tier 1: company or exchange filing · Feb 22, 2024
- S13Form 10-K for FY2022 · SEC EDGAR · Tier 1: company or exchange filing · Feb 21, 2023
- S14Form 10-K for FY2021 · SEC EDGAR · Tier 1: company or exchange filing · Feb 23, 2022
- S152026 proxy statement (DEF 14A) · SEC EDGAR · Tier 1: company or exchange filing · Mar 10, 2026
- S168-K filed Nov 16, 2026: $400 million 5.400% Senior Notes due 2031 · SEC EDGAR · Tier 1: company or exchange filing · Nov 16, 2026
- S17Q3 FY2026 earnings release (8-K Ex. 99.1) · SEC EDGAR · Tier 1: company or exchange filing · Nov 4, 2026
- S18Q2 FY2026 earnings release (8-K Ex. 99.1) · SEC EDGAR · Tier 1: company or exchange filing · Aug 4, 2026
- S19Q1 FY2026 earnings release (8-K Ex. 99.1) · SEC EDGAR · Tier 1: company or exchange filing · May 8, 2026
- S20Q4 FY2025 earnings release (8-K Ex. 99.1) · SEC EDGAR · Tier 1: company or exchange filing · Feb 3, 2026
- S21Q3 FY2025 earnings release (8-K Ex. 99.1) · SEC EDGAR · Tier 1: company or exchange filing · Oct 31, 2025
- S22Q2 FY2025 earnings release (8-K Ex. 99.1) · SEC EDGAR · Tier 1: company or exchange filing · Aug 1, 2025
- S23Q1 FY2025 earnings release (8-K Ex. 99.1) · SEC EDGAR · Tier 1: company or exchange filing · May 1, 2025
- S24Q4 FY2024 earnings release (8-K Ex. 99.1) · SEC EDGAR · Tier 1: company or exchange filing · Jan 31, 2025
Changes to this page (v1 · Nov 20, 2026)
- v1 · Nov 20, 2026First version. (first version)
Numbers come only from tier 1 and tier 2 sources. Read how we research.
Disclaimer
For learning only. Cityfort is not a registered investment adviser or broker-dealer and does not recommend buying or selling any security. Prices shown are dated and may be out of date.
Investing in securities involves risk, including loss of capital. Before making any investment decision, do your own research and consider consulting a registered investment adviser or other qualified professional.
Cityfort, its owners and contributors may or may not hold securities of companies covered. Cityfort is not paid by any company it covers. Content is not an offer or solicitation to buy or sell any security, including in any initial public offering.
Read the positions policyRead the full disclaimerHide the full disclaimer
Cityfort publishes general educational content that explains how listed companies work. Cityfort is not registered with the US Securities and Exchange Commission or any state securities regulator as an investment adviser, and is not a broker-dealer or a member of FINRA. Cityfort does not provide investment, tax or legal advice, recommendations, ratings, price targets or any opinion on whether to buy, sell or hold any security. Nothing on the site is tailored to any person's circumstances.
All information is taken from publicly available sources, mainly company filings with the SEC, which are listed on each page with dates. We work to keep it accurate and correct errors publicly, but we do not guarantee that it is complete, accurate or up to date. Any market price or price-based ratio shown is dated, may be out of date by the time you read it, and is included only to explain concepts.
Statements by company management, including forward-looking statements and guidance, are reported as the company's statements, with their date and source; they are not our forecasts. Adjusted (non-GAAP) figures are the company's own measures and are shown next to the official (GAAP) figures.