Financials · NYSE: AJG
Gallagher: how the business works
Gallagher is an insurance broker: it finds and buys insurance for businesses and handles claims, and it took in $13.94 billion of revenue in FY2025.
By Hardik Bhandare · Checked against filings: . Editorial policy. Corrections
Follow Gallagher
Email me when Gallagher's page is updated after earnings.
We'll send a confirmation email first. See our privacy policy.
Arthur J. Gallagher & Co. · Rolling Meadows, Illinois · Founded 1927
Updated for Q3 FY2026 · checked
- Revenue, FY2025
- $13.94B
- Net income, FY2025
- $1.49B
- Acquisitions, 2002 to 2025
- About 780
- Employees, Dec 31, 2025
- About 72,000
- Founded
- 1927
The short version
Gallagher in 5 points
1 · What it sells
Gallagher finds and buys insurance and reinsurance for clients, advises on employee benefits and handles claims, taking in $13.94 billion of revenue in FY2025.
2 · Who pays it
Brokerage clients and the insurers that pay its commissions brought in 87.4% of Gallagher's FY2025 revenue, and companies paying it to handle claims 12.5%.
3 · What it keeps from $100
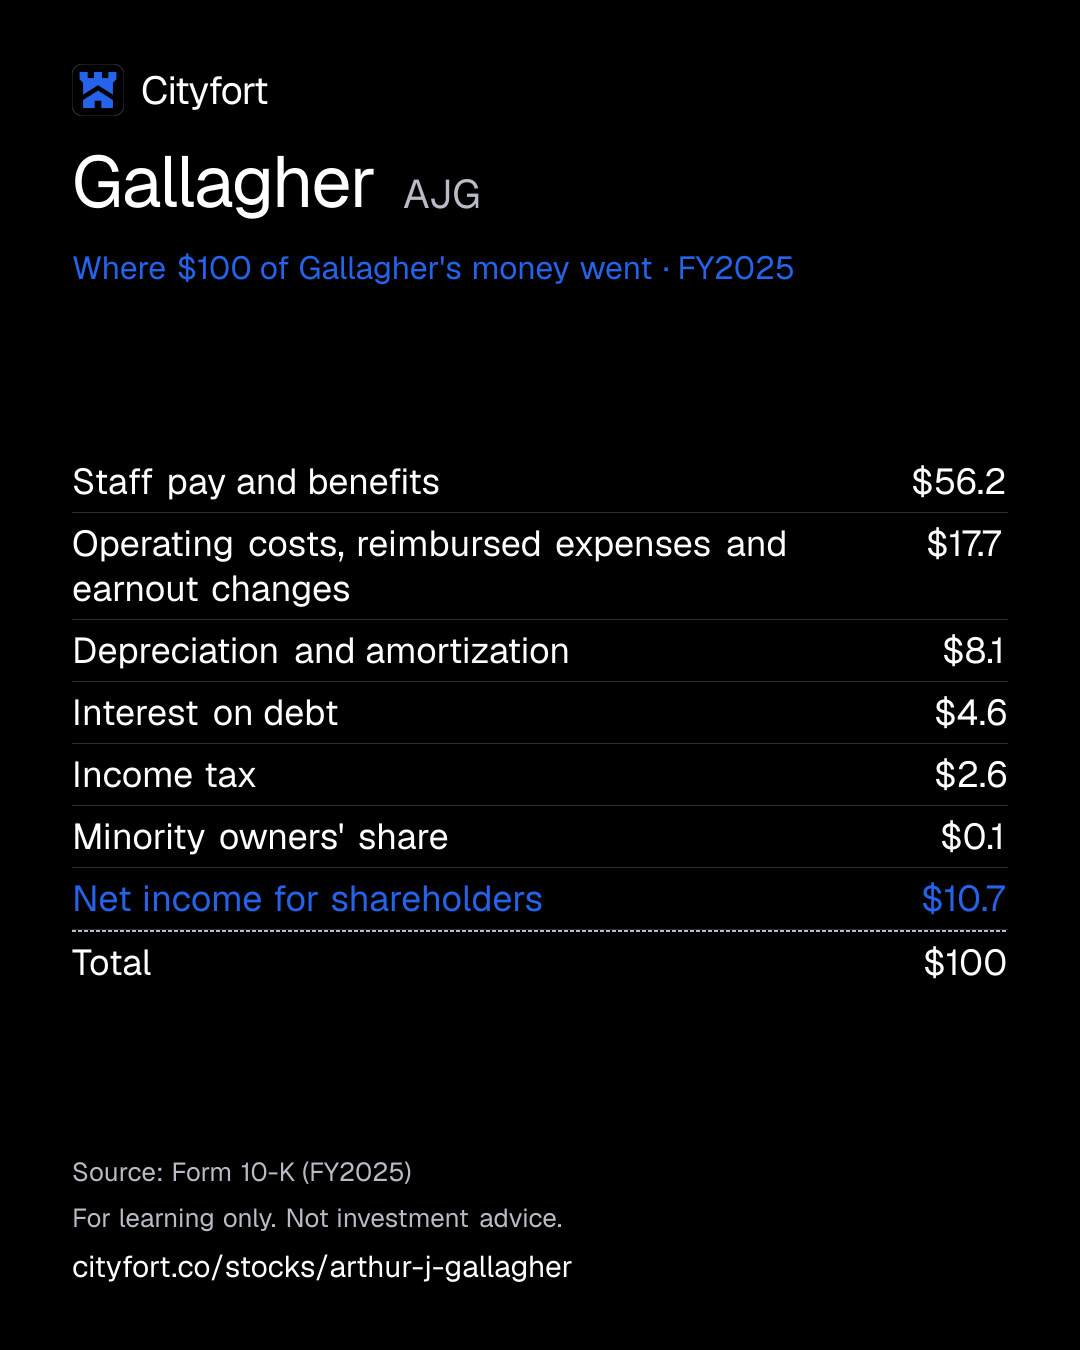
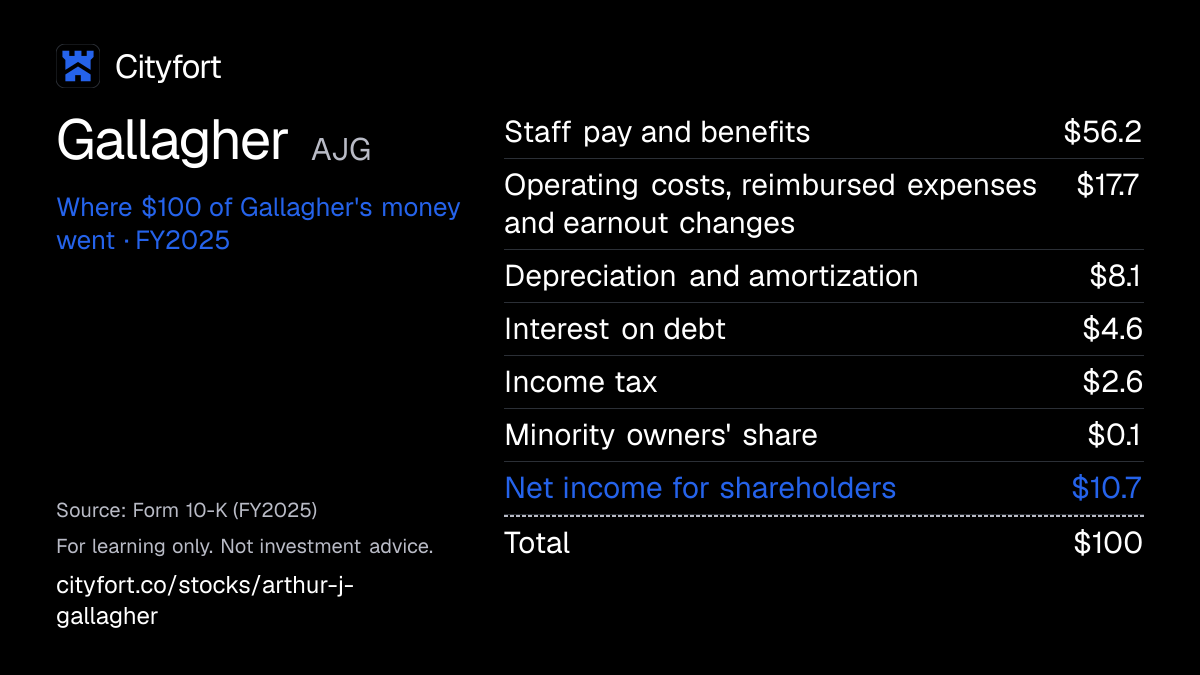
Of every $100 that came in during FY2025, Gallagher spent $56.2 on staff pay, made $26.1 of operating profit before interest, tax, depreciation and amortization (EBITDAOperating profit before wear-and-tear charges (depreciation and amortization). As a margin: per $100 of sales., Cityfort calculation) and kept $10.7 as net income for shareholders.
4 · Where the operating profit comes from
Brokerage earned $2,759 million before tax in FY2025 and risk management $249 million, while the corporate segment, which carries the debt and deal costs, lost $1,137 million.
5 · The one thing to watch
Gallagher's corporate borrowings were $12.7 billion at Dec 31, 2025 after the AssuredPartners purchase, while brokerage organic growth was 5% in Q3 FY2026.
Sources: From Gallagher's FY2025 10-K, Q3 FY2026 10-Q and Q3 2026 earnings release · checked
01Where the money goes · FY2025
Where does $100 of Gallagher's money go?
Gallagher · FY2025
Receipt for every $100
| Staff pay and benefits | $56.2 |
|---|---|
| Operating costs, reimbursed expenses and earnout changes | $17.7 |
| Depreciation and amortization | $8.1 |
| Interest on debt | $4.6 |
| Income tax | $2.6 |
| Minority owners' share | $0.1 |
| Net income for shareholders | $10.7 |
| Total | $100 |
Each line = amount ÷ total money in × 100. Lines may not add to exactly $100 because of rounding.
How this is worked out
Cityfort calculation from the FY2025 10-K: each line ÷ total revenues of $13,942 million × 100. Amortization of intangible assets bought with acquisitions was $916 million of the $1,122 million depreciation and amortization line.
Save this receipt as an image
Embed this receipt or the key numbers
Paste this code into a blog or website to show the card you choose, with a link back to this page.
Each week: the next company due to report earnings, explained in 5 points.
No tips. Unsubscribe anytime.
We'll send a confirmation email. See our privacy policy.
02The business in one line
What does Gallagher do?
Insurers pay Gallagher a commission out of each premium it places, or clients pay it a fee. In FY2025 staff pay took $56.2 of every $100, and $10.7 was left as net income.
- Businesses, nonprofits and public bodies buy their insurance through Gallagher's brokers, insurers buy reinsurance through Gallagher Re, and self-insured companies pay it to settle claims.
- Brokerage brought in 87.4% of FY2025 revenue and claims handling 12.5%; Gallagher grows by buying smaller brokers, including AssuredPartners for $13.8 billion in Aug 2025.
03Who pays it
Who pays Gallagher?
Businesses, nonprofits and public bodies buying insurance
Share of revenue not disclosed
The main brokerage clients. Insurers pay Gallagher a commission out of each premium, or the client pays a fee. Retail brokerage was 75% of brokerage revenue in FY2025.
Insurance companies buying reinsurance
Share of revenue not disclosed
Clients of Gallagher Re, which was 12% of brokerage revenue in FY2025.
Other insurance brokers
Share of revenue not disclosed
Use Gallagher's wholesale arm to place specialized cover. Wholesale was 13% of brokerage revenue in FY2025.
Self-insured companies and insurers needing claims handled
12.5%
of revenue
Pay the risk management segment to settle claims. About 95% of this revenue came from clients outside Gallagher's brokerage arm; the segment was 12.5% of FY2025 revenue.
How spread out the customers are
In FY2025 the largest single client was about 1% and the ten largest together about 3% of combined brokerage and risk management revenue, per the FY2025 10-K.
- Largest customer
- 1%
- Top 10 customers
- 3%
Sources (1)
04How it makes money
How does Gallagher make money?
Commissions follow premiums, and each broker it buys adds clients to the same platform.
Gallagher earns a share of each premium it places, so revenue follows both client numbers and insurance prices. It bought about 780 firms from 2002 to 2025, mostly small local brokers. Pay is the biggest cost, at $56.2 of every $100 of FY2025 revenue.
EBITDA per $100 of revenue (Cityfort calculation)
$21.5$26.1
FY2021 to FY2025
- Brokers win clients and place their insurance
- Insurers pay a commission from each premium
- Gallagher buys smaller brokers and adds their clients
- Shared offices, systems and India service centers serve the larger client base
- Operating cash and new borrowing fund the next acquisition
↺ Step 5 feeds back into step 1.
05Business segments · FY2025
Which businesses make up Gallagher?
Brokerage
87.4%Retail, wholesale and reinsurance brokerage plus benefits consulting; the profit figure is pretax earnings.
Revenue $12.2B ($12,192M) · Operating profit $2.8B ($2,759M)
Risk management
12.5%Claims settlement and administration for self-insured companies and insurers.
Revenue $1.7B ($1,749M) · Operating profit $249M
Corporate
0%Holds the debt, acquisition costs, other head-office costs and clean energy investments; almost no revenue.
Revenue $1M · Operating profit −$1.1B (−$1,137M)
How the mix changed
- Brokerage
- Risk management
- Corporate
Revenue by segment, FY2023 to FY2025.
US$
See the numbers
06The numbers · Consolidated · US$
How has Gallagher done?
Revenue
$13.9BFY2025
Revenue rose from $8.21 billion in FY2021 to $13.94 billion in FY2025. It grew 20.7% in FY2025 as AssuredPartners and Woodruff Sawyer joined; organic growth in brokerage and risk management was 6%.
US$
See the numbers
Net income
$1.5BFY2025
Net income rose from $907 million in FY2021 to $1.49 billion in FY2025. Diluted EPS (profit per share) fell from $6.50 in FY2024 to $5.74, as average shares rose to 256.1 million from 220.5 million after the 2024 share sale.
US$
See the numbers
Net income for every $100 of revenue
$10.7FY2025
EBITDA per $100 of revenue was $21.5 in FY2021 and $26.1 in FY2025 (Cityfort calculation from the FY2023 and FY2025 10-Ks: pretax earnings plus interest, depreciation and amortization, as Gallagher reports no operating income line; quarters from the Q2 FY2025 to Q3 FY2026 earnings releases).
Net margin: $ of net income per $100 of revenue
See the numbers
Free cash flow
$1.8BFY2025
Free cash flow (Cityfort calculation from the FY2023 and FY2025 10-Ks: operating cash flow minus capital expenditures) fell from $2.44 billion in FY2024 to $1.79 billion in FY2025. FY2025 operating cash flow included $491 million of earnout payments (later payments to sellers of bought firms) above original estimates.
US$ · cash from operations minus spending on plants and equipment
See the numbers
See all yearly numbers
EBITDA here = operating income plus depreciation and amortization (from the cash flow statement). Fiscal years are the company's own: Fiscal year ends Dec 31 (calendar year). Net income is the share belonging to the company's owners.
Learn: Fiscal years that don't end in December: Nvidia's FY2027 explained · Stock-based compensation and dilution: pay that becomes shares
Sources (20)
- Form 10-K for FY2021
- Form 10-K for FY2023
- Form 10-K for FY2022
- Form 10-K for FY2024
- Form 10-K for FY2025
- Form 10-Q for Q1 FY2024
- Form 10-Q for Q2 FY2024
- Q2 2025 earnings release (8-K Exhibit 99.1)
- Form 10-Q for Q3 FY2024
- Q3 2025 earnings release (8-K Exhibit 99.1)
- Q4 2025 earnings release (8-K Exhibit 99.1)
- Form 10-Q for Q1 FY2025
- Q1 2026 earnings release (8-K Exhibit 99.1)
- Form 10-Q for Q2 FY2025
- Form 10-Q for Q2 FY2026
- Q2 2026 earnings release (8-K Exhibit 99.1)
- Form 10-Q for Q3 FY2025
- Q3 2026 earnings release (8-K Exhibit 99.1)
- Form 10-Q for Q1 FY2026
- Form 10-Q for Q3 FY2026
07Who runs it
Who runs Gallagher, and did they deliver?
J. Patrick Gallagher, Jr.
Chairman and Chief Executive Officer · since 1995
CEO since 1995 and Chairman since 2006; he was also President from 1990 to 2024. The 2026 proxy says the President is his brother and the COO is his son.
Thomas J. Gallagher
President · since 2024
Ran the global property/casualty brokerage business from 2017 to 2024.
Patrick M. Gallagher
Executive Vice President and Chief Operating Officer · since 2024
Earlier ran the property/casualty brokerage business in the Americas (2021 to 2024).
Douglas K. Howell
Chief Financial Officer · since 2003
Ralph Nicoletti
Lead Independent Director · since 2026
Elected after David Johnson, lead director since 2016, died on Jul 22, 2026; the board went from nine to eight members.
Kyle G. Koreyva
Controller and Chief Accounting Officer · since 2026
Succeeded Richard Cary on Oct 1, 2026, per an 8-K filed Aug 27, 2026; he joined Gallagher with AssuredPartners.
What they said, and what happened
1 partly delivered
Said on Dec 7, 2024
Agreed on Dec 7, 2024 to buy AssuredPartners (Dolphin TopCo, Inc.) for $13.45 billion, with the deal expected to close in the first quarter of 2025.
Partly deliveredWhat happened
The purchase closed on Aug 18, 2025, later than the expected first quarter of 2025, for $13.8 billion in cash after customary adjustments.
08What could go wrong
What could go wrong for Gallagher?
- Execution
Fitting in the largest deal in its history
AssuredPartners, bought for $13.8 billion in Aug 2025, is the largest acquisition in Gallagher's history. The 10-K says larger deals are more complex to integrate, including technology systems, and targets that miss plans can lead to goodwill impairment charges. Goodwill was $22.6 billion at Dec 31, 2025.
Watch Organic growth and integration costs in each earnings release; any goodwill impairment charge.
- Debt
More debt and interest cost
Corporate borrowings were $12.7 billion at Dec 31, 2025. Interest expense rose to $639 million in FY2025 from $381 million in FY2024, and the 10-K says a credit rating downgrade would raise financing costs.
Watch Debt and interest expense in each 10-Q; any rating agency action.
- Pricing
Insurance prices and less predictable insurer payments
The 10-K says falling premiums or other adverse insurance trends could hurt profitability. Contingent and supplemental revenues from insurers, $790 million in FY2025, are less predictable than commissions.
Watch Renewal premium comments and organic growth in the quarterly earnings releases.
- Other
Lower interest rates
The 10-K says lower rates cut what Gallagher earns on its own cash, on client funds it holds and on premium finance. Interest, premium finance and other income was $769 million in FY2025.
Watch The interest income, premium finance and other income line in each quarter.
- Legal
IRS micro-captive investigations
The IRS has investigated Gallagher's micro-captive advisory businesses since 2013, including whether it acted as an organizer or seller of tax shelters, and runs a related criminal investigation in which Gallagher says it is not a target. The 10-K gives no loss estimate; it says that for such matters an estimate is not possible or is immaterial.
Watch The litigation, regulatory and taxation note in each 10-Q.
- Execution
Brokers and pay costs
Pay was 56% of FY2025 revenue. The 10-K says Gallagher has lost key brokers with their clients to competitors before, and that sustained rises in pay and benefit costs could reduce profitability.
Watch Compensation as a share of revenue in each earnings release.
09Supporters vs. critics
What do supporters and critics point to?
What supporters point to
- Brokerage organic revenue, which leaves out acquired revenue, grew 6% in FY2025 and 5% in Q3 FY2026, per Gallagher's filings.
- EBITDA per $100 of revenue rose from $21.5 in FY2021 to $26.1 in FY2025 (Cityfort calculation from the 10-Ks).
- No client is large: the biggest was about 1% and the ten largest about 3% of FY2025 brokerage and risk management revenue.
- The dividend rose from $2.20 a share in FY2023 to $2.60 in FY2025, and was $0.70 a quarter in 2026.
- Risk management revenue before reimbursements rose to $457 million in Q3 FY2026 from $402 million a year earlier.
What critics point to
- Diluted EPS fell from $6.50 in FY2024 to $5.74 in FY2025, while average shares rose to 256.1 million from 220.5 million.
- Corporate borrowings were $12.7 billion at Dec 31, 2025, and interest expense rose to $639 million in FY2025 from $381 million.
- Goodwill and intangibles of $33.3 billion at Dec 31, 2025 were more than shareholders' equity of $23.3 billion.
- Free cash flow fell from $2.44 billion in FY2024 to $1.79 billion in FY2025 (Cityfort calculation from the 10-Ks).
- The IRS has investigated Gallagher's micro-captive advisory businesses since 2013; the FY2025 10-K gives no loss estimate and says that for such matters an estimate is not possible or is immaterial.
10What to watch next
What should you watch next at Gallagher?
Next event
Q4 FY2026 results
Date not announced yet.
AssuredPartners integration
The 10-K says larger deals are harder to integrate and can lead to goodwill impairment; goodwill was $22.6 billion at Dec 31, 2025.
Organic growth
Brokerage organic revenue grew 5% in Q3 FY2026, against 6% for FY2025; reported growth includes acquired firms.
Debt and interest cost
Senior notes and note purchase agreement borrowings were $12,233 million at Sep 30, 2026; interest expense was $639 million in FY2025.
Interest income on client funds
Interest, premium finance and other income was $769 million in FY2025; the 10-K says lower rates reduce it.
11Key facts
Key facts about Gallagher
- What does Gallagher do?
- Arthur J. Gallagher & Co. is an insurance broker based in Rolling Meadows, Illinois. It helps businesses and other organizations buy insurance and reinsurance, advises on employee benefits, and handles claims for self-insured companies; it does not carry the insurance risk itself.
- How does Gallagher make money?
- Arthur J. Gallagher & Co. earns commissions that insurers pay as a percentage of each premium, fees that clients pay instead of commissions, and claims-handling fees. In FY2025 brokerage was 87.4% of its revenue and the risk management (claims) segment 12.5%.
- Who are Gallagher's customers?
- Arthur J. Gallagher & Co.'s clients are businesses, nonprofits and public bodies buying insurance, insurers buying reinsurance, other brokers using its wholesale arm, and self-insured companies needing claims handled. In FY2025 its largest client was about 1% and its ten largest about 3% of brokerage and risk management revenue.
- How big is Gallagher?
- Arthur J. Gallagher & Co. reported revenue of $13.94 billion and net income of $1.49 billion in FY2025, up from $11.55 billion and $1.46 billion in FY2024. It had about 72,000 employees at Dec 31, 2025.
- Who owns Gallagher?
- Arthur J. Gallagher & Co. has one class of common stock and no controlling holder. Its directors and executive officers held 1.4% at Mar 16, 2026, per the 2026 proxy, which lists The Vanguard Group as the largest holder at 9.9% (Schedule 13GA filing by anyone who owns more than 5% of a company's shares and does not seek control. Learn more/A filed Feb 13, 2024).
- Where does Gallagher earn its revenue?
- Arthur J. Gallagher & Co. earned 67.4% of FY2025 revenue in the United States, 17.8% in the United Kingdom and 4.2% in Australia, with the rest from Canada, New Zealand and other countries.
- What was Gallagher's largest acquisition?
- Arthur J. Gallagher & Co. completed the purchase of AssuredPartners on Aug 18, 2025 for about $13.8 billion in cash, the largest acquisition in its history, after about 780 acquisitions from 2002 to 2025.
- Does Gallagher pay a dividend?
- Arthur J. Gallagher & Co. paid dividends of $2.60 a share for FY2025, up from $2.40 in FY2024 and $2.20 in FY2023, and declared $0.70 a share in each of the first three quarters of 2026.
Terms on this page
- Capital expenditures (capex)
- Customer concentration
- Debt-to-equity
- Earnings per share (EPS)
- EBITDA
- Free cash flow
- Net debt
- Net margin
- Revenue vs net income
- Stock buyback
Each explains the term in plain English, with the same number from other companies on Cityfort.
Go deeper
More detail from the same filings. Open any section.
12What it sells
12What it sells
What does Gallagher sell?
Retail insurance brokerage
Finds and negotiates property, liability, auto, cyber, health and other cover for clients. It was 75% of brokerage revenue in FY2025, and about 74% of retail revenue came through industry teams such as construction, healthcare and education.
Employee benefits consulting
Advises employers on health, retirement and other staff benefit plans and on pay, and runs some of those programs.
Reinsurance brokerage (Gallagher Re)
Helps insurance companies buy insurance for themselves (reinsurance). It was 12% of brokerage revenue in FY2025, from more than 77 offices in 27 countries.
Wholesale brokerage and agency programs
Places specialized and hard-to-place cover for its own and other brokers. It was 13% of brokerage revenue in FY2025, and more than 75% of it came from brokers outside Gallagher.
Claims administration (risk management segment)
Handles workers' compensation, liability and property claims for self-insured companies and insurers. Workers' compensation claims were 59% of this segment's FY2025 revenue.
Think of it like this
Like a real-estate agent for insurance: it does not own the policy, it finds the right one and earns a commission or fee for the work.
What it does
- Does: Earns commissions from insurers, set as a percentage of the premium the client pays
- Does: Charges fees to clients, often instead of a commission
- Does: Settles and administers claims for a fee
- Does: Earns interest on client premiums it holds before passing them to insurers
What it does not do
- Does not: Does not carry insurance losses on its own books, apart from amounts the 10-K calls de minimis
- Does not: Is not an insurance company: insurers and reinsurers provide the capital that pays claims
- Does not: Does not depend on any one client: the largest was about 1% of brokerage and risk management revenue in FY2025
Sources (1)
13How the money flows
13How the money flows · FY2025
How does money flow through Gallagher?
Money in
- Commissions from insurers$8.0B
- Fees from clients$4.2B
- Supplemental and contingent revenue from insurers$790M
- Interest income, premium finance and other$769M
- Reimbursed expenses$164M
The company
Gallagher
$13.9B came in
Money out
- Pay and benefits for staff$7.8B
- Offices, technology and other operating costs, reimbursed expenses and earnout changes$2.5B
- Depreciation and amortization$1.1B
- Interest on debt$639M
- Income tax$368M
- Minority owners' share of profit$9M
- Net income for Gallagher shareholders$1.5B
- Clients buy insurance through Gallagher, and insurers pay it a commission from each premium.
- Some clients pay fees instead, and claims-handling clients pay fees to the risk management arm.
- Gallagher also earns interest on premiums and claim money it holds for a short time.
- Staff pay takes the largest share: $7.84 billion of $13.94 billion in FY2025.
- After office costs, amortization of bought businesses, interest and tax, $1.49 billion was left for shareholders.
Sources (1)
14What it needs to run
14What it needs to run
What does Gallagher need to run?
Brokers and service staff
About 72,000 employees at Dec 31, 2025, 53% of them outside the US. Pay was 55% of brokerage and 61% of risk management revenue in FY2025.
Offices close to clients
More than 650 US sales and service offices and about 400 in some 60 other countries, plus more than 40 claims offices.
Insurers willing to write the cover
Insurers and reinsurers carry the risk and pay claims. Gallagher only places the cover, so it relies on their capital.
Money for acquisitions
Gallagher paid $15.77 billion in cash for acquisitions in FY2025. The FY2025 10-K says an $8.5 billion share sale and $5.0 billion of notes in 2024 paid for AssuredPartners.
Service centers in India
Gallagher Centers of Excellence in India provide client support and other services for its global operations, per the FY2025 10-K.
Sources (1)
15Where it sells
15Where it sells · FY2025
Where does Gallagher sell?
- United States67.4%
- United Kingdom17.8%
- Australia4.2%
- Canada2.8%
- New Zealand1.5%
- Other countries6.3%
Sources (1)
16Competitors and what protects it
16Competitors and what protects it
Who does Gallagher compete with?
Marsh & McLennan Companies
Insurance broker in the 2026 proxy peer group that Gallagher describes as its direct competitors for executive talent.
Aon plc
Insurance broker in the same 2026 proxy peer group.
Willis Towers Watson plc
Insurance broker in the 2026 proxy peer group. The FY2025 10-K says Gallagher bought Willis Towers Watson's treaty reinsurance brokerage, which it calls Willis Re.
Brown & Brown, Inc.
Also an insurance broker in the 2026 proxy peer group.
What protects the business
Each strength is scored 1 (weak) to 5 (strong) for the business, with the reason. It is not a rating of the share.
- Size and reach4 of 5
More than 650 US offices and about 400 abroad, with client service in about 130 countries through its own staff and partner brokers.
- Spread of clients5 of 5
The largest client was about 1% and the ten largest about 3% of brokerage and risk management revenue in FY2025.
- Industry know-how3 of 5
About 74% of retail brokerage revenue comes through industry teams, which the 10-K says Gallagher believes give it an edge.
- Acquisition record4 of 5
About 780 acquisitions from 2002 to 2025, mostly smaller regional or local brokers, typically bought for $1 million to $100 million each.
Weak spot
Brokers can leave with clients
The 10-K says Gallagher has lost key brokers and groups of brokers, with their clients and relationships, to competitors in the past.
17Where growth could come from
17Where growth could come from
Where could Gallagher's growth come from?
Gallagher gave no numeric revenue or earnings guidance in its 10-Qs or earnings releases. In the Q3 FY2026 release, Chairman and CEO J. Patrick Gallagher, Jr. said: "we remain very confident in our ability to create long-term value".
Organic growth
WorkingBrokerage organic +5%, Q3 FY2026
Organic revenue, which leaves out the first 12 months of acquired revenue and sold businesses, grew 5% in brokerage and 10% in risk management in Q3 FY2026.
Status: Working, on track against what the company said.
AssuredPartners
Working$13.8 billion, closed Aug 18, 2025
The largest purchase in Gallagher's history. Brokerage revenue before reimbursements was $3,473 million in Q3 FY2026, up from $2,922 million a year earlier (Q3 FY2026 earnings release).
Status: Working, on track against what the company said.
Smaller acquisitions
Working19 mergers, $209 million of yearly revenue, 9M FY2026
The 10-K lists mergers and acquisitions among its expected growth sources. In the first nine months of 2026 Gallagher closed 19 deals with $209 million of estimated annualized revenue, against 25 deals and $3,390 million in the same months of 2025, when AssuredPartners closed.
Status: Working, on track against what the company said.
Claims administration
WorkingRisk management revenue +14%, Q3 FY2026
The 10-K expects growth from insurers outsourcing claims work and from more Fortune 1000 clients. Revenue before reimbursements rose to $457 million in Q3 FY2026 from $402 million.
Status: Working, on track against what the company said.
Status compares progress with what the company itself said it would do: Working = on track against what the company said; Mixed = partly on track; Behind = behind the company's own plan; New = recently announced; Early = too early to judge.
18The company's own measures (non-GAAP)
18The company's own measures · FY2025 and Q3 FY2026 (quarter ended Sep 30, 2026)
What do Gallagher's own measures show?
Official (GAAP): Brokerage segment pretax earnings, FY2025
$2.8B
Company's own measure: Adjusted EBITDAC, brokerage segment, FY2025
$4.4B
EBITDAC is earnings before interest, taxes, depreciation, amortization and the change in earnout payables. The adjusted version also leaves out divestiture gains, integration and deal costs, and some legal, tax and currency items.
Official (GAAP): Brokerage segment pretax earnings, FY2025
2,759.0%
Company's own measure: Adjusted EBITDAC margin, brokerage segment, FY2025
36.5%
Adjusted EBITDAC ÷ adjusted brokerage revenue of $12,168 million; it was 35.1% in FY2024. FY2025 includes interest earned on the cash raised for AssuredPartners before the deal closed.
Official (GAAP): Brokerage segment revenue, FY2025
12,192.0%
Company's own measure: Organic revenue growth, brokerage segment, FY2025
6%
Organic revenue leaves out the first 12 months of revenue from acquisitions and revenue of sold businesses. Reported brokerage revenue rose 23%.
Official (GAAP): Risk management segment pretax earnings, FY2025
$249M
Company's own measure: Adjusted EBITDAC, risk management segment, FY2025
$336M
Same adjustments as brokerage; the adjusted margin was 21.2% against 20.7% in FY2024.
Official (GAAP): Net earnings, total company, Q3 FY2026
$406M
Company's own measure: Adjusted EBITDAC, total company, Q3 FY2026
$1.3B
The total-company figure, including the corporate segment, in the Q3 FY2026 earnings release. It was $1,013 million in Q3 FY2025.
Official (GAAP): Diluted EPS, Q3 FY2026
$1.55
Company's own measure: Adjusted diluted EPS, Q3 FY2026
$3.00
Gallagher's own adjusted EPS for the whole company. It was $2.31 in Q3 FY2025, when reported diluted EPS was $1.04.
These are the company's own measures, defined by the company. They are not comparable across companies, and they are not added together. Each sits beside the nearest official (GAAP) figure.
Learn: Non-GAAP measures: what a company's "adjusted" numbers leave out
19Financial strength and debt
19Financial strength · Dec 31, 2025
How much debt does Gallagher have?
- Total debt$12.7B
- Cash and investments$1.4B
- Net debt (debt minus cash)$11.3B
- Net worth (shareholders' money)$23.3B
- Debt to equity
- 0.55×
- $ of debt for every $1 of shareholders' money
- Net debt is a Cityfort calculation from the FY2025 10-K: corporate borrowings of $12,744 million ($640 million due within a year and $12,104 million later) minus cash of $1,396 million. It leaves out $226 million of premium financing debt.
- Debt-to-equity of 0.55 is a Cityfort calculation from the FY2025 10-K: corporate borrowings ÷ equity of $23,321 million belonging to Gallagher shareholders.
- Fiduciary assets of $26.9 billion are premiums and claim money Gallagher holds for clients and insurers; an equal $26.9 billion liability offsets them.
- Goodwill and amortizable intangibles, mostly from acquisitions, were $33.3 billion at Dec 31, 2025, more than equity of $23.3 billion (Cityfort calculation from the FY2025 10-K).
- Cash was $14,987 million at Dec 31, 2024, holding money raised for AssuredPartners, which closed in Aug 2025 for $13.8 billion.
- In Apr 2025 Gallagher raised its bank credit line from $1.7 billion to $2.5 billion and moved its maturity to Apr 3, 2030 (8-K filed Apr 4, 2025).
- Senior notes and note purchase agreement borrowings were $12,233 million at Sep 30, 2026, per the Q3 FY2026 10-Q.
20Who owns it
20Who owns it · ownership as of Mar 16, 2026
Who owns Gallagher?
- Officers and directors (as a group), shares
- 1.4%
Share classes
Holders of 5% or more
From the company's proxy statement (DEF 14A), later Schedule 13G filings and the share counts on its latest annual or quarterly report. Each holder row shows the date of its own filing.
Learn: How to read a proxy statement (DEF 14A): Nvidia's 2026 proxy · Form 4 insider filings: who files, the codes and the footnotes
21What it does with profit
21What it does with profit
What does Gallagher do with its profit?
Dividend per share
$2.60FY2025
Dividend paid for each share, by financial year.
$ per share
See the numbers
Buyback · Sep 30, 2026
First nine months of 2026: bought back 2.7 million shares for $580 million, under a plan approved in July 2021 for up to $1.5 billion.
$580M
Sources (2)
22Governance signals
22Governance signals
What do Gallagher's governance filings show?
- Auditor
- Ernst & Young LLP, since 1973
- Auditor changes
- None in the period covered
- Audit qualifications
- None reported
- Related-party dealings
- The 2026 proxy lists Gallagher family members employed in 2025. President Tom Gallagher is the CEO's brother and COO Patrick Gallagher is the CEO's son. Other relatives of the CEO and of Tom Gallagher also worked at Gallagher; Tom Gallagher's son, a branch manager in the brokerage segment, received total compensation of $1,137,321.
- Credit rating
- Not checked for this page
Flags to know about
regulatory
IRS investigation of micro-captive advice business
The FY2025 10-K says the IRS has investigated Gallagher's IRC 831(b) micro-captive advisory businesses since 2013, including whether Gallagher acted as an organizer or seller of tax shelters. The IRS also runs a criminal investigation related to micro-captive insurers; Gallagher says it was advised it is not a target and is cooperating with both.
related party
Family members in senior roles
The CEO's brother is President and his son is COO; the 2026 proxy discloses other relatives employed in 2025 and says the Compensation Committee approved the officers' pay.
other
Chairman and CEO are the same person
J. Patrick Gallagher, Jr. has been CEO since 1995 and Chairman since 2006. The board has a lead independent director, Ralph Nicoletti since Jul 2026.
23How it got here
23How it got here
How did Gallagher get here?
1927
Milestone
Founded as a one-person agency
Gallagher began as a one-person insurance agency, per the FY2025 10-K.
1972
Milestone
Reincorporated in Delaware
The company became a Delaware corporation; its head office is in Rolling Meadows, Illinois.
2002
Business-model change
Buying brokers becomes the growth model
From 2002 to 2025 Gallagher completed about 780 acquisitions, mostly smaller regional or local brokers and benefit consultants.
2021
Business-model change
Clean coal tax credits end
Gallagher generated $1,706 million of IRC Section 45 tax credits from 2009 to 2021; clean coal revenue was $1,140.8 million in FY2021 and $23.0 million in FY2022.
2024
Milestone
Raises money for AssuredPartners
Agreed on Dec 7, 2024 to buy AssuredPartners for $13.45 billion, then raised $8.5 billion from new shares and $5.0 billion of senior notes in Dec 2024.
2025
Milestone
Woodruff Sawyer bought
Bought Woodruff Sawyer on Apr 10, 2025 for $1.2 billion, paid from cash on hand.
2025
Business-model change
AssuredPartners closes
Completed the $13.8 billion AssuredPartners purchase on Aug 18, 2025, its largest acquisition; FY2025 revenue rose to $13.94 billion.
24Sources and changes
Where every number on this page comes from
Sources (25 documents)
- S1Form 10-Q for Q3 FY2026 · SEC EDGAR · Tier 1: company or exchange filing · Nov 5, 2026
- S2Form 10-Q for Q2 FY2026 · SEC EDGAR · Tier 1: company or exchange filing · Aug 5, 2026
- S3Form 10-Q for Q1 FY2026 · SEC EDGAR · Tier 1: company or exchange filing · May 7, 2026
- S4Form 10-K for FY2025 · SEC EDGAR · Tier 1: company or exchange filing · Feb 17, 2026
- S5Form 10-Q for Q3 FY2025 · SEC EDGAR · Tier 1: company or exchange filing · Nov 10, 2025
- S6Form 10-Q for Q2 FY2025 · SEC EDGAR · Tier 1: company or exchange filing · Aug 1, 2025
- S7Form 10-Q for Q1 FY2025 · SEC EDGAR · Tier 1: company or exchange filing · May 2, 2025
- S8Form 10-K for FY2024 · SEC EDGAR · Tier 1: company or exchange filing · Feb 18, 2025
- S9Form 10-Q for Q3 FY2024 · SEC EDGAR · Tier 1: company or exchange filing · Oct 29, 2024
- S10Form 10-Q for Q2 FY2024 · SEC EDGAR · Tier 1: company or exchange filing · Jul 26, 2024
- S11Form 10-Q for Q1 FY2024 · SEC EDGAR · Tier 1: company or exchange filing · May 1, 2024
- S12Form 10-K for FY2023 · SEC EDGAR · Tier 1: company or exchange filing · Feb 9, 2024
- S13Form 10-K for FY2022 · SEC EDGAR · Tier 1: company or exchange filing · Feb 10, 2023
- S14Form 10-K for FY2021 · SEC EDGAR · Tier 1: company or exchange filing · Feb 18, 2022
- S15Q3 2026 earnings release (8-K Exhibit 99.1) · SEC EDGAR · Tier 1: company or exchange filing · Oct 29, 2026
- S16Q2 2026 earnings release (8-K Exhibit 99.1) · SEC EDGAR · Tier 1: company or exchange filing · Jul 30, 2026
- S17Q1 2026 earnings release (8-K Exhibit 99.1) · SEC EDGAR · Tier 1: company or exchange filing · Apr 30, 2026
- S18Q4 2025 earnings release (8-K Exhibit 99.1) · SEC EDGAR · Tier 1: company or exchange filing · Jan 29, 2026
- S19Q3 2025 earnings release (8-K Exhibit 99.1) · SEC EDGAR · Tier 1: company or exchange filing · Oct 30, 2025
- S20Q2 2025 earnings release (8-K Exhibit 99.1) · SEC EDGAR · Tier 1: company or exchange filing · Jul 31, 2025
- S212026 proxy statement (DEF 14A) · SEC EDGAR · Tier 1: company or exchange filing · Mar 23, 2026
- S228-K: amended and restated credit agreement (Items 1.01, 2.03) · SEC EDGAR · Tier 1: company or exchange filing · Apr 4, 2025
- S238-K: completion of the AssuredPartners acquisition (Item 2.01) · SEC EDGAR · Tier 1: company or exchange filing · Aug 18, 2025
- S248-K: Lead Independent Director (Item 8.01) · SEC EDGAR · Tier 1: company or exchange filing · Jul 29, 2026
- S258-K: Controller and Chief Accounting Officer change (Item 5.02) · SEC EDGAR · Tier 1: company or exchange filing · Aug 27, 2026
Changes to this page (v1 · Nov 20, 2026)
- v1 · Nov 20, 2026First version. (first version)
Numbers come only from tier 1 and tier 2 sources. Read how we research.
Disclaimer
For learning only. Cityfort is not a registered investment adviser or broker-dealer and does not recommend buying or selling any security. Prices shown are dated and may be out of date.
Investing in securities involves risk, including loss of capital. Before making any investment decision, do your own research and consider consulting a registered investment adviser or other qualified professional.
Cityfort, its owners and contributors may or may not hold securities of companies covered. Cityfort is not paid by any company it covers. Content is not an offer or solicitation to buy or sell any security, including in any initial public offering.
Read the positions policyRead the full disclaimerHide the full disclaimer
Cityfort publishes general educational content that explains how listed companies work. Cityfort is not registered with the US Securities and Exchange Commission or any state securities regulator as an investment adviser, and is not a broker-dealer or a member of FINRA. Cityfort does not provide investment, tax or legal advice, recommendations, ratings, price targets or any opinion on whether to buy, sell or hold any security. Nothing on the site is tailored to any person's circumstances.
All information is taken from publicly available sources, mainly company filings with the SEC, which are listed on each page with dates. We work to keep it accurate and correct errors publicly, but we do not guarantee that it is complete, accurate or up to date. Any market price or price-based ratio shown is dated, may be out of date by the time you read it, and is included only to explain concepts.
Statements by company management, including forward-looking statements and guidance, are reported as the company's statements, with their date and source; they are not our forecasts. Adjusted (non-GAAP) figures are the company's own measures and are shown next to the official (GAAP) figures.