Financials · NASDAQ: IBKR
Interactive Brokers: how the business works
Interactive Brokers runs an online brokerage for individuals and investment firms, with 5.58 million accounts at Sep 30, 2026, and earned $6,205M of net revenues in FY2025.
By Hardik Bhandare · Checked against filings: . Editorial policy. Corrections
Follow Interactive Brokers
Email me when Interactive Brokers's page is updated after earnings.
We'll send a confirmation email first. See our privacy policy.
Interactive Brokers Group, Inc. · Greenwich, Connecticut · Founded 1977
Updated for Q3 FY2026 · checked
- Net revenues, FY2025
- $6,205M
- Net income to Class A stockholders, FY2025
- $984M
- Customer accounts, Sep 30, 2026
- 5.58 million
- Customer equity, Sep 30, 2026
- $964.7B
- Employees, Dec 31, 2025
- 3,182
The short version
Interactive Brokers in 5 points
1 · What it sells
Interactive Brokers runs an online brokerage where customers trade on more than 170 exchanges and market centers in 40 countries, with 5.58 million accounts at Sep 30, 2026.
2 · Who pays it
In FY2025, 57.4% of net revenues was net interest income, 34.6% commissions, 4.7% other fees and services and 3.3% other income.
3 · What it keeps from $100
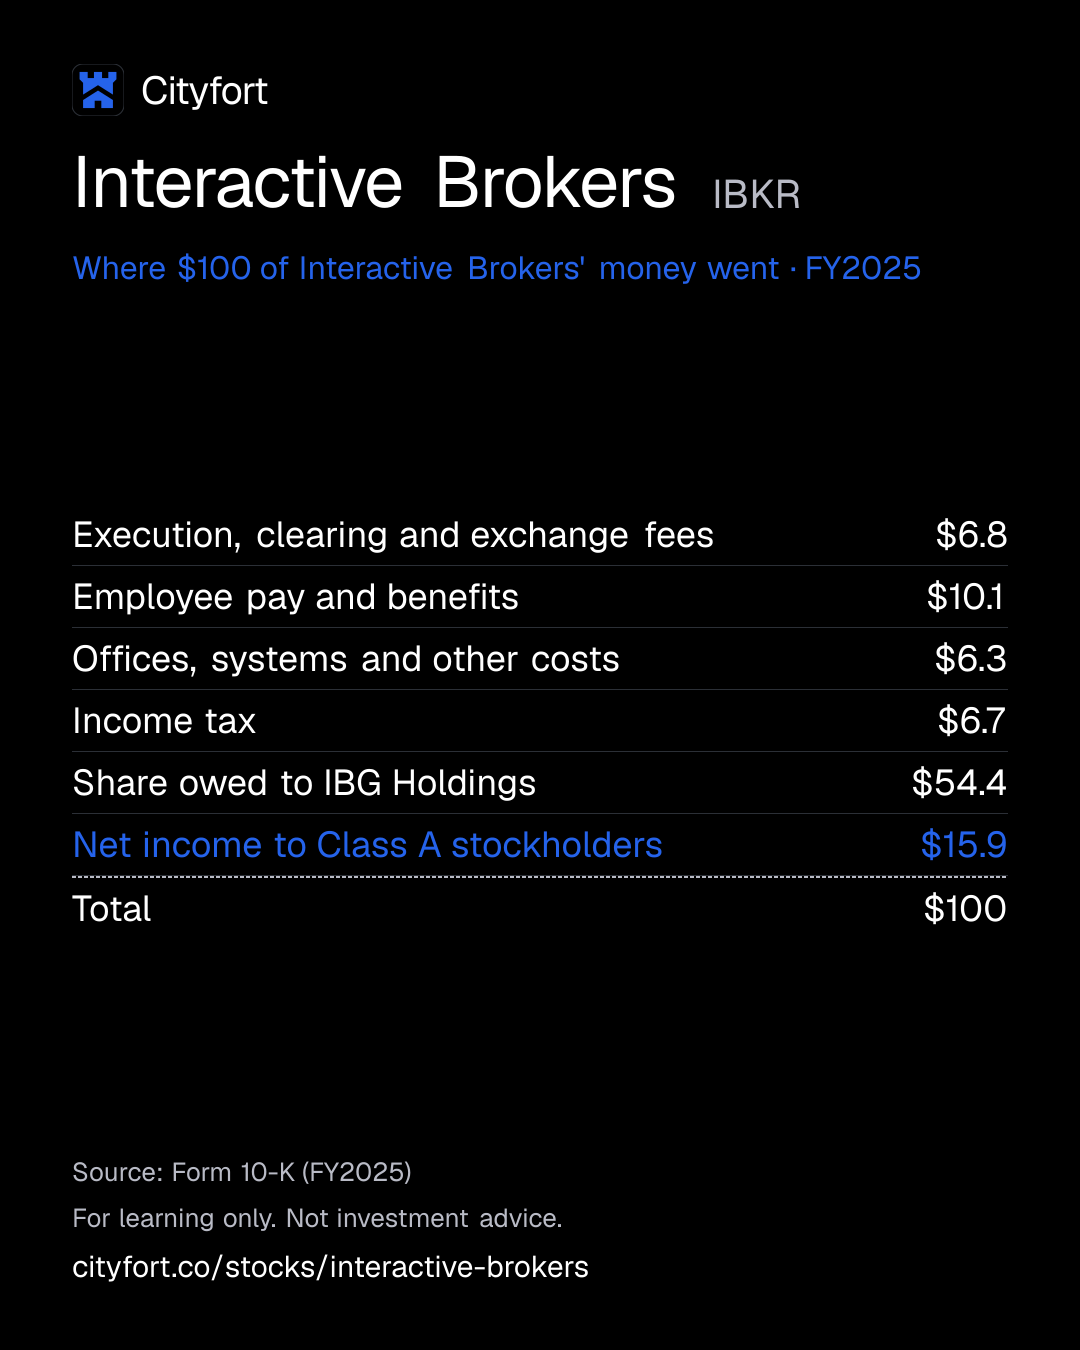
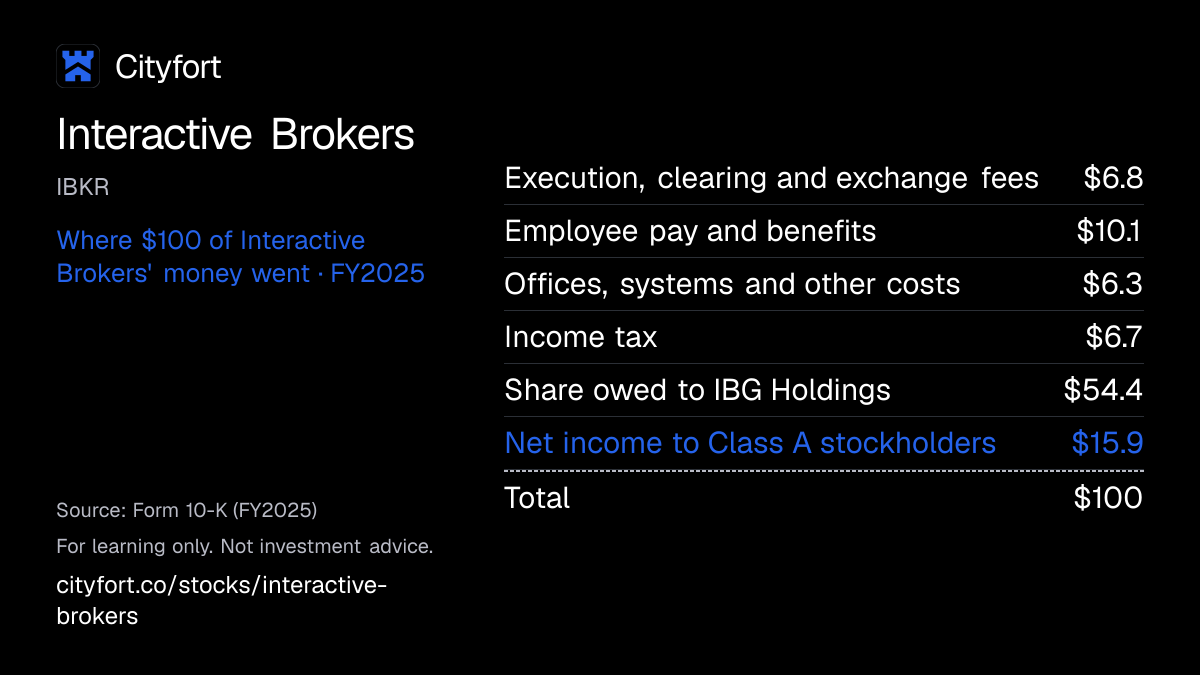
Of every $100 of FY2025 net revenues, $54.4 was IBG Holdings LLC's share and $15.9 was net income to Class A stockholders; net income includes $202M of other income, mostly $197M of gains from principal transactions (the currency strategy lost $4M), and the company reports no operating income line, only pretax income of $4.8B ($4.7B on the company's adjusted basis).
4 · Where the operating profit comes from
Interactive Brokers reports one segment, brokerage, which brought in all $6,205M of FY2025 net revenues; 69.7% was booked in the United States.
5 · The one thing to watch
Net interest margin fell to 1.99% in Q3 FY2026 from 2.16% a year earlier, while margin loans reached $105.2B at Sep 30, 2026, up 36% from a year earlier.
Sources: From Interactive Brokers' FY2025 10-K and Q3 FY2026 earnings release (Oct 15, 2026) · checked
01Where the money goes · FY2025
Where does $100 of Interactive Brokers' money go?
Interactive Brokers · FY2025
Receipt for every $100
| Execution, clearing and exchange fees | $6.8 |
|---|---|
| Employee pay and benefits | $10.1 |
| Offices, systems and other costs | $6.3 |
| Income tax | $6.7 |
| Share owed to IBG Holdings | $54.4 |
| Net income to Class A stockholders | $15.9 |
| Total | $100 |
Each line = amount ÷ total money in × 100. Lines may not add to exactly $100 because of rounding.
How this is worked out
Cityfort calculation from the FY2025 10-K: each line divided by total net revenues of $6,205M.
Save this receipt as an image
Embed this receipt or the key numbers
Paste this code into a blog or website to show the card you choose, with a link back to this page.
Each week: the next company due to report earnings, explained in 5 points.
No tips. Unsubscribe anytime.
We'll send a confirmation email. See our privacy policy.
02The business in one line
What does Interactive Brokers do?
Traders and firms pay Interactive Brokers commissions and interest on margin loans, and it earns interest on their cash. Staff pay is its biggest expense after the interest it pays out, and most of the profit belongs to the founder's holding company.
- In FY2025, net interest income was $3,563M and commissions were $2,149M, out of $6,205M of net revenues.
- Of every $100 of FY2025 net revenues, staff pay took $10.1, IBG Holdings LLC's share was $54.4 and Class A stockholders kept $15.9.
03Who pays it
Who pays Interactive Brokers?
Interactive Brokers does not disclose how much each type of customer pays.
Individual investors and traders
Pay commissions, margin interest and fees. Customers live in over 200 countries and territories.
Investment firms
Hedge funds, mutual funds, investment advisors and proprietary trading firms use it for trading, custody and financing.
Introducing brokers and banks
Other brokers and banks that need global market access use its platform for their own customers.
Where its revenue came from · FY2025
- United States69.7%
- International (booking subsidiary outside the US)30.3%
How spread out the customers are
The company says no single customer was more than 2% of its FY2025 commissions. It served about 4.4 million accounts at the end of 2025 and does not split revenue by customer type.
04How it makes money
How does Interactive Brokers make money?
Automation keeps costs low, so most extra revenue becomes pretax profit.
The company says decades of automating trading and back-office work made it one of the lowest-cost broker-dealers. In FY2025, net revenues rose 19.7% while non-interest costs fell from $1,490M to $1,434M (Cityfort calculation from the FY2025 10-K).
Pretax profit per $100 of net revenues
$65.8$76.9
FY2021 to FY2025
- Low commissions and financing costs draw active traders and firms
- More accounts bring more trades and bigger cash and loan balances
- Commissions and net interest income rise
- Automated systems handle the extra volume
- Pretax profit per $100 of net revenues rises
↺ Step 5 feeds back into step 1.
05Business segments · FY2025
Which businesses make up Interactive Brokers?
Brokerage
100%The only reported segment: trading, lending and custody are managed together by the CEO and President.
Revenue $6.2B ($6,205M)
How the mix changed
- Brokerage
Revenue by segment, FY2023 to FY2025.
US$
See the numbers
06The numbers · Consolidated · US$
How has Interactive Brokers done?
Revenue
$6.2BFY2025
Total net revenues, which are after interest the company pays out, rose every year from $2,714M in FY2021 to $6,205M in FY2025.
US$
See the numbers
Net income
$984MFY2025
Net income to Class A stockholders rose from $308M in FY2021 to $984M in FY2025, while total net income, mostly owed to IBG Holdings LLC, was $4,357M.
US$
See the numbers
Net income for every $100 of revenue
$15.9FY2025
Class A stockholders kept $15.9 per $100 of net revenues in FY2025, up from $11.3 in FY2021. The company reports no operating income line, so EBITDA here is pretax income plus depreciation and amortization (Cityfort calculation from the FY2023 and FY2025 10-Ks).
Net margin: $ of net income per $100 of revenue
See the numbers
Free cash flow
$15.7BFY2025
Operating cash flow of $15,811M in FY2025 mostly reflects customer cash and margin loan balances, so free cash flow here is not cash free for shareholders.
US$ · cash from operations minus spending on plants and equipment
See the numbers
See all yearly numbers
EBITDA here = operating income plus depreciation and amortization (from the cash flow statement). Fiscal years are the company's own: Fiscal year ends December 31. Net income is the share belonging to the company's owners. Total net income differs from net profit to the company's owners: Net income to Class A stockholders; total net income includes the share of IBG Holdings LLC, which owns about 73.7% of the operating company.
Learn: Stock-based compensation and dilution: pay that becomes shares
Sources (12)
- Annual report FY2023 (10-K)
- Annual report FY2025 (10-K)
- Annual report FY2024 (10-K)
- Quarterly report Q2 FY2025 (10-Q)
- Quarterly report Q3 FY2025 (10-Q)
- Earnings release Q4 FY2025 (8-K Ex. 99.1)
- Earnings release Q4 FY2024 (8-K Ex. 99.1)
- Quarterly report Q1 FY2025 (10-Q)
- Quarterly report Q1 FY2026 (10-Q)
- Quarterly report Q2 FY2026 (10-Q)
- Quarterly report Q3 FY2026 (10-Q)
- Earnings release Q3 FY2026 (8-K Ex. 99.1)
07Who runs it
Who runs Interactive Brokers, and did they deliver?
Thomas Peterffy
Founder and Chairman · since 2006
Started the market-making business in 1977 and was CEO until Sep 2019. He is paid a salary only: $591,500 in 2025, with no bonus.
Milan Galik
CEO and President · since 2019
Joined the company in 1990.
Paul J. Brody
CFO, Treasurer and Secretary · since 2006
Joined the company in 1987.
Earl H. Nemser
Vice Chairman
Director and chair of the Nominating and Governance Committee.
Thomas A. Frank
Executive Vice President
One of the five named executive officers for 2025.
What they said, and what happened
1 delivered
Said on Feb 27, 2026
The FY2025 10-K said the company intends to pay quarterly dividends of $0.08 per share for the foreseeable future.
DeliveredWhat happened
It declared $0.0875 per share with Q1 FY2026 results and $0.15 with Q3 FY2026 results.
08What could go wrong
What could go wrong for Interactive Brokers?
- Pricing
Profit depends on interest rates
Net interest income was 57.4% of FY2025 net revenues (Cityfort calculation from the FY2025 10-K). The company says lower benchmark rates can reduce it.
Watch Net interest margin each quarter (1.99% in Q3 FY2026).
- Demand
Revenue swings with trading volume
The 10-K says revenue depends on trading activity and interest rate levels, so results can vary a lot from period to period.
Watch Daily average revenue trades (4.27M in Q3 FY2026, 4.82M in Q2 FY2026).
- Competition
Competition, including zero-commission brokers
The 10-K lists prime brokers, online brokers, zero-commission brokers and software vendors as rivals. Brokers that use its technology could build their own.
Watch Commission per order and account growth in the earnings releases.
- Technology
System failures and cyber attacks
The company runs on its own software and says it does not have fully redundant systems. A cyber attack could disrupt service or expose data.
Watch Outages or cybersecurity incidents disclosed in 10-Qs and 8-Ks.
- Governance
One founder controls the votes
Through IBG Holdings and its Class B shares, Thomas Peterffy controls about 73.7% of the votes. Class A holders cannot outvote him.
Watch Holdings' share of IBG LLC each quarter (73.4% at Sep 30, 2026).
- Execution
Reliance on key people
The 10-K says losing key executives or technology staff could materially hurt the business. The founder and Chairman was 81, the 2026 proxy statementThe yearly filing about shareholder votes, the board and executive pay. Learn more says.
Watch Leadership changes reported in 8-Ks and the proxy statement.
- Regulation
Rules for event contracts are unsettled
The 10-K says new laws, enforcement or litigation could stop ForecastEx listing, or its brokers offering, some event contracts.
Watch Regulatory actions on event contracts disclosed in filings.
09Supporters vs. critics
What do supporters and critics point to?
What supporters point to
- Customer accounts rose from 3.34 million at Dec 31, 2024 to 5.58 million at Sep 30, 2026.
- Net revenues grew each year from $2,714M in FY2021 to $6,205M in FY2025.
- Pretax profit per $100 of net revenues rose from $65.8 in FY2021 to $76.9 in FY2025.
- At Dec 31, 2025, borrowings were $19M against $4,963M of cash, and operating subsidiaries held $14.1B of capital above regulatory minimums.
- In October 2026 the quarterly dividend was raised to $0.15 per share from $0.0875.
What critics point to
- Thomas Peterffy controls about 73.7% of the votes, and as a Nasdaq "controlled company" Interactive Brokers is not required to have a majority-independent board.
- Net interest income was 57.4% of FY2025 net revenues, and the company says lower benchmark rates can reduce it.
- Net interest margin was 1.99% in Q3 FY2026, down from 2.16% a year earlier.
- Daily average revenue trades fell from 4.82M in Q2 FY2026 to 4.27M in Q3 FY2026.
- The 10-K says the company does not have fully redundant systems for the software it runs on.
10What to watch next
What should you watch next at Interactive Brokers?
Next event
Q4 FY2026 results
Date not announced yet.
Net interest margin
It was 1.99% in Q3 FY2026, down from 2.16% a year earlier; net interest income was 57.4% of FY2025 net revenues.
Account growth
Accounts reached 5.58 million at Sep 30, 2026, up from 5.19 million at Jun 30, 2026.
Trading activity
Daily average revenue trades were 4.27M in Q3 FY2026, down from 4.82M in Q2 FY2026 and up 18% from a year earlier.
Rules for event contracts
The 10-K says new laws, enforcement or litigation could stop ForecastEx listing some event contracts.
11Key facts
Key facts about Interactive Brokers
- What does Interactive Brokers do?
- Interactive Brokers Group runs an online brokerage. Through its own software, customers trade stocks, options, futures, currencies, bonds and funds on more than 170 exchanges and market centers in 40 countries.
- How does Interactive Brokers make money?
- In FY2025, Interactive Brokers' $6,205M of net revenues was 57.4% net interest income ($3,563M), 34.6% commissions ($2,149M), 4.7% other fees and services ($291M) and 3.3% other income ($202M) (Cityfort calculation from the FY2025 10-K).
- Who are Interactive Brokers' customers?
- Interactive Brokers serves individual investors and traders in over 200 countries and territories, plus hedge funds, mutual funds, investment advisors, proprietary trading firms and introducing brokers. No single customer was more than 2% of its FY2025 commissions.
- How big is Interactive Brokers?
- Interactive Brokers earned $6,205M of net revenues in FY2025, up from $5,185M in FY2024. Its net income to Class A stockholders was $984M in FY2025, up from $755M in FY2024.
- How many accounts does Interactive Brokers have?
- Interactive Brokers had 5.58 million customer accounts at Sep 30, 2026, up from 3.34 million at Dec 31, 2024. Customer equity in those accounts was $964.7B at Sep 30, 2026.
- Why is Interactive Brokers' net income to Class A stockholders smaller than its total net income?
- Interactive Brokers Group, the listed company, owned about 26.3% of the operating company IBG LLC at Dec 31, 2025. Of Interactive Brokers' FY2025 total net income of $4,357M, $3,373M belonged to IBG Holdings LLC and $984M to Class A stockholders.
- Who owns Interactive Brokers?
- Founder Thomas Peterffy controls about 73.7% of Interactive Brokers' votes through IBG Holdings LLC and its 400 Class B shares, the 2026 proxy statement says. Vanguard held 11.39% and BlackRock 6.2% of Class A shares at Dec 31, 2025; directors and officers held 2.80% at Mar 9, 2026.
- Does Interactive Brokers pay a dividend?
- Interactive Brokers has paid a quarterly cash dividend since 2011. Its dividends declared per Class A share in 2025 came to $0.30 after the split, and in October 2026 it raised the quarterly dividend to $0.15 from $0.0875.
Terms on this page
- Capital expenditures (capex)
- Debt-to-equity
- Dividend payout ratio
- Earnings per share (EPS)
- EBITDA
- Free cash flow
- Net debt
- Net margin
- Revenue vs net income
Each explains the term in plain English, with the same number from other companies on Cityfort.
Go deeper
More detail from the same filings. Open any section.
12What it sells
12What it sells
What does Interactive Brokers sell?
IBKR Pro
Trading account that charges a commission per trade and sends orders through the company's IB SmartRouting system.
IBKR Lite
Commission-free trades in US-listed stocks and ETFs. The company is paid instead by market makers and others who handle those orders.
Margin loans and cash balances
Customers can borrow against their investments, and the company earns interest on margin loans and on customer cash it holds.
Services for firms
Custody, clearing and trading for hedge funds, mutual funds, ETFs, investment advisors, proprietary trading groups and introducing brokers.
IBKR ForecastTrader
Web platform for trading event contracts listed by ForecastEx, a CFTC-registered exchange the company owns.
Think of it like this
Like a toll booth on trading: customers paid about $2.68 in commission per cleared order in FY2025, and it also earns interest on their cash and loans.
What it does
- Does: Executes and settles trades in stocks, options, futures, currencies, bonds, funds and precious metals
- Does: Lends money to customers against their investments (margin loans)
- Does: Holds customer cash and securities in custody
- Does: Runs ForecastEx, its own exchange and clearinghouse for event contracts
What it does not do
- Does not: Does not execute, clear or hold cryptocurrency itself: third-party providers do that for its customers
- Does not: Does not charge commissions on IBKR Lite trades in US-listed stocks and ETFs
- Does not: Does not split its results into business lines: it reports one brokerage segment
13How the money flows
13How the money flows · FY2025
How does money flow through Interactive Brokers?
Money in
- Commissions from trades$2.1B
- Net interest income (interest earned minus interest paid)$3.6B
- Other fees and services$291M
- Other income$202M
The company
Interactive Brokers
$6.2B came in
Money out
- Execution, clearing and exchange fees$420M
- Employee pay and benefits$626M
- Offices, systems, communications and other costs$388M
- Income tax$414M
- Share owed to IBG Holdings (founder and staff)$3.4B
- Net income to Class A stockholders$984M
- In FY2025, customers paid $2,149M in commissions and $291M in other fees.
- Interest earned on margin loans and customer cash, minus interest paid out, added $3,563M.
- Running costs such as exchange fees, staff and systems took $1,434M, and tax took $414M.
- Of the $4,357M left, $3,373M belonged to IBG Holdings LLC, owned by the founder and staff.
- The remaining $984M was net income for holders of the listed Class A shares.
Sources (1)
14What it needs to run
14What it needs to run
What does Interactive Brokers need to run?
In-house software
Its trading, risk and back-office systems are built by its own engineers; the 10-K calls this technology the key to its success.
Exchange and clearing memberships
It connects to more than 170 exchanges and market centers, each with its own rules and fees.
Regulatory capital
Its broker subsidiaries keep capital above regulatory minimums; the excess was $14.1 billion at Dec 31, 2025.
Engineers and staff
It had 3,182 employees at Dec 31, 2025 and 3,283 at Sep 30, 2026.
15Where it sells
15Where it sells · FY2025
Where does Interactive Brokers sell?
- United States69.7%
- International (booking subsidiary outside the US)30.3%
Sources (1)
16Where growth could come from
16Where growth could come from
Where could Interactive Brokers' growth come from?
The earnings releases from Q4 FY2024 to Q3 FY2026 give no numeric forecast, and this page has no earnings call transcripts to quote.
New customer accounts
Working5.58M accounts, Sep 30, 2026 (+35% y/y)
Accounts rose from 3.34 million at Dec 31, 2024 to 5.58 million at Sep 30, 2026.
Status: Working, on track against what the company said.
Customer equity
Working$964.7B, Sep 30, 2026 (+27% y/y)
This is the value customers hold in their accounts. It was $568.2B at Dec 31, 2024.
Status: Working, on track against what the company said.
Margin lending
Working$105.2B of margin loans, Sep 30, 2026 (+36% y/y)
Customers who borrow against their investments pay interest. Margin loans were $64.2B at Dec 31, 2024.
Status: Working, on track against what the company said.
Trading activity
Mixed4.27M daily trades, Q3 FY2026 (+18% y/y)
Daily average revenue trades (DARTs) rose 18% from a year earlier but fell from 4.82M in Q2 FY2026.
Status: Mixed, partly on track.
Interest margin
Mixed1.99% net interest margin, Q3 FY2026 (2.16% a year earlier)
Net interest income rose 19% in Q3 FY2026 on bigger balances. The margin fell, mainly on lower interest rates, the 10-Q says.
Status: Mixed, partly on track.
Status compares progress with what the company itself said it would do: Working = on track against what the company said; Mixed = partly on track; Behind = behind the company's own plan; New = recently announced; Early = too early to judge.
Sources (9)
- Earnings release Q4 FY2024 (8-K Ex. 99.1)
- Earnings release Q1 FY2025 (8-K Ex. 99.1)
- Earnings release Q2 FY2025 (8-K Ex. 99.1)
- Earnings release Q3 FY2025 (8-K Ex. 99.1)
- Earnings release Q4 FY2025 (8-K Ex. 99.1)
- Earnings release Q1 FY2026 (8-K Ex. 99.1)
- Earnings release Q2 FY2026 (8-K Ex. 99.1)
- Earnings release Q3 FY2026 (8-K Ex. 99.1)
- Quarterly report Q3 FY2026 (10-Q)
17The company's own measures (non-GAAP)
17The company's own measures · FY2025
What do Interactive Brokers' own measures show?
Official (GAAP): Net revenues, FY2025
$6.2B
Company's own measure: Adjusted net revenues, FY2025
$6.2B
Leaves out the currency diversification strategy, mark-to-market gains or losses on investments and the remeasurement of the Tax Receivable Agreement liability.
Official (GAAP): Income before income taxes, FY2025
$4.8B
Company's own measure: Adjusted income before income taxes, FY2025
$4.7B
Same adjustments, plus unusual bad debt expense.
Official (GAAP): Diluted EPS, FY2025
$2.22
Company's own measure: Adjusted diluted EPS, FY2025
$2.19
Same adjustments after tax, plus the remeasurement of certain deferred tax assets.
Official (GAAP): Diluted EPS, Q3 FY2026
$0.69
Company's own measure: Adjusted diluted EPS, Q3 FY2026
$0.67
Same definition, from the Q3 FY2026 earnings release.
These are the company's own measures, defined by the company. They are not comparable across companies, and they are not added together. Each sits beside the nearest official (GAAP) figure.
Learn: Non-GAAP measures: what a company's "adjusted" numbers leave out
18Financial strength and debt
18Financial strength · Dec 31, 2025
How much debt does Interactive Brokers have?
- Total debt$19M
- Cash and investments$5.0B
- Net cash (cash minus debt)$4.9B
- Net worth (shareholders' money)$5.4B
- Debt to equity
- 0×
- $ of debt for every $1 of shareholders' money
- Net debt is a Cityfort calculation from the FY2025 10-K: $19M of short-term borrowings minus $4,963M of cash and cash equivalents. There is no long-term debt.
- Customer money sits on both sides: $50.3B of cash segregated for customers and $90.5B owed by customers (mainly margin loans) among assets, against $154.3B owed to customers.
- Net worth is the $5,363M of equity belonging to Class A stockholders. Total equity of $20,472M also includes $15,109M belonging to IBG Holdings.
- Its operating subsidiaries held $14.1B of capital above regulatory minimums at Dec 31, 2025, the 10-K says.
Sources (1)
19Who owns it
19Who owns it · ownership as of Mar 9, 2026
Who owns Interactive Brokers?
- Officers and directors (as a group), shares
- 2.8%
Shares vs votes by class
Interactive Brokers has more than one class of shares, and the classes carry different votes. The share of votes a class holds can differ a lot from its share of the shares.
- Class A common stock: share of all votes26.6%
- Class B common stock: share of all votes73.4%
Each class's part of all votes = its shares outstanding × votes per share ÷ the total for all classes.
Share classes
Holders of 5% or more
From the company's proxy statement (DEF 14A), later Schedule 13G filings and the share counts on its latest annual or quarterly report. Each holder row shows the date of its own filing.
Learn: Dual-class shares: when votes and ownership don't match · How to read a proxy statement (DEF 14A): Nvidia's 2026 proxy · Form 4 insider filings: who files, the codes and the footnotes
20What it does with profit
20What it does with profit
What does Interactive Brokers do with its profit?
Dividend per share
$0.30FY2025
Dividend paid for each share, by financial year.
$ per share
See the numbers
No buybacks or fund raises in the period covered.
21Governance signals
21Governance signals
What do Interactive Brokers' governance filings show?
- Auditor
- Deloitte & Touche LLP, since 1990
- Auditor changes
- None in the period covered
- Audit qualifications
- None reported
- Related-party dealings
- IBG Holdings LLC, owned mostly by Thomas Peterffy and his affiliates, receives distributions from IBG LLC ($836M to noncontrolling holders in FY2025). The company also has a Tax Receivable Agreement with Holdings, and director William Peterffy is the Chairman's son.
- Credit rating
- S&P Global Ratings BBB+ (IBG LLC issuer credit rating) (outlook Stable), Jun 5, 2024
A credit rating describes the company's ability to repay debt. It is not a rating of the share.
Flags to know about
other
Controlled company
The 2026 proxy statement says Thomas Peterffy's ownership makes the company a Nasdaq "controlled company". Nasdaq then does not require a majority-independent board or fully independent pay and nominating committees. Peterffy chairs the Compensation Committee.
related party
Family member on the board
Director William Peterffy is the son of founder and Chairman Thomas Peterffy, the 2026 proxy statement says.
22How it got here
22How it got here
How did Interactive Brokers get here?
1977
Milestone
Started as a market maker
Thomas Peterffy founded a market-making business on the American Stock Exchange floor and began automating trading with software.
2007
Milestone
Listed on Nasdaq
The May 2007 initial public offering created an "Up-C" structure, where the listed company owns part of the operating company: it bought 10% of IBG LLC from IBG Holdings.
2011
Milestone
Quarterly dividend began
The company has declared and paid a quarterly cash dividend since the second quarter of 2011.
2019
Milestone
New CEO
Milan Galik became CEO in October 2019; Thomas Peterffy stayed on as Chairman.
2025
Milestone
Four-for-one stock split
Announced on Apr 15, 2025 and effected on Jun 17, 2025, so each share became four.
2025
Milestone
Joined the S&P 500
The company joined the S&P 500 index on Aug 28, 2025.
2026
Milestone
Five million accounts passed
Customer accounts reached 5.19 million at Jun 30, 2026 and 5.58 million at Sep 30, 2026.
23Sources and changes
Where every number on this page comes from
Sources (20 documents)
- S1Annual report FY2025 (10-K) · Interactive Brokers Group, Inc. (SEC EDGAR) · Tier 1: company or exchange filing · Feb 27, 2026
- S2Annual report FY2024 (10-K) · Interactive Brokers Group, Inc. (SEC EDGAR) · Tier 1: company or exchange filing · Feb 27, 2025
- S3Annual report FY2023 (10-K) · Interactive Brokers Group, Inc. (SEC EDGAR) · Tier 1: company or exchange filing · Feb 27, 2024
- S4Quarterly report Q3 FY2026 (10-Q) · Interactive Brokers Group, Inc. (SEC EDGAR) · Tier 1: company or exchange filing · Nov 5, 2026
- S5Quarterly report Q2 FY2026 (10-Q) · Interactive Brokers Group, Inc. (SEC EDGAR) · Tier 1: company or exchange filing · Aug 6, 2026
- S6Quarterly report Q1 FY2026 (10-Q) · Interactive Brokers Group, Inc. (SEC EDGAR) · Tier 1: company or exchange filing · May 7, 2026
- S7Quarterly report Q3 FY2025 (10-Q) · Interactive Brokers Group, Inc. (SEC EDGAR) · Tier 1: company or exchange filing · Nov 5, 2025
- S8Quarterly report Q2 FY2025 (10-Q) · Interactive Brokers Group, Inc. (SEC EDGAR) · Tier 1: company or exchange filing · Aug 6, 2025
- S9Quarterly report Q1 FY2025 (10-Q) · Interactive Brokers Group, Inc. (SEC EDGAR) · Tier 1: company or exchange filing · May 8, 2025
- S10Proxy statement 2026 (DEF 14A) · Interactive Brokers Group, Inc. (SEC EDGAR) · Tier 1: company or exchange filing · Mar 11, 2026
- S11Earnings release Q3 FY2026 (8-K Ex. 99.1) · Interactive Brokers Group, Inc. (SEC EDGAR) · Tier 1: company or exchange filing · Oct 15, 2026
- S12Earnings release Q2 FY2026 (8-K Ex. 99.1) · Interactive Brokers Group, Inc. (SEC EDGAR) · Tier 1: company or exchange filing · Jul 21, 2026
- S13Earnings release Q1 FY2026 (8-K Ex. 99.1) · Interactive Brokers Group, Inc. (SEC EDGAR) · Tier 1: company or exchange filing · Apr 21, 2026
- S14Earnings release Q4 FY2025 (8-K Ex. 99.1) · Interactive Brokers Group, Inc. (SEC EDGAR) · Tier 1: company or exchange filing · Jan 20, 2026
- S15Earnings release Q3 FY2025 (8-K Ex. 99.1) · Interactive Brokers Group, Inc. (SEC EDGAR) · Tier 1: company or exchange filing · Oct 16, 2025
- S16Earnings release Q2 FY2025 (8-K Ex. 99.1) · Interactive Brokers Group, Inc. (SEC EDGAR) · Tier 1: company or exchange filing · Jul 17, 2025
- S17Earnings release Q1 FY2025 (8-K Ex. 99.1) · Interactive Brokers Group, Inc. (SEC EDGAR) · Tier 1: company or exchange filing · Apr 15, 2025
- S18Earnings release Q4 FY2024 (8-K Ex. 99.1) · Interactive Brokers Group, Inc. (SEC EDGAR) · Tier 1: company or exchange filing · Jan 21, 2025
- S20S&P Global Ratings: IBG LLC research update (BBB+/Stable issuer credit rating) · S&P Global Ratings (copy hosted by Interactive Brokers) · Tier 2: rating agency or regulator · Jun 5, 2024
- S21Interactive Brokers: S&P Rating page (Interactive Brokers LLC A-, Outlook Stable; undated) · Interactive Brokers · Tier 1: company or exchange filing · Nov 20, 2026
Changes to this page (v1 · Nov 20, 2026)
- v1 · Nov 20, 2026First version. (first version)
Numbers come only from tier 1 and tier 2 sources. Read how we research.
Disclaimer
For learning only. Cityfort is not a registered investment adviser or broker-dealer and does not recommend buying or selling any security. Prices shown are dated and may be out of date.
Investing in securities involves risk, including loss of capital. Before making any investment decision, do your own research and consider consulting a registered investment adviser or other qualified professional.
Cityfort, its owners and contributors may or may not hold securities of companies covered. Cityfort is not paid by any company it covers. Content is not an offer or solicitation to buy or sell any security, including in any initial public offering.
Read the positions policyRead the full disclaimerHide the full disclaimer
Cityfort publishes general educational content that explains how listed companies work. Cityfort is not registered with the US Securities and Exchange Commission or any state securities regulator as an investment adviser, and is not a broker-dealer or a member of FINRA. Cityfort does not provide investment, tax or legal advice, recommendations, ratings, price targets or any opinion on whether to buy, sell or hold any security. Nothing on the site is tailored to any person's circumstances.
All information is taken from publicly available sources, mainly company filings with the SEC, which are listed on each page with dates. We work to keep it accurate and correct errors publicly, but we do not guarantee that it is complete, accurate or up to date. Any market price or price-based ratio shown is dated, may be out of date by the time you read it, and is included only to explain concepts.
Statements by company management, including forward-looking statements and guidance, are reported as the company's statements, with their date and source; they are not our forecasts. Adjusted (non-GAAP) figures are the company's own measures and are shown next to the official (GAAP) figures.