Industrials · NYSE: DE
Deere: how the business works
Deere & Company makes John Deere farm, lawn and construction machines and lends to the people who buy them, with total net sales and revenues of $45.7 billion in FY2025.
By Hardik Bhandare · Checked against filings: . Editorial policy. Corrections
Follow Deere
Email me when Deere's page is updated after earnings.
We'll send a confirmation email first. See our privacy policy.
Deere & Company · Moline, Illinois · Founded 1837
Updated for Q3 FY2026 · checked
- Total net sales and revenues, FY2025
- $45.7B
- Net income, FY2025
- $5.0B
- Dealer locations in the US and Canada (about)
- 2,050
- Employees, Nov 2, 2025 (about)
- 73,100
- Making farm equipment since
- 1837
The short version
Deere in 5 points
1 · What it sells
Deere sells John Deere farm, lawn, construction, roadbuilding and forestry machines, and loans and leases through John Deere Financial, with total net sales and revenues of $45.7 billion in FY2025.
2 · Who pays it
In FY2025, large crop farms paid 37.1% of total net sales and revenues, builders and road crews 22.0%, smaller farms and turf buyers 21.8%, borrowers 13.8%, logging companies 2.5% and other 2.9%, mostly through independent dealers.
3 · What it keeps from $100
Of every $100 that came in during FY2025, Deere kept $11.00 as net income, which includes one-off items ($163 million of tax benefits, a $32 million gain linked to Banco John Deere, a $75 million after-tax antitrust class action accrual and a $49 million after-tax battery impairment), while total segment operating profit, Deere's own segment measure, was $13.18.
4 · Where the operating profit comes from
Of $6,020 million of FY2025 segment operating profit, Production & Precision Agriculture earned $2,671 million, Small Agriculture & Turf $1,207 million, Financial Services $1,114 million and Construction & Forestry $1,028 million.
5 · The one thing to watch
In Q3 FY2026, Production & Precision Agriculture net sales fell 6% to $3,998 million while Construction & Forestry net sales rose 18% to $3,618 million.
Sources: From Deere's FY2025 10-K and Q3 FY2026 earnings release · checked
See the full receipt and the management scorecard below
01Where the money goes · FY2025
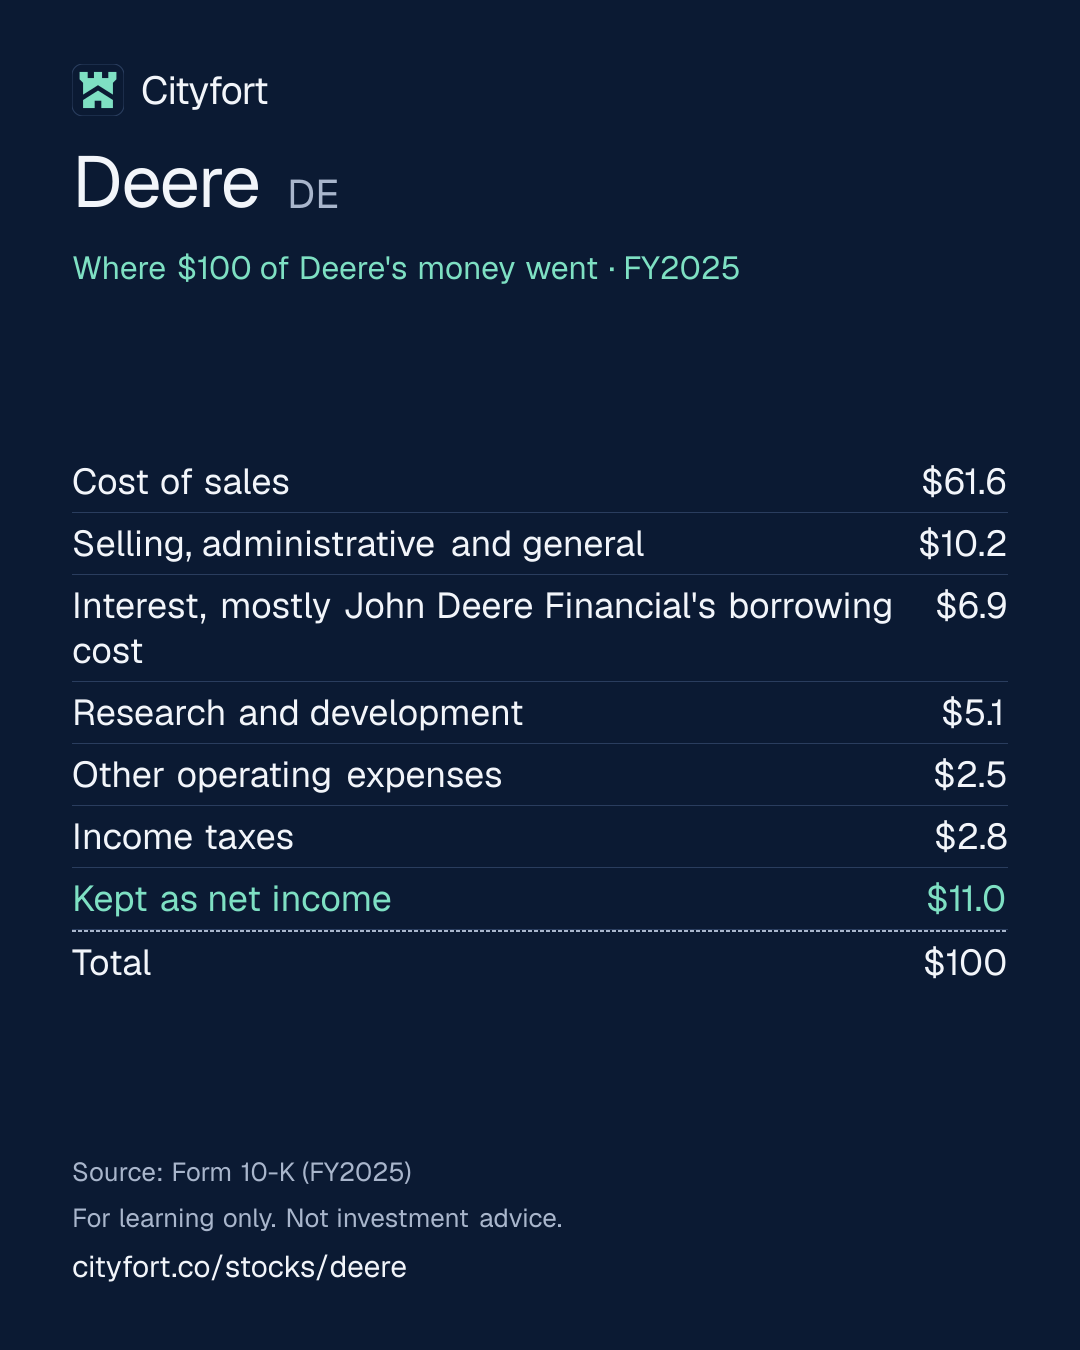
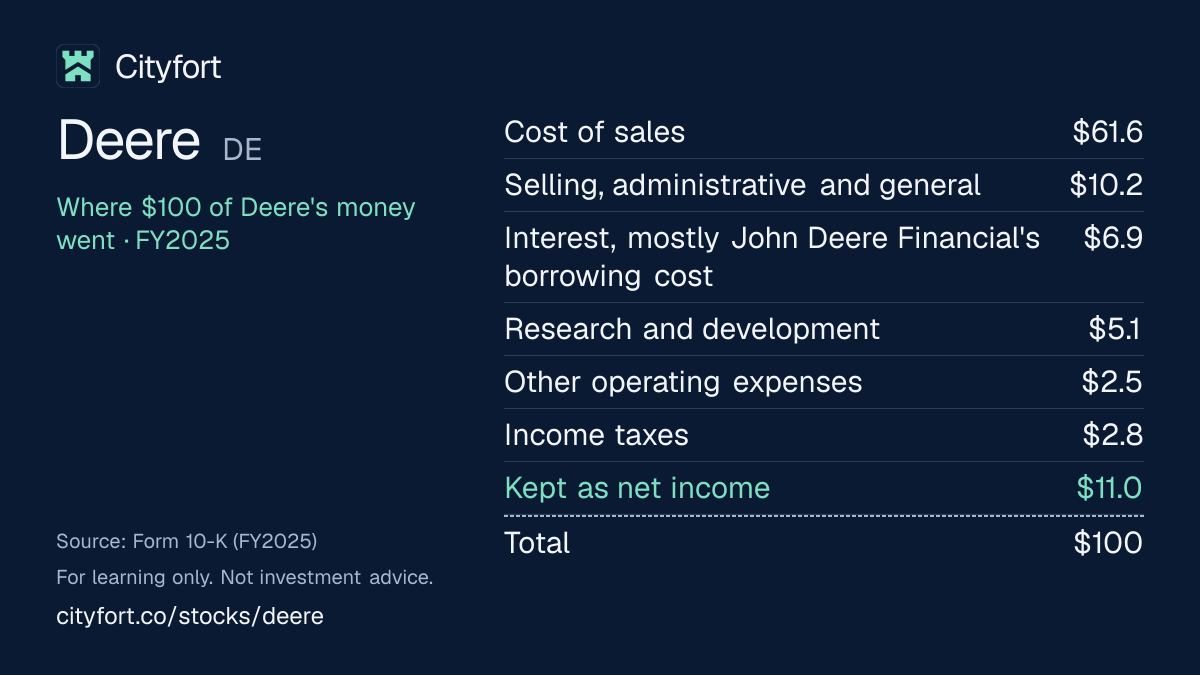
Where does $100 of Deere's money go?
Deere · FY2025
Receipt for every $100
| Cost of sales | $61.6 |
|---|---|
| Selling, administrative and general | $10.2 |
| Interest, mostly John Deere Financial's borrowing cost | $6.9 |
| Research and development | $5.1 |
| Other operating expenses | $2.5 |
| Income taxes | $2.8 |
| Kept as net income | $11.0 |
| Total | $100 |
Each line = amount ÷ total money in × 100. Lines may not add to exactly $100 because of rounding.
How this is worked out
Cityfort calculation from FY2025 10-K. Of every $100 that came in during FY2025: each line = line ÷ $45,684 million of total net sales and revenues × 100. Lines add to $100.07 because the $11.00 of net income is Deere's share after a $29 million loss borne by minority owners. Total segment operating profit, Deere's own segment measure, was $6,020 million, or $13.18 of each $100. Net income includes one-off items: $163 million of tax benefits and a $32 million gain linked to Banco John Deere, a Brazilian lender Deere owns 50% of, less a $95 million pretax ($75 million after-tax) antitrust class action accrual and a $61 million pretax ($49 million after-tax) battery impairment.
Save this receipt as an image:
1080 × 1350 PNG for Instagram, LinkedIn1200 × 675 PNG for X
Embed this receipt
Paste this code into a blog or website to show the receipt, with a link back to this page:
Each week: one company explained in 5 points, picked by earnings date.
Free, no tips, unsubscribe anytime.
We'll send a confirmation email. See our privacy policy.
02The business in one line
What does Deere do?
Farmers, landscapers and builders pay Deere, mostly through independent dealers, for machines and the loans to buy them; most of the money goes to making the machines, and $11.00 of every $100 that came in during FY2025 was left as net income.
- Equipment sales were $38,917 million of FY2025's $45,684 million. Finance and interest income added $5,748 million and other income $1,019 million.
- On Aug 2, 2026, John Deere Financial owed $54,511 million of Deere's $63,836 million of borrowings. That money funds loans and leases to customers and dealers.
03Who pays it
Who pays Deere?
Large crop farms
37%
of revenue
Production agriculture products: 37.1% of FY2025 total net sales and revenues, or $16,960 million, down from $20,574 million in FY2024.
Builders, contractors and road crews
22%
of revenue
Construction, compact construction and roadbuilding products: 22.0% of FY2025 total net sales and revenues, or $10,044 million.
Smaller farms, landscapers and homeowners
22%
of revenue
Small agriculture and turf products: 21.8% of FY2025 total net sales and revenues, or $9,946 million.
Borrowers and lessees of John Deere Financial
14%
of revenue
Financial products: 13.8% of FY2025 total net sales and revenues, or $6,296 million of interest, lease and other financing revenue from buyers and dealers.
Logging companies
3%
of revenue
Forestry products: 2.5% of FY2025 total net sales and revenues, or $1,124 million.
Other
3%
of revenue
Other revenues: 2.9% of FY2025 total net sales and revenues, or $1,314 million.
- Large crop farms37%
- Builders, contractors and road crews22%
- Smaller farms, landscapers and homeowners22%
- Borrowers and lessees of John Deere Financial14%
- Logging companies3%
- Other3%
How spread out the customers are
These shares are by product line, the closest split Deere gives to types of buyer; it gives no revenue by customer and names no customer concentration. Independent dealers sit between Deere and most end users. Shares are a Cityfort calculation from the FY2025 10-K.
04Why it makes money
Why does Deere make money?
Profit rises and falls with farm incomes, because dealers order machines when farmers can afford them; the lending arm is steadier.
Equipment net sales fell 30% from FY2023 to FY2025, and segment operating profit per $100 of revenue fell from $21.2 to $13.2. Over the same years, Financial Services operating profit rose from $795 million to $1,114 million.
Segment operating profit per $100 of total net sales and revenues
$21.2$13.2
FY2023 to FY2025
- Crop prices and interest rates set farmers' buying power
- Dealers order machines to match expected sales
- Factories build, and costs are spread over more or fewer machines
- John Deere Financial lends to buyers and dealers
- Loans and leases earn interest for years
- Cash pays for dividends, buybacks and new products
↺ Step 6 feeds back into step 1.
05Business segments · FY2025
Which businesses make up Deere?
Production & Precision Agriculture
39%Large farm machines. Shares are of the four segments' $44,738 million of outside net sales and revenues (Cityfort calculation from FY2025 10-K). The other $946 million is finance and other income in the equipment segments. Operating profit per $100 of net sales was $15.4, down from $26.1 in FY2023.
Revenue $17.3B · Operating profit $2.7B
Construction & Forestry
25%Construction, roadbuilding and forestry machines. Operating profit fell from $2,009 million in FY2024 to $1,028 million in FY2025.
Revenue $11.4B · Operating profit $1.0B
Small Agriculture & Turf
23%Small tractors, hay equipment, mowers and utility vehicles. Operating profit fell from $1,627 million in FY2024 to $1,207 million in FY2025.
Revenue $10.2B · Operating profit $1.2B
Financial Services
13%John Deere Financial's loans, leases and warranties. Its operating profit is after its own interest cost of $2,923 million.
Revenue $5.8B · Operating profit $1.1B
How the mix changed
- Production & Precision Agriculture
- Construction & Forestry
- Small Agriculture & Turf
- Financial Services
Revenue by segment, FY2021 to FY2025.
US$
See the numbers
06The numbers · Consolidated · US$
How has Deere done?
Revenue
$45.7BFY2025
Total net sales and revenues rose from $44.0 billion in FY2021 to $61.3 billion in FY2023, then fell to $45.7 billion in FY2025, a 53-week year.
US$
See the numbers
Net profit
$5.0BFY2025
Net income peaked at $10.2 billion in FY2023 and fell to $5.0 billion in FY2025; EBITDA is not shown because Deere reports no operating income line.
US$
See the numbers
Profit kept per $100 of revenue
$11.0FY2025
Net income per $100 of revenue fell from $16.6 in FY2023 to $11.0 in FY2025; Q3 FY2026 cost of sales includes $110 million of tariff recoveries.
$ of profit per $100 of revenue (net margin)
See the numbers
Free cash flow
$6.1BFY2025
Free cash flow was $6.1 billion in FY2025; Deere also spent $2.9 billion on machines it leases out, which leaves $3.2 billion (Cityfort calculation from FY2025 10-K).
US$ · cash from operations minus spending on plants and equipment
See the numbers
See all yearly numbers
EBITDA here = operating income plus depreciation and amortization (from the cash flow statement). Fiscal years are the company's own (Fiscal year ends on the last Sunday of October or the first Sunday of November; FY2025 ended Nov 2, 2025 and had 53 weeks). Net profit is the share belonging to the company's owners.
Download Deere's yearly and quarterly numbers (CSV, with source ids)
Learn: Fiscal years that don't end in December: Nvidia's FY2027 explained · Stock-based compensation and dilution: pay that becomes shares
Sources (10)
- Form 10-K, fiscal year 2023 (ended Oct 29, 2023)
- Form 10-K, fiscal year 2025 (ended Nov 2, 2025)
- Q3 FY2025 earnings release (8-K Ex. 99.1, Aug 14, 2025)
- Q4 and FY2024 earnings release (8-K Ex. 99.1, Nov 21, 2024)
- Q1 FY2025 earnings release (8-K Ex. 99.1, Feb 13, 2025)
- Q2 FY2025 earnings release (8-K Ex. 99.1, May 15, 2025)
- Q4 and FY2025 earnings release (8-K Ex. 99.1, Nov 26, 2025)
- Q1 FY2026 earnings release (8-K Ex. 99.1, Feb 19, 2026)
- Q2 FY2026 earnings release (8-K Ex. 99.1, May 21, 2026)
- Q3 FY2026 earnings release (8-K Ex. 99.1, Aug 20, 2026)
07Who runs it
Who runs Deere, and did they deliver?
John C. May
Chairman and Chief Executive Officer
His FY2025 total pay was $27,925,424, against $27,801,672 in FY2024. The proxy's CEO pay ratio was about 190 to 1, against a median employee's $147,019.
T. Brent Norwood
Chief Financial Officer · since 2026
CFO since May 1, 2026. Joshua Jepsen resigned as CFO effective Feb 19, 2026, and Ryan Campbell was acting CFO in between.
R. Preston Feight
Lead Director · since 2025
Lead Director since Jul 7, 2025, after the death of director Sherry M. Smith.
What they said, and what happened
2 delivered · 2 too early to tell
Said on Nov 21, 2024
Deere said in its Q4 FY2024 earnings release that it expected FY2025 net income of $5.0 billion to $5.5 billion.
DeliveredWhat happened
FY2025 net income was $5,027 million, inside the first range. Deere had lowered the range to $4.75 billion to $5.25 billion in August 2025.
Said on Nov 21, 2024
Deere said in its Q4 FY2024 earnings release that it expected Financial Services net income of about $750 million in FY2025.
DeliveredWhat happened
Financial Services net income was $890 million in FY2025.
Said on Nov 26, 2025
Deere said in its Q4 FY2025 earnings release that it expected FY2026 net income of $4.00 billion to $4.75 billion.
Too early to tellWhat happened
Full-year results are not out yet. Deere raised the range to $4.75 billion to $5.00 billion on Aug 20, 2026. Nine-month net income was $3,808 million.
Said on Nov 26, 2025
Deere said in its Q4 FY2025 earnings release that it expected FY2026 equipment operations cash from operations of $4.0 billion to $5.0 billion.
Too early to tellWhat happened
Deere raised this to $5.0 billion to $5.5 billion on Aug 20, 2026. It was $4,012 million in the first nine months.
Sources (13)
- Definitive proxy statement (DEF 14A) for the Feb 25, 2026 annual meeting
- Q3 FY2026 earnings release (8-K Ex. 99.1, Aug 20, 2026)
- 8-K filed May 1, 2026: T. Brent Norwood elected CFO effective May 1, 2026 (Item 5.02, Ex. 99.1)
- 8-K filed Jan 22, 2026: CFO Joshua Jepsen resigns; Ryan Campbell acting CFO (Item 5.02)
- 8-K filed Jul 7, 2025: death of director Sherry M. Smith; R. Preston Feight named Lead Director (Item 8.01)
- Q4 and FY2024 earnings release (8-K Ex. 99.1, Nov 21, 2024)
- Form 10-K, fiscal year 2025 (ended Nov 2, 2025)
- Q3 FY2025 earnings release (8-K Ex. 99.1, Aug 14, 2025)
- Q4 and FY2025 earnings release (8-K Ex. 99.1, Nov 26, 2025)
- Q4 FY2025 earnings call slides (8-K Ex. 99.2, Nov 26, 2025)
- Q1 FY2026 earnings release (8-K Ex. 99.1, Feb 19, 2026)
- Q2 FY2026 earnings release (8-K Ex. 99.1, May 21, 2026)
- Q3 FY2026 earnings call slides (8-K Ex. 99.2, Aug 20, 2026)
08What could go wrong
What could go wrong for Deere?
- Demand
Farm incomes drive most of the business
Deere's FY2025 10-K names farm income, commodity prices and interest rates as risks. Production & Precision Agriculture net sales fell from $26,790 million in FY2023 to $17,311 million in FY2025. On Aug 20, 2026, Deere expected industry sales of large farm equipment in the US and Canada to fall 15% to 20% in FY2026.
Watch Production & Precision Agriculture net sales and Deere's industry outlook in each earnings release.
- Regulation
Tariff costs
Deere put the direct cost of new tariffs at about $600 million in FY2025. In the first nine months of FY2026 it was $502 million, after $382 million of recoveries that followed the Supreme Court's Feb 20, 2026 decision on IEEPA tariffs.
Watch Tariff costs and recoveries in the FY2026 10-K; about 80% of recoveries had been received by Aug 2, 2026.
- Other
Margins that include tariff recoveries
Tariff recoveries of $110 million in Q3 FY2026 and $382 million in nine months sit in cost of sales. Deere allocated 20% to Production & Precision Agriculture, 25% to Small Agriculture & Turf and 55% to Construction & Forestry, so those margins include them.
Watch Segment margins in quarters without recoveries, in the earnings releases.
- Debt
Loan losses and funding at John Deere Financial
John Deere Financial owed $54,511 million on Aug 2, 2026. Its write-offs rose from $129 million in FY2023 to $312 million in FY2025, and non-performing loans from 1.01% to 1.23% of the portfolio between FY2024 and FY2025.
Watch Write-offs, past-due and non-performing loans in the 10-K, and Deere's credit ratings in each 10-Q.
- Competition
Competition, including technology entrants
Deere's FY2025 10-K names farm rivals such as AGCO, CNH Industrial and Kubota, construction rivals including Caterpillar, Komatsu, SANY and XCMG, and technology-focused companies and start-ups.
Watch Segment margins: Construction & Forestry was 12.1% in Q3 FY2026, up from 7.7% a year earlier.
- Execution
Union labor agreement
About 7,600 US workers are under a UAW agreement that expires on Nov 1, 2027. Unions represent about 77% of Deere's US production and maintenance employees.
Watch Talks on the next UAW agreement before Nov 1, 2027.
- Legal
Repair rules and FTC oversight
Deere's FY2025 10-K names right-to-repair rules as a risk. Under the Jul 8, 2026 settlement with the FTC and five states, Deere must provide certain repair resources, report regularly and accept FTC oversight.
Watch Any new repair laws or FTC actions under the settlement, in the 10-K and 10-Qs.
- Concentration
Reliance on independent dealers
Most machines reach buyers through independent dealers, so Deere's sales depend on what dealers order. Deere dealer inventories of large two-wheel-drive tractors were 33% of trailing 12-month retail sales in the Aug 20, 2026 slides, against 31% in 2025.
Watch Dealer inventory figures in the earnings-call slides each quarter.
09Both sides
What do supporters and critics point to?
What supporters point to
- Q3 FY2026 net income was $1,379 million, up from $1,289 million a year earlier, on total net sales and revenues of $12,608 million, up from $12,018 million.
- Construction & Forestry Q3 FY2026 net sales rose 18% and Small Agriculture & Turf 12% from a year earlier.
- John Deere Financial's net income rose from $696 million in FY2024 to $890 million in FY2025.
- Most borrowing is John Deere Financial's: the equipment business had net debt of $2,718 million on Aug 2, 2026 (Cityfort calculation from the Q3 FY2026 earnings release).
- Deere raised its FY2026 net income outlook from $4.00 billion to $4.75 billion (Nov 26, 2025) to $4.75 billion to $5.00 billion (Aug 20, 2026).
What critics point to
- Net income fell from $10,166 million in FY2023 to $5,027 million in FY2025.
- Production & Precision Agriculture Q3 FY2026 net sales fell 6% and operating profit 9% from a year earlier.
- Tariffs cost Deere $502 million in the first nine months of FY2026, even after $382 million of recoveries.
- John Deere Financial's write-offs rose from $129 million in FY2023 to $312 million in FY2025.
- Total borrowings were $63,836 million on Aug 2, 2026, against Deere stockholders' equity of $27,990 million.
10What to watch next
What should you watch next at Deere?
Next event
Q4 FY2026 results (earnings call at 9:00 a.m. CT)
Nov 25, 2026
Date confirmed by the company
FY2026 net income against the outlook
Deere's Aug 20, 2026 outlook was $4.75 billion to $5.00 billion. Net income for the first nine months was $3,808 million.
Large farm machines against construction
In Q3 FY2026, Production & Precision Agriculture net sales fell 6% to $3,998 million while Construction & Forestry rose 18% to $3,618 million.
Tariffs and recoveries
Tariffs cost $502 million in the first nine months of FY2026, after $382 million of recoveries, about 80% of which had been received by Aug 2, 2026.
Loan quality at John Deere Financial
Write-offs were $312 million in FY2025 and non-performing loans 1.23% of the portfolio. The FY2026 10-K will give the next annual figures.
11Key facts
Key facts about Deere
- What does Deere do?
- Deere & Company makes John Deere tractors, combines, sprayers, mowers, construction, roadbuilding and forestry machines, and finances buyers through John Deere Financial. Deere had FY2025 total net sales and revenues of $45,684 million and about 73,100 employees on Nov 2, 2025.
- How does Deere make money, and what is its business model?
- Deere's business model is building machines, selling them mainly through independent dealers, and lending to the buyers and dealers. In FY2025, Deere's equipment net sales were $38,917 million, its finance and interest income $5,748 million and its other income $1,019 million.
- Is Deere profitable?
- Deere's FY2025 net income was $5,027 million, down from $7,100 million in FY2024 and $10,166 million in FY2023. Deere's Q3 FY2026 net income was $1,379 million, up from $1,289 million a year earlier.
- What is Deere's revenue by segment?
- In FY2025, Deere's net sales were $17,311 million from Production & Precision Agriculture, $11,382 million from Construction & Forestry and $10,224 million from Small Agriculture & Turf. Financial Services revenues were $5,821 million. Total net sales and revenues were $45,684 million.
- Who are Deere's customers?
- Deere sells mainly through independent dealers to farmers, landscapers, homeowners, builders, road crews and loggers. In FY2025, customers in the United States paid 52.5% of Deere's total net sales and revenues. Deere does not disclose revenue by individual customer.
- Who owns Deere?
- Deere's 2026 proxy statementThe yearly filing about shareholder votes, the board and executive pay. Learn more lists Cascade Investment and related Gates entities with 8.74% and BlackRock with 6.36%, based on filings from 2022 and 2024. Vanguard Capital Management reported 7.04% of Deere at Mar 31, 2026. Deere's officers and directors held about 0.30% (Cityfort calculation from the 2026 proxy statement and FY2025 10-K).
- What is Deere's Production & Precision Agriculture business?
- Deere's Production & Precision Agriculture segment sells large tractors, combines, cotton and sugarcane harvesters, planting, tillage and spraying equipment. In FY2025 the segment had net sales of $17,311 million and operating profit of $2,671 million, down from $4,514 million in FY2024.
- What is Deere's Small Agriculture & Turf business?
- Deere's Small Agriculture & Turf segment sells utility and compact tractors, hay and forage equipment, mowers, golf course equipment and utility vehicles. In FY2025 the segment had net sales of $10,224 million and operating profit of $1,207 million, down from $1,627 million in FY2024.
- What is Deere's Construction & Forestry business?
- Deere's Construction & Forestry segment sells backhoes, dozers, excavators, loaders, forestry machines and Wirtgen roadbuilding equipment. In FY2025 the segment had net sales of $11,382 million and operating profit of $1,028 million, down from $2,009 million in FY2024.
- What is Deere's Financial Services business?
- Deere's Financial Services segment, John Deere Financial, makes retail loans, revolving credit, dealer loans and leases, and sells extended warranties. In FY2025 it had revenues of $5,821 million and net income of $890 million, up from $696 million in FY2024.
Terms on this page
- Backlog
- Capital expenditures (capex)
- Debt-to-equity
- Earnings per share (EPS)
- Free cash flow
- Market cap
- Net debt
- Net margin
- P/E ratio
- Revenue vs net income
Each explains the term in plain English, with the same number from other companies on Cityfort.
Go deeper
More detail from the same filings. Open any section.
12What it sells
12What it sells
What does Deere sell?
Large farm machines
Large tractors, combines, cotton and sugarcane harvesters, and planting, tillage and spraying equipment for big crop farms. FY2025 net sales were $17,311 million.
Small farm and turf equipment
Utility and compact tractors, hay and forage equipment, riding mowers, golf course equipment and utility vehicles. FY2025 net sales were $10,224 million.
Construction, roadbuilding and forestry machines
Backhoes, dozers, excavators and loaders, Wirtgen, Vögele and Hamm road machines, and timber harvesting machines. FY2025 net sales were $11,382 million.
Loans, leases and warranties
John Deere Financial lends to buyers and dealers, leases machines and sells extended warranties. Financial Services revenues were $5,821 million in FY2025.
What it does
- Does: Sells most machines through independent dealers, who sell to farmers and contractors.
- Does: Sells some lawn and garden and compact construction products through The Home Depot and Lowe's.
- Does: Finances many of the machines its dealers sell, through John Deere Financial.
What it does not do
- Does not: Own its dealer network: about 2,050 US and Canadian dealer locations are independent businesses.
- Does not: Report revenue from precision technology or subscriptions, or from spare parts, as separate amounts.
- Does not: Report unit volumes or market shares in its filings.
13How the money flows
13How the money flows · FY2025
How does money flow through Deere?
Money in
- Equipment net sales$38.9B
- Finance and interest income$5.7B
- Other income$1.0B
The company
Deere
$45.7B came in
Money out
- Cost of sales$28.2B
- Selling, administrative and general$4.7B
- Interest, mostly John Deere Financial's borrowing cost$3.2B
- Research and development$2.3B
- Other operating expenses$1.1B
- Income taxes$1.3B
- Net income attributable to Deere$5.0B
- Dealers and customers paid Deere $38.9 billion for machines in FY2025, and borrowers paid $5.7 billion of finance and interest income.
- Other income added $1.0 billion, for a total of $45.7 billion.
- Building the machines cost $28.2 billion. Selling and administration took $4.7 billion and research $2.3 billion.
- Interest took $3.2 billion, of which $2.9 billion was John Deere Financial's cost of borrowing the money it lends.
- After other costs and $1.3 billion of tax, $5,027 million was left as net income for Deere, after a $29 million loss borne by minority owners.
14What it needs to run
14What it needs to run
What does Deere need to run?
Dealers
About 2,050 independent dealer locations in the US and Canada, plus about 100 roadbuilding-only and 260 turf-only locations. Farm and turf machines are sold in over 100 other countries.
A workforce
About 73,100 employees on Nov 2, 2025, 27,000 of them in the US. About 7,600 US workers are under a UAW agreement that expires Nov 1, 2027.
Factories and inventory
Property and equipment was $8,006 million and inventories $7,811 million on Aug 2, 2026. Deere says nearly 80% of its US sales are assembled in the US.
Borrowed money for lending
John Deere Financial owed $54,511 million on Aug 2, 2026. Financing receivables (loans owed by customers and dealers) were $49,176 million, and machines leased out $7,400 million.
15Where it sells
15Where it sells · FY2025
Where does Deere sell?
- United States53%
- Western Europe14%
- Latin America12%
- Asia, Africa, Oceania and Middle East9%
- Canada8%
- Central Europe and CIS3%
16Competitors and what protects it
16Competitors and what protects it
Who does Deere compete with?
CNH Industrial
Named by Deere in both farm and turf equipment and construction and forestry equipment.
AGCO
Named by Deere as a competitor in farm and turf equipment.
Kubota
Named by Deere in farm and turf equipment (Kubota Tractor) and in construction equipment.
Caterpillar
NYSE: CAT
Named by Deere as a competitor in construction and forestry equipment.
Komatsu
Named by Deere in construction and forestry equipment, alongside Volvo CE, Hitachi Construction Machinery and Chinese makers such as SANY and XCMG.
What protects the business
Each strength is scored 1 (weak) to 5 (strong) for the business, with the reason. It is not a rating of the share.
- Dealer network4 of 5
About 2,050 independent dealer locations in the US and Canada, and farm and turf sales in over 100 other countries. The dealers are independent businesses.
- Financing for buyers4 of 5
John Deere Financial had $51,664 million of financing receivables at the end of FY2025 and earned $890 million that year. It lends to buyers and dealers of Deere machines.
- Spread across farm, turf and construction3 of 5
In FY2025, no single segment earned more than 44.4% of segment operating profit (Cityfort calculation from FY2025 10-K). Construction & Forestry is tied to building, not crops.
- Factories in its main market3 of 5
Deere's FY2025 10-K says nearly 80% of its US sales are assembled in the US. It still put the direct cost of new tariffs at about $600 million in FY2025.
Weak spot
Dependence on the farm cycle
Production & Precision Agriculture net sales fell from $26,790 million in FY2023 to $17,311 million in FY2025. The FY2025 10-K names farm income, commodity prices and interest rates as risks.
17Where growth could come from
17Where growth could come from
Where could Deere's growth come from?
Deere said in its Aug 20, 2026 earnings release that it expects FY2026 net income of $4.75 billion to $5.00 billion, up from $4.00 billion to $4.75 billion said on Nov 26, 2025. It expects Production & Precision Agriculture net sales down about 10%, Small Agriculture & Turf up about 15% and Construction & Forestry up about 20%. CEO John C. May said: "we continue to believe 2026 will mark the bottom of the current ag equipment cycle."
Construction & Forestry
Working$3,618M net sales, Q3 FY2026
Up 18% from $3,059 million a year earlier, with operating profit up 84% to $436 million. Deere's Aug 20, 2026 outlook raised the segment's FY2026 sales growth from about 10% to about 20%.
Status: Working, on track against what the company said.
Small Agriculture & Turf
Working$3,383M net sales, Q3 FY2026
Up 12% from $3,025 million a year earlier. Operating profit per $100 of net sales was $18.4, up from $16.0. Deere's outlook moved from about 10% to about 15% growth for FY2026.
Status: Working, on track against what the company said.
Production & Precision Agriculture
Mixed$3,998M net sales, Q3 FY2026
Down 6% from $4,273 million a year earlier, with operating profit down 9% to $527 million. Deere expected a 5% to 10% fall for FY2026 in November 2025, and about 10% in August 2026.
Status: Mixed, partly on track.
John Deere Financial
Working$653M net income, nine months of FY2026
Up from $597 million in the same period of FY2025. Deere raised its FY2026 outlook for Financial Services net income from about $830 million in November 2025 to about $870 million in August 2026.
Status: Working, on track against what the company said.
Tenna acquisition
New$439M, February 2026
Deere bought Tenna LLC in February 2026 for $439 million net of cash, inside Construction & Forestry.
Status: New, recently announced.
Status compares progress with what the company itself said it would do: Working = on track against what the company said; Mixed = partly on track; Behind = behind the company's own plan; New = recently announced; Early = too early to judge.
Sources (9)
- Q3 FY2026 earnings release (8-K Ex. 99.1, Aug 20, 2026)
- Q3 FY2026 earnings call slides (8-K Ex. 99.2, Aug 20, 2026)
- Q4 and FY2025 earnings release (8-K Ex. 99.1, Nov 26, 2025)
- Q4 FY2025 earnings call slides (8-K Ex. 99.2, Nov 26, 2025)
- Q2 FY2026 earnings release (8-K Ex. 99.1, May 21, 2026)
- Q1 FY2026 earnings release (8-K Ex. 99.1, Feb 19, 2026)
- Q3 FY2025 earnings release (8-K Ex. 99.1, Aug 14, 2025)
- Q2 FY2025 earnings release (8-K Ex. 99.1, May 15, 2025)
- Q1 FY2025 earnings release (8-K Ex. 99.1, Feb 13, 2025)
18The company's own measures (non-GAAP)
18The company's own measures · FY2025 and the first nine months of FY2026, unless the row says otherwise
What do Deere's own measures show?
Official (GAAP): Operating cash flow, FY2025
$7.5B
Company's own measure: Equipment operations cash from operations, FY2025
$5.1B
Deere's own measure from its supplemental data: cash from the machine business alone, leaving out John Deere Financial. It is the cash figure Deere gives guidance on.
Official (GAAP): Operating cash flow, nine months of FY2026
$3.3B
Company's own measure: Equipment operations cash from operations, nine months of FY2026
$4.0B
Same measure. It was $3,338 million in the same period of FY2025. Deere's Aug 20, 2026 outlook for FY2026 is $5.0 billion to $5.5 billion.
Official (GAAP): Equipment net sales, FY2025
$38.9B
Company's own measure: Order backlog, Nov 2, 2025 (about)
$9.7B
Orders Deere deems firm, as its FY2025 10-K reports them. By segment: about $4.0 billion Production & Precision Agriculture, $1.9 billion Small Agriculture & Turf, $3.8 billion Construction & Forestry (total: Cityfort calculation from FY2025 10-K). It was about $9.5 billion a year earlier. It is not a GAAP figure.
These are the company's own measures, defined by the company. They are not comparable across companies, and they are not added together. Each sits beside the nearest official (GAAP) figure.
Learn: Non-GAAP measures: what a company's "adjusted" numbers leave out
19Financial strength and debt
19Financial strength · Aug 2, 2026
How much debt does Deere have?
- Total debt$63.8B
- Cash and investments$8.9B
- Net debt (debt minus cash)$54.9B
- Net worth (shareholders' money)$28.0B
- Debt to equity
- 2.3×
- $ of debt for every $1 of shareholders' money
- Net debt of $54,908 million is total borrowings minus cash (Cityfort calculation from the Q3 FY2026 earnings release). Borrowings were $63,936 million at the end of FY2025.
- John Deere Financial's $54,511 million of borrowings funds $49,176 million of financing receivables (loans owed by customers and dealers) and $7,400 million of machines leased out.
- The equipment business owed $9,325 million and held $6,607 million of cash: net debt of $2,718 million (Cityfort calculation from the Q3 FY2026 earnings release).
- Interest cover is left blank: most of the $3,170 million of FY2025 interest was John Deere Financial's cost of the money it lends, part of its running costs.
- Debt to equity of 2.3 uses Deere stockholders' equity of $27,990 million. Deere had $5,201 million of unused credit lines on Aug 2, 2026.
20Who owns it
20Who owns it · ownership as of Dec 30, 2025
Who owns Deere?
- Officers and directors (as a group), shares
- 0.3%
Share classes
Holders of 5% or more
From the company's proxy statement (DEF 14A), later Schedule 13G filings and the share counts on its latest annual or quarterly report. Each holder row shows the date of its own filing.
Insider trades · Form 4 data as of Nov 6, 2026
What did Deere's insiders report trading?
Deere's insiders made 38 Form 4A filing an insider must make within two business days of buying or selling the company's shares. Learn more filings in the 12 months to Nov 6, 2026.
They reported no purchases and 27 sales (100,537 shares) in the open market or privately (codes P and S).
27 of the 27 sales were on forms with the Rule 10b5-1 plan box checked.
The same filings report 57 other share transactions (A: 21, F: 21, M: 15).
They also report 25 transactions in options, stock units or other derivatives.
Insiders are a company's officers, directors and owners of more than 10% of a class of its shares. Most changes in their holdings must be reported to the SEC on a Form 4 within two business days. Source: SEC Form 4 filings on EDGAR.
- P
- a purchase in the open market or privately
- S
- a sale in the open market or privately
- A
- a grant, award or other acquisition from the company under Rule 16b-3
- F
- shares withheld or handed over to pay an exercise price or tax when an award is received, exercised or vests
- M
- exercise or conversion of an option or other derivative, exempt under Rule 16b-3
Code meanings: General Instruction 8 of Form 4 (SEC).
The latest 25 of 84 transactions
Shares: A = acquired, D = disposed of. A price the filing gives only in a footnote shows as “See filing”. The 10b5-1 box is checked when at least one trade on the form was made under a Rule 10b5-1 plan. A Form 4/A replaces the form it amends. See all of Deere's Form 4 filings on EDGAR.
Learn: How to read a proxy statement (DEF 14A): Nvidia's 2026 proxy · Form 4 insider filings: who files, the codes and the footnotes · Rule 10b5-1 trading plans: how insiders pre-schedule their trades
Sources (6)
- Form 10-Q, Q3 FY2026 (quarter ended Aug 2, 2026)
- Form 10-K, fiscal year 2025 (ended Nov 2, 2025)
- Form 10-K, fiscal year 2021 (ended Oct 31, 2021)
- Definitive proxy statement (DEF 14A) for the Feb 25, 2026 annual meeting
- Schedule 13G/A (Amendment No. 10) by The Vanguard Group, event date Mar 13, 2026
- Schedule 13G by Vanguard Capital Management, event date Mar 31, 2026
21What it does with profit
21What it does with profit
What does Deere do with its profit?
Dividend per share
$6.48FY2025
Dividend paid for each share, by financial year.
$ per share
See the numbers
Buyback · Oct 31, 2021
Common stock repurchased in FY2021.
$2.5B
Buyback · Oct 30, 2022
Common stock repurchased in FY2022.
$3.6B
Buyback · Oct 29, 2023
Common stock repurchased in FY2023.
$7.2B
Buyback · Oct 27, 2024
Common stock repurchased in FY2024.
$4.0B
Buyback · Nov 2, 2025
Common stock repurchased in FY2025.
$1.1B
Buyback · Aug 2, 2026
Common stock repurchased in the first nine months of FY2026.
$697M
Money raised · Oct 9, 2025
Deere Funding Canada sold $500 million of 4.150% notes due Oct 9, 2030, guaranteed by Deere.
$500M
Money raised · Jul 15, 2026
Deere Funding Canada sold $300 million of 4.850% notes due Jul 15, 2031, guaranteed by Deere.
$300M
Sources (5)
- Form 10-K, fiscal year 2023 (ended Oct 29, 2023)
- Form 10-K, fiscal year 2025 (ended Nov 2, 2025)
- Q3 FY2026 earnings release (8-K Ex. 99.1, Aug 20, 2026)
- 8-K filed Oct 9, 2025: Deere Funding Canada $500M 4.150% notes due 2030 (Item 8.01)
- 8-K filed Jul 15, 2026: Deere Funding Canada $300M 4.850% notes due 2031 (Item 8.01)
22Governance signals
22Governance signals
What do Deere's governance filings show?
- Auditor
- Deloitte & Touche LLP
- Auditor changes
- None in the period covered
- Audit qualifications
- None reported
- Related-party dealings
- This page does not summarize related-party transactions; the parts of the 2026 proxy statement used here cover ownership, pay, auditor fees and the insider trading policy. Deloitte's fees were $25.2 million for FY2025, $23.5 million of them for the audit.
- Credit rating
- Fitch, Moody's and S&P (as listed in Deere's 10-Q) A+ (Fitch), A1 (Moody's), A (S&P); short-term F1, Prime-1, A-1 (Stable at all three), Aug 27, 2026
A credit rating describes the company's ability to repay debt. It is not a rating of the share.
Flags to know about
other · Jul 7, 2025
CEO is also Chairman
John C. May holds both roles. R. Preston Feight has been Lead Director since Jul 7, 2025. Brian Sikes joined the board on Dec 4, 2025 and Julie Boland on Nov 2, 2026, making 11 directors, 10 of them independent. Dmitri Stockton will not stand for re-election in 2027.
other · Jan 22, 2026
CFO change in 2026
Joshua Jepsen resigned as CFO effective Feb 19, 2026. Deere's 8-K says this was not related to any financial or accounting issue. T. Brent Norwood became CFO on May 1, 2026.
regulatory · Jul 8, 2026
FTC repair lawsuit settled
On Jan 15, 2025, the FTC and the Attorneys General of Illinois and Minnesota sued Deere, alleging monopolization and unfair competition over access to repair; Arizona, Michigan and Wisconsin later joined the lawsuit. In the Jul 8, 2026 settlement, Deere agreed to provide certain repair resources to farmers and independent repair providers on "fair and reasonable terms", with regular reporting and FTC oversight. Deere's 10-Q states no amount.
other · Dec 18, 2025
Legal matters the company reports
Deere recorded a $95 million pretax accrual for an antitrust class action in Q4 FY2025. Its FY2025 10-K lists other unresolved legal actions, mostly product liability (including asbestos-related liability), employment, patent, trademark and antitrust matters, and says Deere believes "the reasonably possible range of losses for unresolved legal actions would not have a material effect on our financial statements".
disclosure
Dated 5% holder figures
The 2026 proxy's rows for Cascade, The Vanguard Group and BlackRock rest on filings from 2022 to 2024. Only the two 2026 Vanguard filings are newer.
disclosure
What the filings do not break out
The filings used here give no revenue by customer, no precision technology, subscription or parts revenue, no unit volumes or market shares, and backlog only once a year.
Sources (12)
- Definitive proxy statement (DEF 14A) for the Feb 25, 2026 annual meeting
- Form 10-Q, Q3 FY2026 (quarter ended Aug 2, 2026)
- Form 10-K, fiscal year 2025 (ended Nov 2, 2025)
- Q3 FY2026 earnings release (8-K Ex. 99.1, Aug 20, 2026)
- 8-K filed Jul 7, 2025: death of director Sherry M. Smith; R. Preston Feight named Lead Director (Item 8.01)
- 8-K filed Dec 4, 2025: Brian Sikes joins the board; Raj Kalathur to retire (Item 5.02, Ex. 99.1)
- 8-K filed Nov 2, 2026: Julie Boland appointed to the board (Item 5.02, Ex. 99.1)
- 8-K filed Jun 1, 2026: director Dmitri Stockton will not stand for re-election in 2027 (Item 5.02)
- 8-K filed Jan 22, 2026: CFO Joshua Jepsen resigns; Ryan Campbell acting CFO (Item 5.02)
- 8-K filed May 1, 2026: T. Brent Norwood elected CFO effective May 1, 2026 (Item 5.02, Ex. 99.1)
- Schedule 13G/A (Amendment No. 10) by The Vanguard Group, event date Mar 13, 2026
- Schedule 13G by Vanguard Capital Management, event date Mar 31, 2026
23What the market paid
23What the market paid · price as of Nov 5, 2026
What did the market pay for Deere on Nov 5, 2026?
Price as of Nov 5, 2026 (shown for education; prices change daily).
Price as of Nov 5, 2026: a $663.31 close, from Nasdaq's historical price table for DE; Deere's shares are listed on the NYSE. Closes from Oct 26 to Nov 5, 2026 ranged from $639.58 to $676.50. Market value = $663.31 × 269,625,412 shares (Q3 FY2026 10-Q cover) = $178,845 million (Cityfort calculation from the Nov 5, 2026 closing price and the Q3 FY2026 10-Q). P/E is price ÷ earnings per share: 36.9 on the last four quarters' diluted EPS of $17.99 (Cityfort calculation from the Nov 5, 2026 closing price and the Q4 FY2025 and Q3 FY2026 earnings releases), or 35.9 on FY2025 diluted EPS of $18.50.
- Share price
- $663.31
- Market value (market cap)
- $178.8B
- P/E
- 36.9×
More price-based ratios · as of Nov 5, 2026
Each ratio divides a number from the company's filings by the market value or share price on Nov 5, 2026. Prices change daily, so these ratios do too.
Price to sales (P/S)
3.7×
$178.8B market value ÷ $48.0B revenue (four quarters to Aug 2, 2026) = 3.7×
Cityfort calculation from the Nov 5, 2026 closing price and the Q4 FY2025 to Q3 FY2026 earnings releases. Source: DE historical prices, Oct 26 to Nov 5, 2026 (Nasdaq.com historical table; DE is listed on the NYSE); Form 10-Q, Q3 FY2026 (quarter ended Aug 2, 2026); Q4 and FY2025 earnings release (8-K Ex. 99.1, Nov 26, 2025) and 4 more
How price ratios workDividend yield
0.98%
$6.48 dividends per share (FY2025) ÷ $663.31 share price = 0.98%
Cityfort calculation from the FY2025 10-K and the Nov 5, 2026 closing price. Source: DE historical prices, Oct 26 to Nov 5, 2026 (Nasdaq.com historical table; DE is listed on the NYSE); Form 10-Q, Q3 FY2026 (quarter ended Aug 2, 2026); Q4 and FY2025 earnings release (8-K Ex. 99.1, Nov 26, 2025) and 2 more
What dividend yield meansFree cash flow yield
3.4%
$6.1B free cash flow (FY2025) ÷ $178.8B market value = 3.4%
Cityfort calculation from the FY2025 10-K and the Nov 5, 2026 closing price. Source: DE historical prices, Oct 26 to Nov 5, 2026 (Nasdaq.com historical table; DE is listed on the NYSE); Form 10-Q, Q3 FY2026 (quarter ended Aug 2, 2026); Q4 and FY2025 earnings release (8-K Ex. 99.1, Nov 26, 2025) and 2 more
What free cash flow means
Shares used for the market value: 269.63 million ($663.31 × 269.63 million shares ≈ $178.8B). Source: Form 10-Q, Q3 FY2026 (quarter ended Aug 2, 2026); Form 10-K, fiscal year 2025 (ended Nov 2, 2025); Form 10-K, fiscal year 2021 (ended Oct 31, 2021)
Source: DE historical prices, Oct 26 to Nov 5, 2026 (Nasdaq.com historical table; DE is listed on the NYSE); Form 10-Q, Q3 FY2026 (quarter ended Aug 2, 2026); Q4 and FY2025 earnings release (8-K Ex. 99.1, Nov 26, 2025) and 2 more
Sources (8)
- DE historical prices, Oct 26 to Nov 5, 2026 (Nasdaq.com historical table; DE is listed on the NYSE)
- Form 10-Q, Q3 FY2026 (quarter ended Aug 2, 2026)
- Q4 and FY2025 earnings release (8-K Ex. 99.1, Nov 26, 2025)
- Q3 FY2026 earnings release (8-K Ex. 99.1, Aug 20, 2026)
- Form 10-K, fiscal year 2025 (ended Nov 2, 2025)
- Q1 FY2026 earnings release (8-K Ex. 99.1, Feb 19, 2026)
- Q2 FY2026 earnings release (8-K Ex. 99.1, May 21, 2026)
- Form 10-K, fiscal year 2021 (ended Oct 31, 2021)
24How it got here
24How it got here
How did Deere get here?
1837
Milestone
Farm equipment maker
Deere's FY2025 10-K says John Deere has made agricultural equipment since 1837.
1958
Milestone
Incorporated in Delaware
Deere & Company was incorporated in Delaware in 1958.
2023
Milestone
Peak year
Net income reached $10,166 million in FY2023 on total net sales and revenues of $61,251 million. Deere also spent $7,216 million on buybacks that year.
2025
Business-model change
Brazilian bank half sold
Bradesco became a 50% owner of Banco John Deere in Brazil in February 2025. Deere now accounts for it as an equity investment.
2025
Crisis
FTC repair lawsuit
On Jan 15, 2025, the FTC and the Attorneys General of Illinois and Minnesota sued Deere, alleging monopolization and unfair competition over access to repair; Arizona, Michigan and Wisconsin later joined. The case was settled on Jul 8, 2026.
2025
Crisis
Farm downturn and tariffs
FY2025 net income fell to $5,027 million, about half the FY2023 level. Deere put the direct cost of new tariffs at about $600 million that year.
2026
Milestone
Tariff recoveries and Tenna
After the Supreme Court's Feb 20, 2026 IEEPA decision, Deere recorded $382 million of tariff recoveries in nine months. It also bought Tenna LLC for $439 million net of cash.
25Sources and changes
Where every number on this page comes from
Sources (26 documents)
- S1Form 10-K, fiscal year 2025 (ended Nov 2, 2025) · Deere & Company (SEC EDGAR) · Tier 1: company or exchange filing · Dec 18, 2025
- S3Form 10-K, fiscal year 2023 (ended Oct 29, 2023) · Deere & Company (SEC EDGAR) · Tier 1: company or exchange filing · Dec 15, 2023
- S5Form 10-K, fiscal year 2021 (ended Oct 31, 2021) · Deere & Company (SEC EDGAR) · Tier 1: company or exchange filing · Dec 16, 2021
- S6Form 10-Q, Q3 FY2026 (quarter ended Aug 2, 2026) · Deere & Company (SEC EDGAR) · Tier 1: company or exchange filing · Aug 27, 2026
- S12Q3 FY2026 earnings release (8-K Ex. 99.1, Aug 20, 2026) · Deere & Company (SEC EDGAR) · Tier 1: company or exchange filing · Aug 20, 2026
- S13Q2 FY2026 earnings release (8-K Ex. 99.1, May 21, 2026) · Deere & Company (SEC EDGAR) · Tier 1: company or exchange filing · May 21, 2026
- S14Q1 FY2026 earnings release (8-K Ex. 99.1, Feb 19, 2026) · Deere & Company (SEC EDGAR) · Tier 1: company or exchange filing · Feb 19, 2026
- S15Q4 and FY2025 earnings release (8-K Ex. 99.1, Nov 26, 2025) · Deere & Company (SEC EDGAR) · Tier 1: company or exchange filing · Nov 26, 2025
- S16Q3 FY2025 earnings release (8-K Ex. 99.1, Aug 14, 2025) · Deere & Company (SEC EDGAR) · Tier 1: company or exchange filing · Aug 14, 2025
- S17Q2 FY2025 earnings release (8-K Ex. 99.1, May 15, 2025) · Deere & Company (SEC EDGAR) · Tier 1: company or exchange filing · May 15, 2025
- S18Q1 FY2025 earnings release (8-K Ex. 99.1, Feb 13, 2025) · Deere & Company (SEC EDGAR) · Tier 1: company or exchange filing · Feb 13, 2025
- S19Q4 and FY2024 earnings release (8-K Ex. 99.1, Nov 21, 2024) · Deere & Company (SEC EDGAR) · Tier 1: company or exchange filing · Nov 21, 2024
- S20Q3 FY2026 earnings call slides (8-K Ex. 99.2, Aug 20, 2026) · Deere & Company (SEC EDGAR) · Tier 1: company or exchange filing · Aug 20, 2026
- S21Q4 FY2025 earnings call slides (8-K Ex. 99.2, Nov 26, 2025) · Deere & Company (SEC EDGAR) · Tier 1: company or exchange filing · Nov 26, 2025
- S22Definitive proxy statement (DEF 14A) for the Feb 25, 2026 annual meeting · Deere & Company (SEC EDGAR) · Tier 1: company or exchange filing · Jan 14, 2026
- S23Schedule 13G/A (Amendment No. 10) by The Vanguard Group, event date Mar 13, 2026 · The Vanguard Group (SEC EDGAR) · Tier 1: company or exchange filing · Mar 26, 2026
- S24Schedule 13G by Vanguard Capital Management, event date Mar 31, 2026 · Vanguard Capital Management (SEC EDGAR) · Tier 1: company or exchange filing · Apr 29, 2026
- S258-K filed Nov 2, 2026: Julie Boland appointed to the board (Item 5.02, Ex. 99.1) · Deere & Company (SEC EDGAR) · Tier 1: company or exchange filing · Nov 2, 2026
- S268-K filed Jul 15, 2026: Deere Funding Canada $300M 4.850% notes due 2031 (Item 8.01) · Deere & Company (SEC EDGAR) · Tier 1: company or exchange filing · Jul 15, 2026
- S278-K filed Jun 1, 2026: director Dmitri Stockton will not stand for re-election in 2027 (Item 5.02) · Deere & Company (SEC EDGAR) · Tier 1: company or exchange filing · Jun 1, 2026
- S288-K filed May 1, 2026: T. Brent Norwood elected CFO effective May 1, 2026 (Item 5.02, Ex. 99.1) · Deere & Company (SEC EDGAR) · Tier 1: company or exchange filing · May 1, 2026
- S298-K filed Jan 22, 2026: CFO Joshua Jepsen resigns; Ryan Campbell acting CFO (Item 5.02) · Deere & Company (SEC EDGAR) · Tier 1: company or exchange filing · Jan 22, 2026
- S308-K filed Dec 4, 2025: Brian Sikes joins the board; Raj Kalathur to retire (Item 5.02, Ex. 99.1) · Deere & Company (SEC EDGAR) · Tier 1: company or exchange filing · Dec 4, 2025
- S318-K filed Oct 9, 2025: Deere Funding Canada $500M 4.150% notes due 2030 (Item 8.01) · Deere & Company (SEC EDGAR) · Tier 1: company or exchange filing · Oct 9, 2025
- S338-K filed Jul 7, 2025: death of director Sherry M. Smith; R. Preston Feight named Lead Director (Item 8.01) · Deere & Company (SEC EDGAR) · Tier 1: company or exchange filing · Jul 7, 2025
- S34DE historical prices, Oct 26 to Nov 5, 2026 (Nasdaq.com historical table; DE is listed on the NYSE) · Nasdaq, Inc. · Tier 1: company or exchange filing · Nov 5, 2026
Changes to this page (v1 · Nov 6, 2026)
- v1 · Nov 6, 2026First version, through Q3 FY2026 (quarter ended Aug 2, 2026). (first version)
Numbers come only from tier 1 and tier 2 sources. Read how we research.
Disclaimer
For learning only. Cityfort is not a registered investment adviser or broker-dealer and does not recommend buying or selling any security. Prices shown are dated and may be out of date.
Investing in securities involves risk, including loss of capital. Before making any investment decision, do your own research and consider consulting a registered investment adviser or other qualified professional.
Cityfort, its owners and contributors may or may not hold securities of companies covered. Cityfort is not paid by any company it covers. Content is not an offer or solicitation to buy or sell any security, including in any initial public offering.
Read the positions policyRead the full disclaimerHide the full disclaimer
Cityfort publishes general educational content that explains how listed companies work. Cityfort is not registered with the US Securities and Exchange Commission or any state securities regulator as an investment adviser, and is not a broker-dealer or a member of FINRA. Cityfort does not provide investment, tax or legal advice, recommendations, ratings, price targets or any opinion on whether to buy, sell or hold any security. Nothing on the site is tailored to any person's circumstances.
All information is taken from publicly available sources, mainly company filings with the SEC, which are listed on each page with dates. We work to keep it accurate and correct errors publicly, but we do not guarantee that it is complete, accurate or up to date. Any market price or price-based ratio shown is dated, may be out of date by the time you read it, and is included only to explain concepts.
Statements by company management, including forward-looking statements and guidance, are reported as the company's statements, with their date and source; they are not our forecasts. Adjusted (non-GAAP) figures are the company's own measures and are shown next to the official (GAAP) figures.