Utilities · NYSE: VST
Vistra: how the business works
Vistra sells electricity to about 5 million homes and businesses and runs about 44,000 MW of gas, coal, nuclear and solar power plants, with FY2025 revenue of $17.7 billion.
By Hardik Bhandare · Checked against filings: . Editorial policy. Corrections
Follow Vistra
Email me when Vistra's page is updated after earnings.
We'll send a confirmation email first. See our privacy policy.
Vistra Corp. · Irving, Texas
Updated for Q3 FY2026 · checked
- Revenue, FY2025
- $17.7B
- Net income to common stock, FY2025
- $752M
- Generation capacity, Dec 31, 2025
- 43,641 MW
- Retail customers, FY2025 10-K (about)
- 5 million
- Full-time employees, Dec 31, 2025 (about)
- 6,390
The short version
Vistra in 5 points
1 · What it sells
Vistra sells electricity to about 5 million retail customers and into wholesale markets from 43,641 MW of gas, coal, nuclear and solar plants at Dec 31, 2025.
2 · Who pays it
In FY2025, retail customers paid 73.4% of Vistra's revenue, wholesale power markets and contract buyers 25.7%, and hedges, tax credits sold and other items 0.9%.
3 · What it keeps from $100
Of every $100 that came in during FY2025, Vistra kept $4.15 as net income for common stockholders, after an $808 million unrealized pre-tax hedge loss, while operating income was $10.51.
4 · Where the operating profit comes from
In FY2025, Vistra's Texas plants earned $1,604 million of segment net income and Retail $1,290 million, while the East segment lost $91 million and Asset Closure $279 million.
5 · The one thing to watch
Total debt was $19,895 million on Jun 30, 2026; after the roughly 5,500 MW Cogentrix purchase closed on Oct 30, 2026, Vistra repaid about $1.7 billion of the debt it assumed.
Sources: From Vistra's FY2025 10-K, Q2 FY2026 10-Q and the 8-K filed Nov 5, 2026 · checked
See the full receipt and the management scorecard below
Sources (5)
- Form 10-K, fiscal year 2025 (ended Dec 31, 2025)
- Earnings release, Q4 and full year 2025 (Form 8-K, Exhibit 99.1)
- Form 10-Q, Q2 2026 (quarter ended Jun 30, 2026)
- Form 8-K filed Nov 5, 2026: completion of the Cogentrix Energy acquisition (Items 2.01, 2.03, 3.02; Exhibit 99.1)
- Earnings release, Q3 2026 (Form 8-K, Exhibit 99.1)
01Where the money goes · FY2025
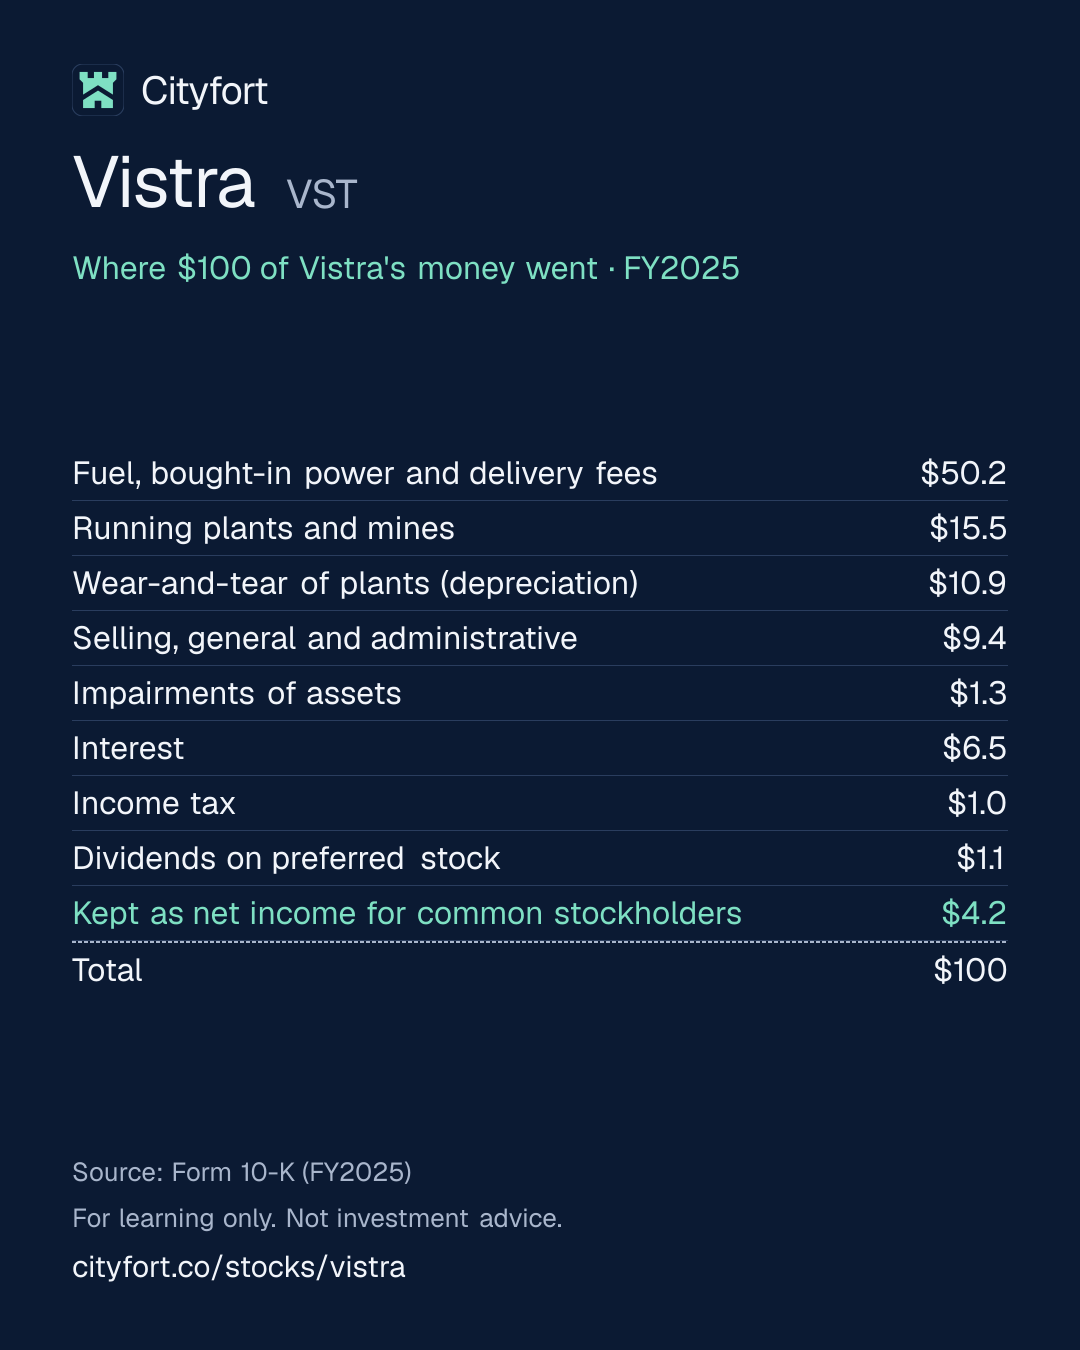
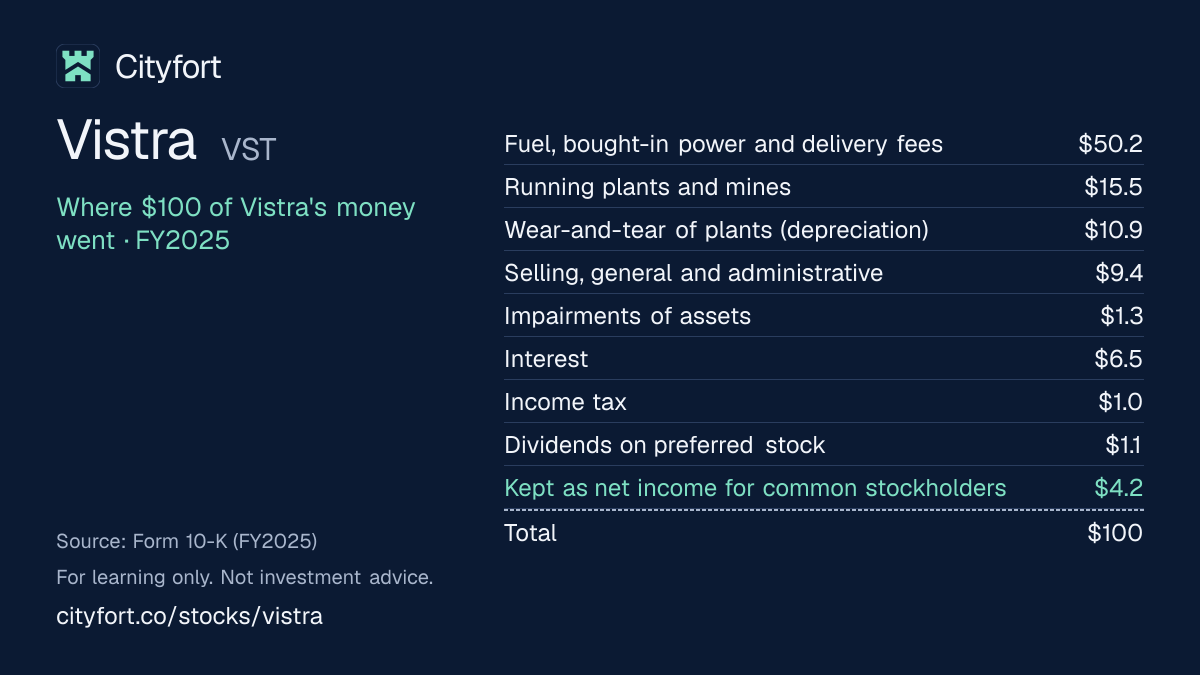
Where does $100 of Vistra's money go?
Vistra · FY2025
Receipt for every $100
| Fuel, bought-in power and delivery fees | $50.2 |
|---|---|
| Running plants and mines | $15.5 |
| Wear-and-tear of plants (depreciation) | $10.9 |
| Selling, general and administrative | $9.4 |
| Impairments of assets | $1.3 |
| Interest | $6.5 |
| Income tax | $1.0 |
| Dividends on preferred stock | $1.1 |
| Kept as net income for common stockholders | $4.2 |
| Total | $100 |
Each line = amount ÷ total money in × 100. Lines may not add to exactly $100 because of rounding.
How this is worked out
Cityfort calculation from the FY2025 10-K. Of every $100 that came in during FY2025 (operating revenues $17,738 million + other income $396 million = $18,134 million), each line = line ÷ $18,134 million × 100. Revenue is net of a $766 million unrealized hedge loss. Operating income was $10.51 of each $100.
Save this receipt as an image:
1080 × 1350 PNG for Instagram, LinkedIn1200 × 675 PNG for X
Embed this receipt
Paste this code into a blog or website to show the receipt, with a link back to this page:
Each week: one company explained in 5 points, picked by earnings date.
Free, no tips, unsubscribe anytime.
We'll send a confirmation email. See our privacy policy.
02The business in one line
What does Vistra do?
Homes, businesses and wholesale power markets pay Vistra for electricity; about half of the money goes on fuel, bought-in power and delivery fees, and $4.15 of every $100 that came in during FY2025 was left for common stockholders.
- Retail customers paid 73.4% of Vistra's FY2025 revenue of $17,738 million, and wholesale power markets and contract buyers 25.7%.
- Vistra's own plants, 43,641 MW at Dec 31, 2025, supply much of the power its retail brands such as TXU Energy sell.
03Who pays it
Who pays Vistra?
Retail customers (homes and businesses)
73%
of revenue
73.4% of FY2025 revenue, or $13,025 million: $8,966 million of retail energy charges in Texas (ERCOT) and $4,059 million in the Northeast and Midwest. About 5 million customers.
Wholesale power markets and contract buyers
26%
of revenue
25.7% of FY2025 revenue, or $4,561 million: power sold into grid markets ($3,188 million), net capacity payments ($227 million) and other wholesale contracts ($1,146 million).
Hedges, tax credits sold and other items
1%
of revenue
0.9% of FY2025 revenue, or $152 million, net: tax credits sold ($229 million), realized hedge gains ($583 million), insurance ($118 million) and other items, less a $766 million unrealized hedge loss.
- Retail customers (homes and businesses)73%
- Wholesale power markets and contract buyers26%
- Hedges, tax credits sold and other items1%
How spread out the customers are
Vistra discloses no customer that pays 10% or more of revenue. Shares by payer type are a Cityfort calculation from the FY2025 10-K's revenue note.
04Why it makes money
Why does Vistra make money?
Vistra earns the gap between what power sells for and what its plants spend on fuel, and it locks in much of that gap ahead of time with hedges and its own retail customers.
Vistra's plants sell power to its own retail arm: $8,531 million of FY2025 sales between segments were removed in the total. Vistra said it had hedged about 100% of expected 2026 generation and about 98% of 2027 as of Oct 30, 2026. Hedges that are not yet settled change value with power prices, which swings GAAP profit.
Operating income per $100 of revenue
−$12.5$10.7
FY2021 to FY2025
- Plants burn gas, coal or nuclear fuel to make power
- Power goes to Vistra's retail customers or into wholesale markets
- Hedges and retail contracts fix much of the price ahead of time
- Grid operators also pay for plants to be available (capacity)
- The gap between power prices and fuel costs pays for plants, interest, buybacks and dividends
↺ Step 5 feeds back into step 1.
05Business segments · FY2025
Which businesses make up Vistra?
Retail
55%Sells electricity and gas to homes and businesses. The profit figure is segment net income. Shares are of segment revenue before Corporate and eliminations of minus $8,528 million, mostly sales between segments (Cityfort calculation from the FY2025 10-K). Segment net income was $1,290 million in FY2025.
Revenue $14.3B · Operating profit $1.3B
Texas
20%Power plants in the ERCOT grid, including Comanche Peak nuclear: 19,858 MW at Dec 31, 2025. Segment net income was $1,604 million in FY2025.
Revenue $5.4B · Operating profit $1.6B
East
24%Power plants in the PJM, ISO New England, MISO and New York grids, including four nuclear units: 22,254 MW at Dec 31, 2025. Its FY2025 segment net income was a $91 million loss.
Revenue $6.2B · Operating profit −$91M
West
1%Plants in California (CAISO): 1,529 MW at Dec 31, 2025. Segment net income was $54 million in FY2025.
Revenue $325M · Operating profit $54M
Asset Closure
0%Plants being retired or shut, including the Moss Landing batteries; FY2025 segment net income was a $279 million loss. Segment net incomes add to $2,578 million against Vistra's total of $944 million; the rest sits in Corporate and Other and eliminations (Cityfort calculation from the FY2025 10-K).
Revenue $74M · Operating profit −$279M
How the mix changed
- Retail
- Texas
- East
- West
- Asset Closure
Revenue by segment, FY2023 to FY2025.
US$
See the numbers
06The numbers · Consolidated · US$
How has Vistra done?
Revenue
$17.7BFY2025
Revenue rose every year, from $12,077 million in FY2021 to $17,738 million in FY2025, and it includes hedge results, such as a $766 million unrealized loss in FY2025.
US$
See the numbers
Net profit
$752MFY2025
Net income to common stock was a loss in FY2021 and FY2022, reached $2,467 million in FY2024 and was $752 million in FY2025, after an $808 million unrealized pre-tax hedge loss.
US$
See the numbers
Profit kept per $100 of revenue
$4.2FY2025
Operating income was $10.7 per $100 of revenue in FY2025, down from $23.7 in FY2024; Q4 quarters are a Cityfort calculation from the FY2024 and FY2025 10-Ks and the Q3 FY2024 and Q3 FY2025 earnings releases, and Vistra reports no Q4 EPS.
$ of profit per $100 of revenue (net margin)
See the numbers
Free cash flow
$1.3BFY2025
Free cash flow was negative in FY2021 and FY2022, when cash posted as collateral rose, and was $1,318 million in FY2025 after $2,752 million of capital spending.
US$ · cash from operations minus spending on plants and equipment
See the numbers
See all yearly numbers
EBITDA here = operating income plus depreciation and amortization (from the cash flow statement). Fiscal years are the company's own (Fiscal year ends Dec 31). Net profit is the share belonging to the company's owners. Total net income differs from net profit to the company's owners: Net income to common stock is after $192 million of preferred dividends; total net income was $944 million.
Download Vistra's yearly and quarterly numbers (CSV, with source ids)
What revenue is made of · FY2025
Vistra's revenue includes hedge results: an unrealized hedge loss of $766 million and realized hedge gains of $583 million in FY2025. Unrealized results are paper gains or losses on hedges not yet settled and can reverse.
Revenue by type
Learn: Fiscal years that don't end in December: Nvidia's FY2027 explained · Stock-based compensation and dilution: pay that becomes shares
Sources (16)
- Form 10-K, fiscal year 2023 (ended Dec 31, 2023)
- Form 10-K, fiscal year 2022 (ended Dec 31, 2022)
- Form 10-K, fiscal year 2025 (ended Dec 31, 2025)
- Earnings release, Q3 2024 (Form 8-K, Exhibit 99.1)
- Form 10-Q, Q3 2024 (quarter ended Sep 30, 2024)
- Earnings release, Q3 2025 (Form 8-K, Exhibit 99.1)
- Earnings release, Q1 2025 (Form 8-K, Exhibit 99.1)
- Form 10-Q, Q1 2025 (quarter ended Mar 31, 2025)
- Earnings release, Q2 2025 (Form 8-K, Exhibit 99.1)
- Form 10-Q, Q2 2025 (quarter ended Jun 30, 2025)
- Form 10-Q, Q3 2025 (quarter ended Sep 30, 2025)
- Earnings release, Q3 2026 (Form 8-K, Exhibit 99.1)
- Earnings release, Q1 2026 (Form 8-K, Exhibit 99.1)
- Form 10-Q, Q1 2026 (quarter ended Mar 31, 2026)
- Earnings release, Q2 2026 (Form 8-K, Exhibit 99.1)
- Form 10-Q, Q2 2026 (quarter ended Jun 30, 2026)
07Who runs it
Who runs Vistra, and did they deliver?
James A. Burke
President and Chief Executive Officer · since 2022
CEO since Aug 1, 2022, after serving as President and Chief Financial Officer. His 2025 total pay in the Summary Compensation Table was $15,989,188; the CEO pay ratio was 117 to 1. He beneficially owned 1,513,011 shares on Mar 3, 2026, including vested options.
Kristopher E. Moldovan
Executive Vice President and Chief Financial Officer · since 2022
CFO since August 2022; earlier Senior Vice President and Treasurer from 2017 to 2022.
What they said, and what happened
2 delivered · 2 too early to tell
Said on Feb 27, 2025
Vistra's Q4 FY2024 earnings release (Feb 27, 2025) reaffirmed 2025 Ongoing Operations Adjusted EBITDAOperating profit before wear-and-tear charges (depreciation and amortization). As a margin: per $100 of sales. guidance of $5.5 to $6.1 billion and adjusted free cash flowCash from operations minus spending on buildings and equipment. Learn more before growth of $3.0 to $3.6 billion, ranges first given in November 2024.
DeliveredWhat happened
FY2025 results were $5,912 million and $3,592 million, both company measures. GAAP net income was $944 million.
Said on Jan 5, 2026
In agreements signed on Dec 31, 2025 and announced on Jan 5, 2026, Vistra agreed to buy Cogentrix Energy, about 5,500 MW of gas plants, for about $2.3 billion in cash, 5 million shares and about $1.5 billion of assumed debt.
DeliveredWhat happened
The purchase closed on Oct 30, 2026 with about $2.2 billion in cash, 5,000,000 shares and about $1.7 billion of debt assumed.
Said on Jan 5, 2026
Vistra said on Jan 5, 2026 that it plans about $300 million of dividends and at least $1 billion of buybacks each year, with long-term net leverage below 3 times.
Too early to tellWhat happened
In the first nine months of FY2026, Vistra bought back $917 million of shares and paid $231 million of common dividends.
Said on Nov 6, 2025
Vistra first gave 2026 Ongoing Operations Adjusted EBITDA guidance of $6.8 to $7.6 billion in its Q3 FY2025 earnings release (Nov 6, 2025), and its Q4 FY2025 release (Feb 26, 2026) restated the range, excluding Cogentrix.
Too early to tellWhat happened
On Nov 6, 2026 Vistra narrowed the range to $7.1 to $7.5 billion; the first nine months came to $5,639 million (company measure).
Sources (8)
- 2026 proxy statement (DEF 14A)
- Earnings release, Q4 and full year 2024 (Form 8-K, Exhibit 99.1)
- Earnings release, Q4 and full year 2025 (Form 8-K, Exhibit 99.1)
- Form 10-K, fiscal year 2025 (ended Dec 31, 2025)
- Form 8-K filed Jan 5, 2026: agreements to acquire Cogentrix Energy (Exhibit 99.1 press release)
- Form 8-K filed Nov 5, 2026: completion of the Cogentrix Energy acquisition (Items 2.01, 2.03, 3.02; Exhibit 99.1)
- Earnings release, Q3 2026 (Form 8-K, Exhibit 99.1)
- Earnings release, Q3 2025 (Form 8-K, Exhibit 99.1)
08What could go wrong
What could go wrong for Vistra?
- Raw-material prices
Power and fuel prices, and hedges
The FY2025 10-K says Vistra cannot fully hedge its plants against commodity prices, and hedges may fail or counterparties may default. Unrealized hedge results swung FY2025 results by an $808 million pre-tax loss.
Watch The unrealized hedge line in each earnings release, and the hedged share of future generation (about 98% of 2027 as of Oct 30, 2026, per Vistra).
- Demand
Demand growth and large power deals
The 10-K names slower electricity demand growth, or failure to sign long-term deals with large users, as a risk. The Amazon Web Services deal starts deliveries in Q4 2027.
Watch New long-term power deals and the start of Comanche Peak deliveries in Q4 2027.
- Debt
Rising debt and collateral needs
Total debt rose from $10,731 million at Dec 31, 2021 to $19,895 million on Jun 30, 2026. Vistra then issued $1.5 billion of notes in September 2026, and in October and November 2026 it fully drew its accounts receivable financing facilities and repaid about $1.7 billion of debt assumed in the Cogentrix purchase. Interest expense was $1,179 million in FY2025. The 10-K names liquidity in volatile markets as a risk.
Watch Total debt in the Q3 FY2026 10-Q, and the S&P and Fitch BBB- ratings.
- Regulation
Environmental and market rules
The 10-K names regulation, coal ash rules, climate rules, state and federal market interference and subsidized generation as risks. Coal plants were 8,743 MW, or 20% of capacity, at Dec 31, 2025.
Watch Rule changes for coal plants and power market design in ERCOT and PJM.
- Execution
Nuclear and plant accidents
The 10-K names nuclear operational, regulatory and accident risk. A fire took Martin Lake Unit 1 (815 MW) out of service from Nov 27, 2024 until February 2026, with about $384 million of restoration spending.
Watch Fleet availability, which Vistra put at nearly 95% in Q3 FY2026, and any unplanned outages.
- Legal
Moss Landing fire lawsuits
Lawsuits have been filed in California courts against Vistra, LG Energy Solution and others after the Jan 16, 2025 fire. Vistra recorded a $269 million impairment on Moss Landing 350 in Q3 FY2026.
Watch Updates on the lawsuits and the EPA consent order in the 10-Q and 10-K.
- Other
Extreme weather
The 10-K says extreme weather, such as Winter Storm Uri in February 2021, has hurt results. Vistra lost $1,295 million for common stockholders in FY2021.
Watch Results after winter and summer weather events in Texas and the PJM region.
- Competition
Retail competition
The 10-K names competition from other retail electric providers and volatile supply costs for retail as risks. Retail paid 73.4% of FY2025 revenue.
Watch Retail segment net income ($1,290 million in FY2025) and customer counts in the 10-K.
Sources (9)
- Form 10-K, fiscal year 2025 (ended Dec 31, 2025)
- Earnings release, Q4 and full year 2025 (Form 8-K, Exhibit 99.1)
- Earnings release, Q3 2026 (Form 8-K, Exhibit 99.1)
- Form 8-K filed Sep 29, 2025: 20-year Comanche Peak power purchase agreement (Item 8.01)
- Form 10-K, fiscal year 2022 (ended Dec 31, 2022)
- Form 10-Q, Q2 2026 (quarter ended Jun 30, 2026)
- Form 8-K filed Sep 24, 2026: $1.5 billion junior subordinated notes due 2057 (Items 1.01, 8.01)
- Form 8-K filed Nov 5, 2026: completion of the Cogentrix Energy acquisition (Items 2.01, 2.03, 3.02; Exhibit 99.1)
- Form 10-K, fiscal year 2023 (ended Dec 31, 2023)
09Both sides
What do supporters and critics point to?
What supporters point to
- Revenue rose every year from $12,077 million in FY2021 to $17,738 million in FY2025.
- Vistra has 20-year power deals with Amazon Web Services (1,200 MW) and Meta (2,609 MW).
- S&P (Dec 2, 2025) and Fitch (Mar 16, 2026) raised their ratings on Vistra Operations to BBB-, an investment-grade level.
- Vistra cleared about 10,314 MW in PJM's 2026/27 capacity auction at $329.17 per MW-day.
- Vistra says its share count is down 30% since Nov 2, 2021, after $6.7 billion of buybacks.
What critics point to
- Net income to common stock moved from a $1,377 million loss in FY2022 to $2,467 million in FY2024 and $752 million in FY2025, partly with hedge results.
- Total debt rose from $10,731 million at Dec 31, 2021 to $19,895 million on Jun 30, 2026, before $1.5 billion of notes issued in September 2026 and a full draw on the accounts receivable financing facilities in October and November 2026.
- Stockholders' equity was $5,097 million at Dec 31, 2025, including $2,476 million of preferred stock, after $6,925 million of shares were bought back and held.
- Coal plants made up 8,743 MW, or 20% of capacity, at Dec 31, 2025.
- The Moss Landing fire led to an EPA consent order, lawsuits and a $269 million impairment in Q3 FY2026.
10What to watch next
What should you watch next at Vistra?
Next event
Q4 FY2026 results
Date not announced yet.
The Q3 FY2026 10-Q
Not yet filed on Nov 7, 2026. It will give Q3 EPS, the Sep 30, 2026 balance sheet and debt, and the share count after the Cogentrix shares.
Cogentrix and debt
Cogentrix added about 5,500 MW on Oct 30, 2026. In October and November 2026, Vistra repaid about $1.7 billion of debt assumed in the purchase and fully drew its accounts receivable financing facilities. Total debt was $19,895 million on Jun 30, 2026.
2026 results against guidance
Vistra narrowed 2026 Ongoing Operations Adjusted EBITDA guidance to $7.1 to $7.5 billion on Nov 6, 2026; the first nine months were $5,639 million (company measures).
Hedges in GAAP profit
Q3 FY2026 net income to common stock of $1,092 million included a $559 million unrealized hedge gain.
11Key dates
What are the key dates for Vistra?
| Event | Date | Source |
|---|---|---|
| Last day of the lock-up on the 5,000,000 shares issued for CogentrixThe seller, Q-Generation Holdings, agreed not to transfer the shares through this date, subject to certain exceptions. | Form 8-K filed Nov 5, 2026: completion of the Cogentrix Energy acquisition (Items 2.01, 2.03, 3.02; Exhibit 99.1) | |
| Comanche Peak deliveries to Amazon Web Services beginVistra said deliveries start in Q4 2027 and reach the full 1,200 MW by 2032. | Not yet stated | Form 8-K filed Sep 29, 2025: 20-year Comanche Peak power purchase agreement (Item 8.01); Earnings release, Q4 and full year 2025 (Form 8-K, Exhibit 99.1) |
Learn: IPO lock-up agreements: what they are and when they end
12Key facts
Key facts about Vistra
- What does Vistra do?
- Vistra Corp. is a Texas-based company that generates electricity and sells it. It had 43,641 MW of power plants at Dec 31, 2025: 62% natural gas, 20% coal, 15% nuclear and 3% solar and batteries. Its retail business sells electricity and natural gas in 16 states and Washington, D.C., through brands such as TXU Energy, and Vistra serves about 5 million retail customers.
- How does Vistra make money, and what is its business model?
- Vistra's business model joins power plants with retail electricity brands. Its plants sell power into wholesale markets and to its own retail arm, and the retail arm bills homes and businesses. In FY2025, Vistra's revenue was $17,738 million: $13,025 million (73.4%) from retail energy charges and $4,561 million (25.7%) from wholesale power, capacity and contract sales.
- Is Vistra profitable?
- Yes, in FY2023 to FY2025. Vistra's FY2025 net income to common stock was $752 million, or $2.18 per diluted share, down from $2,467 million in FY2024; FY2025 included an $808 million unrealized pre-tax loss on hedges for future years. Vistra lost $1,295 million in FY2021 and $1,377 million in FY2022.
- What is Vistra's revenue by segment?
- In FY2025, Vistra's Retail segment had revenue of $14,340 million, Texas $5,353 million, East $6,174 million, West $325 million and Asset Closure $74 million. These include sales between segments, mostly power the plants sell to Retail; after Corporate and eliminations of minus $8,528 million, total revenue was $17,738 million.
- Who are Vistra's customers?
- Vistra's customers are about 5 million retail electricity and natural gas customers, about 2.6 million of them in Texas, plus wholesale power markets such as ERCOT and PJM. Vistra discloses no customer that pays 10% of revenue. It has signed 20-year power deals with Amazon Web Services for 1,200 MW from Comanche Peak and with Meta for 2,609 MW from its PJM nuclear plants.
- Who owns Vistra?
- Vistra's largest reported holders include Vanguard Capital Management with 7.25% and Vanguard Portfolio Management with 5.01% (Mar 31, 2026), BlackRock with 8.4% and Qatar Investment Authority with 5.5% (as listed in the 2026 proxy statementThe yearly filing about shareholder votes, the board and executive pay. Learn more), and State Street with 5.0% (Jun 30, 2026). Vistra's directors and executive officers as a group held about 0.92% on Mar 3, 2026 (Cityfort calculation from the 2026 proxy statement).
- What is Vistra's retail electricity business?
- Vistra's Retail segment sells electricity and natural gas to about 5 million customers under brands including TXU Energy, Ambit, Dynegy, Energy Harbor and U.S. Gas & Electric. Retail had FY2025 revenue of $14,340 million and segment net income of $1,290 million.
- How big is Vistra's power plant fleet?
- Vistra had 43,641 MW of generation capacity at Dec 31, 2025: 26,989 MW natural gas, 8,743 MW coal, 6,448 MW nuclear, 1,274 MW solar and batteries and 187 MW fuel oil. After buying Cogentrix (about 5,500 MW) on Oct 30, 2026, Vistra says its fleet is nearly 50,000 MW.
- What nuclear plants does Vistra own?
- Vistra owns Comanche Peak 1 and 2 in Texas (1,200 MW each) and Beaver Valley 1 and 2, Perry and Davis-Besse in the PJM region, for 6,448 MW of nuclear capacity at Dec 31, 2025. Their operating licenses run to between 2036 and 2053.
- How much debt does Vistra have?
- Vistra had total debt of $19,895 million and cash of $435 million on Jun 30, 2026, up from debt of $10,731 million at Dec 31, 2021 (Cityfort calculation from the Q2 FY2026 10-Q and the FY2022 10-K). Vistra later issued $1.5 billion of junior subordinated notes in September 2026. In October and November 2026 it fully drew its accounts receivable financing facilities and repaid about $1.7 billion of debt it assumed in the Cogentrix purchase, which closed on Oct 30, 2026.
Sources (14)
- Form 10-K, fiscal year 2025 (ended Dec 31, 2025)
- Form 10-K, fiscal year 2023 (ended Dec 31, 2023)
- Earnings release, Q4 and full year 2025 (Form 8-K, Exhibit 99.1)
- Form 8-K filed Jan 9, 2026: 20-year power purchase agreements with Meta (Item 7.01)
- Form 8-K filed Sep 29, 2025: 20-year Comanche Peak power purchase agreement (Item 8.01)
- Schedule 13G by Vanguard Capital Management, filed Apr 28, 2026
- Schedule 13G by Vanguard Portfolio Management, filed Apr 28, 2026
- 2026 proxy statement (DEF 14A)
- Schedule 13G by State Street Corporation, filed Aug 7, 2026
- Form 8-K filed Nov 5, 2026: completion of the Cogentrix Energy acquisition (Items 2.01, 2.03, 3.02; Exhibit 99.1)
- Form 10-Q, Q2 2026 (quarter ended Jun 30, 2026)
- Form 10-K, fiscal year 2022 (ended Dec 31, 2022)
- Form 8-K filed Sep 24, 2026: $1.5 billion junior subordinated notes due 2057 (Items 1.01, 8.01)
- Earnings release, Q3 2026 (Form 8-K, Exhibit 99.1)
Terms on this page
- Capital expenditures (capex)
- Debt-to-equity
- Dividend payout ratio
- Earnings per share (EPS)
- EBITDA
- Free cash flow
- Market cap
- Net debt
- Net margin
- P/E ratio
Each explains the term in plain English, with the same number from other companies on Cityfort.
Go deeper
More detail from the same filings. Open any section.
13What it sells
13What it sells
What does Vistra sell?
Retail electricity and natural gas
Monthly power and gas plans sold in 16 states and Washington, D.C., to about 5 million customers, about 2.6 million of them in Texas. Retail energy charges were $13,025 million of FY2025 revenue.
Wholesale power
Power sold into grid markets such as ERCOT (Texas) and PJM (the mid-Atlantic and Midwest): $3,188 million of FY2025 revenue, plus $1,146 million from other wholesale contracts.
Capacity
Payments from grid operators for having plants available. In PJM's auction for 2026/27, Vistra cleared about 10,314 MW at $329.17 per MW-day. Net capacity revenue was $227 million in FY2025.
Long-term power deals with large buyers
20-year agreements to sell nuclear power to Amazon Web Services (1,200 MW from Comanche Peak, deliveries from Q4 2027) and to Meta (2,609 MW from PJM nuclear plants, including 433 MW of planned uprates).
What it does
- Does: Runs gas, coal, nuclear, solar and battery plants in Texas, the eastern US and California.
- Does: Sells electricity and natural gas to homes and businesses under its own brands.
- Does: Buys and sells hedges to lock in prices for future power sales and fuel.
- Does: Sells nuclear and solar tax credits to other companies ($229 million of FY2025 revenue).
What it does not do
- Does not: Own the poles and wires that deliver power to homes: Vistra pays delivery fees to the utilities that do.
- Does not: Work as a regulated utility with set returns: it sells into competitive markets.
- Does not: Include Cogentrix in its Q3 FY2026 numbers: the purchase closed on Oct 30, 2026, after the quarter ended.
Sources (5)
- Form 10-K, fiscal year 2025 (ended Dec 31, 2025)
- Form 8-K filed Jul 23, 2025: PJM capacity auction results, planning year 2026/2027 (Item 8.01)
- Form 8-K filed Sep 29, 2025: 20-year Comanche Peak power purchase agreement (Item 8.01)
- Earnings release, Q4 and full year 2025 (Form 8-K, Exhibit 99.1)
- Form 8-K filed Jan 9, 2026: 20-year power purchase agreements with Meta (Item 7.01)
14How the money flows
14How the money flows · FY2025
How does money flow through Vistra?
Money in
- Operating revenues$17.7B
- Other income, net ($394M) and Tax Receivable Agreement effect ($2M)$396M
The company
Vistra
$18.1B came in
Money out
- Fuel, purchased power and delivery fees$9.1B
- Plant and mine operating costs$2.8B
- Depreciation and amortization$2.0B
- Selling, general and administrative expenses$1.7B
- Impairments (mainly Moss Landing)$228M
- Interest expense$1.2B
- Income tax$179M
- Dividends on preferred stock$192M
- Net income to common stock$752M
- Customers and power markets paid Vistra $17.7 billion in FY2025, and other income added $0.4 billion.
- Fuel, bought-in power and delivery fees took $9.1 billion, and running plants and mines $2.8 billion.
- Wear-and-tear of plants took $2.0 billion, overheads $1.7 billion and impairments $0.2 billion, leaving operating income of $1,906 million.
- Interest took $1.2 billion and income tax $0.2 billion, leaving net income of $944 million.
- After $192 million of dividends on preferred stock, $752 million was left for common stockholders.
15What it needs to run
15What it needs to run
What does Vistra need to run?
Power plants
43,641 MW at Dec 31, 2025: 26,989 MW gas, 8,743 MW coal, 6,448 MW nuclear, 1,274 MW solar and batteries and 187 MW fuel oil. Texas held 19,858 MW, the East 22,254 MW and the West 1,529 MW.
Fuel
Natural gas, coal and nuclear fuel. Fuel, purchased power and delivery fees were $9,101 million in FY2025, the largest cost.
Nuclear operating licenses
Federal licenses for Vistra's six nuclear units run to between 2036 (Beaver Valley 1) and 2053 (Comanche Peak 2).
Cash for collateral
Hedging requires posting cash as collateral (margin deposits). Changes in these deposits moved operating cash flow by minus $1,874 million in FY2022 and plus $1,899 million in FY2023.
People
About 6,390 full-time employees at Dec 31, 2025, about 1,860 of them under collective bargaining agreements.
16Where growth could come from
16Where growth could come from
Where could Vistra's growth come from?
Vistra said in its Q3 FY2026 earnings release (Nov 6, 2026) that it narrowed its 2026 Ongoing Operations Adjusted EBITDA guidance to $7.1 to $7.5 billion and set 2027 guidance of $7.7 to $8.5 billion, based on market prices as of Nov 2, 2026. Adjusted EBITDA is a company measure; FY2025 GAAP net income was $944 million.
Long-term power deals with large buyers
Early3,809 MW under 20-year deals
Amazon Web Services (1,200 MW from Comanche Peak, deliveries from Q4 2027, full by 2032) and Meta (2,609 MW from PJM nuclear plants). In Q3 FY2026 Vistra added a 20-year, 207 MW deal at Odessa, Texas.
Status: Early, too early to judge.
Cogentrix plants
NewAbout 5,500 MW, closed Oct 30, 2026
Ten gas plants: 3,163 MW in PJM, 1,750 MW in New England and 583 MW in ERCOT. Vistra paid about $2.2 billion in cash and 5,000,000 shares and took on about $1.7 billion of debt, which it repaid in October and November 2026.
Status: New, recently announced.
Lotus gas plants
NewAbout 2,600 MW, closed Oct 22, 2025
Seven gas plants bought for a base price of $1.9 billion, including about $800 million of debt assumed.
Status: New, recently announced.
PJM capacity prices
Working$329.17 per MW-day for 2026/27
Vistra cleared about 10,314 MW for 2026/27, about 10,566 MW at $333.44 for 2027/28 and about 10,924 MW at $325.00 for 2028/29.
Status: Working, on track against what the company said.
New solar and storage
New505 MW began operating in Q3 FY2026
Pulaski Solar (405 MW, with a power deal with Microsoft) and Deer Creek storage (100 MW) began operating in Q3 FY2026.
Status: New, recently announced.
Status compares progress with what the company itself said it would do: Working = on track against what the company said; Mixed = partly on track; Behind = behind the company's own plan; New = recently announced; Early = too early to judge.
Sources (10)
- Earnings release, Q3 2026 (Form 8-K, Exhibit 99.1)
- Form 10-K, fiscal year 2025 (ended Dec 31, 2025)
- Form 8-K filed Sep 29, 2025: 20-year Comanche Peak power purchase agreement (Item 8.01)
- Earnings release, Q4 and full year 2025 (Form 8-K, Exhibit 99.1)
- Form 8-K filed Jan 9, 2026: 20-year power purchase agreements with Meta (Item 7.01)
- Form 8-K filed Nov 5, 2026: completion of the Cogentrix Energy acquisition (Items 2.01, 2.03, 3.02; Exhibit 99.1)
- Form 8-K filed Oct 28, 2025: completion of the Lotus natural gas plants acquisition (Item 2.01)
- Form 8-K filed Jul 23, 2025: PJM capacity auction results, planning year 2026/2027 (Item 8.01)
- Form 8-K filed Dec 17, 2025: PJM capacity auction results, planning year 2027/2028 (Item 8.01)
- Form 8-K filed Jul 14, 2026: PJM capacity auction results, planning year 2028/2029 (Item 8.01)
17The company's own measures (non-GAAP)
17The company's own measures · FY2025 and Q3 FY2026, as each row says
What do Vistra's own measures show?
Official (GAAP): Net income, FY2025
$944M
Company's own measure: Adjusted EBITDA, FY2025
$5.8B
Vistra's measure starts from EBITDA and leaves out unrealized hedge gains and losses, transition and merger costs, non-cash pay, nuclear decommissioning trust income, asset retirement costs and other items. It was $4,101 million in FY2023 and $5,539 million in FY2024.
Official (GAAP): Net income, FY2025
$944M
Company's own measure: Ongoing Operations Adjusted EBITDA, FY2025
$5.9B
Same as Adjusted EBITDA but without the Asset Closure segment. This is the measure Vistra's guidance uses. It was $4,140 million in FY2023 and $5,643 million in FY2024 (recast).
Official (GAAP): Cash from operations, FY2025
$4.1B
Company's own measure: Ongoing Operations Adjusted free cash flow before growth, FY2025
$3.6B
Cash from operations without changes in collateral deposits and working capital, less maintenance capital spending and other items. It leaves out growth spending ($1,126 million in FY2025), so it is not the same as this page's free cash flow of $1,318 million.
Official (GAAP): Net income to common stock, Q3 FY2026
$1.1B
Company's own measure: Ongoing Operations Adjusted EBITDA, Q3 FY2026
$2.4B
Up from $1,581 million in Q3 FY2025; Vistra described the rise as more than 50%. GAAP net income for the quarter includes a $559 million unrealized hedge gain and a $269 million impairment of Moss Landing 350.
These are the company's own measures, defined by the company. They are not comparable across companies, and they are not added together. Each sits beside the nearest official (GAAP) figure.
Learn: Non-GAAP measures: what a company's "adjusted" numbers leave out
Sources (6)
- Form 10-K, fiscal year 2025 (ended Dec 31, 2025)
- Earnings release, Q3 2026 (Form 8-K, Exhibit 99.1)
- Form 10-K, fiscal year 2024 (ended Dec 31, 2024)
- Earnings release, Q4 and full year 2025 (Form 8-K, Exhibit 99.1)
- Earnings release, Q4 and full year 2024 (Form 8-K, Exhibit 99.1)
- Earnings release, Q3 2025 (Form 8-K, Exhibit 99.1)
18Financial strength and debt
18Financial strength · Jun 30, 2026
How much debt does Vistra have?
- Total debt$19.9B
- Cash and investments$435M
- Net debt (debt minus cash)$19.5B
- Net worth (shareholders' money)$5.5B
- Debt to equity
- 3.63×
- $ of debt for every $1 of shareholders' money
- Net debt of $19,460 million = total debt of $19,895 million (accounts receivable financing $300 million, long-term debt due currently $1,876 million and long-term debt $17,719 million) minus cash of $435 million (Cityfort calculation from the Q2 FY2026 10-Q).
- Total debt on the same basis was $10,731 million at Dec 31, 2021 and $20,068 million at Dec 31, 2025 (Cityfort calculation from the FY2022 and FY2025 10-Ks). It leaves out the forward repurchase obligation for the Vistra Vision buyout ($632 million at Dec 31, 2025), margin deposit financing with an affiliate ($444 million), leases and the Tax Receivable Agreement obligation.
- Stockholders' equity of $5,482 million on Jun 30, 2026 includes $2,476 million of preferred stock and is reduced by $7,627 million of repurchased (treasury) shares. Debt to equity of 3.63 uses total stockholders' equity (Cityfort calculation from the Q2 FY2026 10-Q).
- After Jun 30, 2026: Vistra issued $1.5 billion of junior subordinated notes in September 2026. In October and November 2026 it redeemed its $1,000 million Series A preferred stock, paid about $2.2 billion in cash for Cogentrix (closed Oct 30, 2026), fully drew its accounts receivable financing facilities and repaid about $1.7 billion of debt assumed in the Cogentrix purchase.
- Cash was $2,743 million on Sep 30, 2026. Vistra stated liquidity of about $8,923 million then, and about $5.4 billion pro forma after the preferred redemption and Cogentrix. The Q3 FY2026 10-Q, with the full Sep 30 balance sheet, was not yet filed on Nov 7, 2026.
Sources (6)
- Form 10-Q, Q2 2026 (quarter ended Jun 30, 2026)
- Form 10-K, fiscal year 2025 (ended Dec 31, 2025)
- Form 10-K, fiscal year 2022 (ended Dec 31, 2022)
- Form 8-K filed Sep 24, 2026: $1.5 billion junior subordinated notes due 2057 (Items 1.01, 8.01)
- Form 8-K filed Nov 5, 2026: completion of the Cogentrix Energy acquisition (Items 2.01, 2.03, 3.02; Exhibit 99.1)
- Earnings release, Q3 2026 (Form 8-K, Exhibit 99.1)
19Who owns it
19Who owns it · ownership as of Mar 3, 2026
Who owns Vistra?
- Officers and directors (as a group), shares
- 0.9%
Share classes
Holders of 5% or more
From the company's proxy statement (DEF 14A), later Schedule 13G filings and the share counts on its latest annual or quarterly report. Each holder row shows the date of its own filing.
Insider trades · Form 4 data as of Nov 6, 2026
What did Vistra's insiders report trading?
Vistra's insiders made 44 Form 4A filing an insider must make within two business days of buying or selling the company's shares. Learn more filings in the 12 months to Nov 6, 2026.
They reported 3 purchases (8,665 shares) and 20 sales (339,934 shares) in the open market or privately (codes P and S).
15 of the 20 sales were on forms with the Rule 10b5-1 plan box checked.
The same filings report 52 other share transactions (A: 22, F: 21, M: 6, G: 3).
They also report 6 transactions in options, stock units or other derivatives.
Insiders are a company's officers, directors and owners of more than 10% of a class of its shares. Most changes in their holdings must be reported to the SEC on a Form 4 within two business days. Source: SEC Form 4 filings on EDGAR.
- P
- a purchase in the open market or privately
- S
- a sale in the open market or privately
- A
- a grant, award or other acquisition from the company under Rule 16b-3
- F
- shares withheld or handed over to pay an exercise price or tax when an award is received, exercised or vests
- M
- exercise or conversion of an option or other derivative, exempt under Rule 16b-3
- G
- a bona fide gift
Code meanings: General Instruction 8 of Form 4 (SEC).
The latest 25 of 75 transactions
Shares: A = acquired, D = disposed of. A price the filing gives only in a footnote shows as “See filing”. The 10b5-1 box is checked when at least one trade on the form was made under a Rule 10b5-1 plan. A Form 4/A replaces the form it amends. See all of Vistra's Form 4 filings on EDGAR.
Learn: How to read a proxy statement (DEF 14A): Nvidia's 2026 proxy · Form 4 insider filings: who files, the codes and the footnotes · Rule 10b5-1 trading plans: how insiders pre-schedule their trades
Sources (8)
- Earnings release, Q3 2026 (Form 8-K, Exhibit 99.1)
- Form 8-K filed Nov 5, 2026: completion of the Cogentrix Energy acquisition (Items 2.01, 2.03, 3.02; Exhibit 99.1)
- Form 10-Q, Q2 2026 (quarter ended Jun 30, 2026)
- 2026 proxy statement (DEF 14A)
- Schedule 13G by Vanguard Capital Management, filed Apr 28, 2026
- Schedule 13G/A by The Vanguard Group, filed Mar 26, 2026
- Schedule 13G by Vanguard Portfolio Management, filed Apr 28, 2026
- Schedule 13G by State Street Corporation, filed Aug 7, 2026
20What it does with profit
20What it does with profit
What does Vistra do with its profit?
Dividend per share
$0.90FY2025
Dividend paid for each share, by financial year.
$ per share
See the numbers
Buyback · Dec 31, 2021
Shares repurchased in FY2021.
$471M
Buyback · Dec 31, 2022
Shares repurchased in FY2022.
$1.9B
Buyback · Dec 31, 2023
Shares repurchased in FY2023.
$1.2B
Buyback · Dec 31, 2024
Shares repurchased in FY2024.
$1.3B
Buyback · Dec 31, 2025
Shares repurchased in FY2025.
$1.0B
Buyback · Sep 30, 2026
Shares repurchased in the first nine months of FY2026.
$917M
Money raised · Sep 24, 2026
Junior subordinated notes due 2057 (7.000% Series A $850 million, 7.250% Series B $650 million).
$1.5B
Money raised · Oct 30, 2026
5,000,000 common shares issued to the seller as part of the Cogentrix purchase.
Sources (5)
- Form 10-K, fiscal year 2023 (ended Dec 31, 2023)
- Form 10-K, fiscal year 2025 (ended Dec 31, 2025)
- Earnings release, Q3 2026 (Form 8-K, Exhibit 99.1)
- Form 8-K filed Sep 24, 2026: $1.5 billion junior subordinated notes due 2057 (Items 1.01, 8.01)
- Form 8-K filed Nov 5, 2026: completion of the Cogentrix Energy acquisition (Items 2.01, 2.03, 3.02; Exhibit 99.1)
21Governance signals
21Governance signals
What do Vistra's governance filings show?
- Auditor
- Deloitte & Touche LLP, since 2002
- Auditor changes
- None in the period covered
- Audit qualifications
- None reported
- Related-party dealings
- The 2026 proxy statement says there have been no related person transactions since Jan 1, 2025.
- Credit rating
- S&P Global Ratings and Fitch Ratings, on the subsidiary Vistra Operations Company LLC (as stated in the Q2 FY2026 10-Q) BBB- (S&P, raised from BB+ on Dec 2, 2025) / BBB- (Fitch, raised from BB+ on Mar 16, 2026) (Stable at both), Mar 16, 2026
A credit rating describes the company's ability to repay debt. It is not a rating of the share.
Flags to know about
disclosure · Nov 6, 2026
Hedges move reported results
Unrealized gains and losses on hedges run through revenue. FY2025 results include an $808 million unrealized pre-tax loss on hedges for future years, and Q3 FY2026 net income includes a $559 million unrealized hedge gain.
regulatory · Jan 16, 2025
Moss Landing battery fire
A fire hit the 300 MW Moss Landing battery facility in California on Jan 16, 2025. In July 2025, Vistra entered into an Administrative Settlement Agreement and Order on Consent with the EPA for the Moss Landing 300 site, and it estimates the required battery removal and remediation work at about $110 million. Lawsuits have been filed in California courts against Vistra, LG Energy Solution and others.
other · Oct 30, 2026
Shares issued for Cogentrix
Vistra issued 5,000,000 shares to the Cogentrix seller, Q-Generation Holdings, which agreed not to transfer them through Jan 30, 2027, subject to certain exceptions.
disclosure
What this page does not cover
No earnings call transcripts or investor slides were used. Q3 FY2026 figures come from the earnings release, because the Q3 FY2026 10-Q was not yet filed; Q3 EPS and the Sep 30, 2026 balance sheet are not shown.
Sources (6)
- Form 10-K, fiscal year 2025 (ended Dec 31, 2025)
- 2026 proxy statement (DEF 14A)
- Form 10-Q, Q2 2026 (quarter ended Jun 30, 2026)
- Earnings release, Q4 and full year 2025 (Form 8-K, Exhibit 99.1)
- Earnings release, Q3 2026 (Form 8-K, Exhibit 99.1)
- Form 8-K filed Nov 5, 2026: completion of the Cogentrix Energy acquisition (Items 2.01, 2.03, 3.02; Exhibit 99.1)
22What the market paid
22What the market paid · price as of Nov 5, 2026
What did the market pay for Vistra on Nov 5, 2026?
Price as of Nov 5, 2026 (shown for education; prices change daily).
Price as of Nov 5, 2026: a $112.89 close, from Nasdaq's historical price table for VST; Vistra's shares are listed on the NYSE. The same table shows a $139.59 close on Nov 3, 2026. Market value = $112.89 × about 339 million shares (as of Nov 2, 2026) = about $38,270 million (Cityfort calculation from the Nov 5, 2026 closing price and the Q3 FY2026 earnings release). P/E is price ÷ earnings per share: 51.8 on FY2025 diluted EPS of $2.18, which includes an $808 million unrealized pre-tax hedge loss (Cityfort calculation from the FY2025 10-K). A four-quarter P/E is not shown: Vistra reports no Q4 EPS, and Q3 FY2026 EPS awaits the 10-Q.
- Share price
- $112.89
- Market value (market cap)
- $38.3B
- P/E
- 51.8×
More price-based ratios · as of Nov 5, 2026
Each ratio divides a number from the company's filings by the market value or share price on Nov 5, 2026. Prices change daily, so these ratios do too.
Price to sales (P/S)
1.9×
$38.3B market value ÷ $20.6B revenue (four quarters to Sep 30, 2026) = 1.9×
Cityfort calculation from the Nov 5, 2026 closing price and the Q4 FY2025 to Q3 FY2026 10-Ks and 10-Qs and earnings releases. Source: VST historical prices, Oct 20 to Nov 5, 2026; Earnings release, Q3 2026 (Form 8-K, Exhibit 99.1); Form 10-K, fiscal year 2025 (ended Dec 31, 2025) and 5 more
How price ratios workDividend yield
0.80%
$0.90 dividends per share (FY2025) ÷ $112.89 share price = 0.80%
Cityfort calculation from the FY2025 10-K and the Nov 5, 2026 closing price. Source: VST historical prices, Oct 20 to Nov 5, 2026; Earnings release, Q3 2026 (Form 8-K, Exhibit 99.1); Form 10-K, fiscal year 2025 (ended Dec 31, 2025) and 1 more
What dividend yield meansFree cash flow yield
3.4%
$1.3B free cash flow (FY2025) ÷ $38.3B market value = 3.4%
Cityfort calculation from the FY2025 10-K and the Nov 5, 2026 closing price. Source: VST historical prices, Oct 20 to Nov 5, 2026; Earnings release, Q3 2026 (Form 8-K, Exhibit 99.1); Form 10-K, fiscal year 2025 (ended Dec 31, 2025) and 1 more
What free cash flow means
Shares used for the market value: 339 million ($112.89 × 339 million shares ≈ $38.3B). Source: Earnings release, Q3 2026 (Form 8-K, Exhibit 99.1); Form 8-K filed Nov 5, 2026: completion of the Cogentrix Energy acquisition (Items 2.01, 2.03, 3.02; Exhibit 99.1); Form 10-Q, Q2 2026 (quarter ended Jun 30, 2026)
Source: VST historical prices, Oct 20 to Nov 5, 2026; Earnings release, Q3 2026 (Form 8-K, Exhibit 99.1); Form 10-K, fiscal year 2025 (ended Dec 31, 2025) and 1 more
Sources (9)
- VST historical prices, Oct 20 to Nov 5, 2026
- Earnings release, Q3 2026 (Form 8-K, Exhibit 99.1)
- Form 10-K, fiscal year 2025 (ended Dec 31, 2025)
- Earnings release, Q4 and full year 2025 (Form 8-K, Exhibit 99.1)
- Earnings release, Q1 2026 (Form 8-K, Exhibit 99.1)
- Form 10-Q, Q1 2026 (quarter ended Mar 31, 2026)
- Earnings release, Q2 2026 (Form 8-K, Exhibit 99.1)
- Form 10-Q, Q2 2026 (quarter ended Jun 30, 2026)
- Form 8-K filed Nov 5, 2026: completion of the Cogentrix Energy acquisition (Items 2.01, 2.03, 3.02; Exhibit 99.1)
23How it got here
23How it got here
How did Vistra get here?
2021
Crisis
Winter Storm Uri
The February 2021 storm hit Vistra's Texas business; Vistra lost $1,295 million for common stockholders in FY2021.
2022
Crisis
Hedge losses
Unrealized commodity losses of $2,510 million left a $1,377 million loss to common stockholders in FY2022.
2024
Business-model change
Energy Harbor nuclear plants
Vistra completed the Energy Harbor purchase in March 2024, adding about 4,000 MW of nuclear, and bought out the Vistra Vision minority owners at Dec 31, 2024.
2024
Crisis
Martin Lake fire
A fire on Nov 27, 2024 took the 815 MW Martin Lake Unit 1 offline until February 2026.
2025
Crisis
Moss Landing battery fire
A fire on Jan 16, 2025 hit the 300 MW battery facility in California; an EPA consent order and lawsuits followed.
2025
Milestone
Comanche Peak 20-year deal
On Sep 29, 2025, Vistra announced a 20-year deal to sell 1,200 MW from Comanche Peak, later named as Amazon Web Services.
2025
Milestone
Lotus plants and investment-grade rating
Vistra closed the purchase of seven gas plants (about 2,600 MW) on Oct 22, 2025, and S&P raised its rating to BBB- on Dec 2, 2025.
2026
Milestone
Meta nuclear deals
In January 2026, Vistra announced 20-year deals with Meta for 2,609 MW from its PJM nuclear plants.
2026
Business-model change
Cogentrix purchase closes
On Oct 30, 2026, Vistra added about 5,500 MW of gas plants, taking its fleet to nearly 50,000 MW by its count.
Sources (10)
- Form 10-K, fiscal year 2023 (ended Dec 31, 2023)
- Form 10-K, fiscal year 2022 (ended Dec 31, 2022)
- Form 8-K filed Nov 5, 2026: completion of the Cogentrix Energy acquisition (Items 2.01, 2.03, 3.02; Exhibit 99.1)
- Form 10-K, fiscal year 2025 (ended Dec 31, 2025)
- Earnings release, Q4 and full year 2024 (Form 8-K, Exhibit 99.1)
- Form 8-K filed Sep 29, 2025: 20-year Comanche Peak power purchase agreement (Item 8.01)
- Earnings release, Q4 and full year 2025 (Form 8-K, Exhibit 99.1)
- Form 8-K filed Oct 28, 2025: completion of the Lotus natural gas plants acquisition (Item 2.01)
- Form 10-Q, Q2 2026 (quarter ended Jun 30, 2026)
- Form 8-K filed Jan 9, 2026: 20-year power purchase agreements with Meta (Item 7.01)
24Sources and changes
Where every number on this page comes from
Sources (35 documents)
- S1Form 10-K, fiscal year 2025 (ended Dec 31, 2025) · Vistra Corp. (SEC EDGAR) · Tier 1: company or exchange filing · Feb 27, 2026
- S2Form 10-K, fiscal year 2024 (ended Dec 31, 2024) · Vistra Corp. (SEC EDGAR) · Tier 1: company or exchange filing · Feb 28, 2025
- S3Form 10-K, fiscal year 2023 (ended Dec 31, 2023) · Vistra Corp. (SEC EDGAR) · Tier 1: company or exchange filing · Feb 29, 2024
- S4Form 10-K, fiscal year 2022 (ended Dec 31, 2022) · Vistra Corp. (SEC EDGAR) · Tier 1: company or exchange filing · Mar 1, 2023
- S5Form 10-Q, Q2 2026 (quarter ended Jun 30, 2026) · Vistra Corp. (SEC EDGAR) · Tier 1: company or exchange filing · Aug 10, 2026
- S6Form 10-Q, Q1 2026 (quarter ended Mar 31, 2026) · Vistra Corp. (SEC EDGAR) · Tier 1: company or exchange filing · May 8, 2026
- S7Form 10-Q, Q3 2025 (quarter ended Sep 30, 2025) · Vistra Corp. (SEC EDGAR) · Tier 1: company or exchange filing · Nov 7, 2025
- S8Form 10-Q, Q2 2025 (quarter ended Jun 30, 2025) · Vistra Corp. (SEC EDGAR) · Tier 1: company or exchange filing · Aug 8, 2025
- S9Form 10-Q, Q1 2025 (quarter ended Mar 31, 2025) · Vistra Corp. (SEC EDGAR) · Tier 1: company or exchange filing · May 8, 2025
- S10Form 10-Q, Q3 2024 (quarter ended Sep 30, 2024) · Vistra Corp. (SEC EDGAR) · Tier 1: company or exchange filing · Nov 8, 2024
- S11Earnings release, Q3 2026 (Form 8-K, Exhibit 99.1) · Vistra Corp. (SEC EDGAR) · Tier 1: company or exchange filing · Nov 6, 2026
- S12Earnings release, Q2 2026 (Form 8-K, Exhibit 99.1) · Vistra Corp. (SEC EDGAR) · Tier 1: company or exchange filing · Aug 7, 2026
- S13Earnings release, Q1 2026 (Form 8-K, Exhibit 99.1) · Vistra Corp. (SEC EDGAR) · Tier 1: company or exchange filing · May 7, 2026
- S14Earnings release, Q4 and full year 2025 (Form 8-K, Exhibit 99.1) · Vistra Corp. (SEC EDGAR) · Tier 1: company or exchange filing · Feb 26, 2026
- S15Earnings release, Q3 2025 (Form 8-K, Exhibit 99.1) · Vistra Corp. (SEC EDGAR) · Tier 1: company or exchange filing · Nov 6, 2025
- S16Earnings release, Q2 2025 (Form 8-K, Exhibit 99.1) · Vistra Corp. (SEC EDGAR) · Tier 1: company or exchange filing · Aug 7, 2025
- S17Earnings release, Q1 2025 (Form 8-K, Exhibit 99.1) · Vistra Corp. (SEC EDGAR) · Tier 1: company or exchange filing · May 7, 2025
- S18Earnings release, Q4 and full year 2024 (Form 8-K, Exhibit 99.1) · Vistra Corp. (SEC EDGAR) · Tier 1: company or exchange filing · Feb 27, 2025
- S19Earnings release, Q3 2024 (Form 8-K, Exhibit 99.1) · Vistra Corp. (SEC EDGAR) · Tier 1: company or exchange filing · Nov 7, 2024
- S202026 proxy statement (DEF 14A) · Vistra Corp. (SEC EDGAR) · Tier 1: company or exchange filing · Mar 18, 2026
- S21Form 8-K filed Nov 5, 2026: completion of the Cogentrix Energy acquisition (Items 2.01, 2.03, 3.02; Exhibit 99.1) · Vistra Corp. (SEC EDGAR) · Tier 1: company or exchange filing · Nov 5, 2026
- S22Form 8-K filed Jan 5, 2026: agreements to acquire Cogentrix Energy (Exhibit 99.1 press release) · Vistra Corp. (SEC EDGAR) · Tier 1: company or exchange filing · Jan 5, 2026
- S23Form 8-K filed Oct 28, 2025: completion of the Lotus natural gas plants acquisition (Item 2.01) · Vistra Corp. (SEC EDGAR) · Tier 1: company or exchange filing · Oct 28, 2025
- S24Form 8-K filed Jan 9, 2026: 20-year power purchase agreements with Meta (Item 7.01) · Vistra Corp. (SEC EDGAR) · Tier 1: company or exchange filing · Jan 9, 2026
- S25Form 8-K filed Sep 29, 2025: 20-year Comanche Peak power purchase agreement (Item 8.01) · Vistra Corp. (SEC EDGAR) · Tier 1: company or exchange filing · Sep 29, 2025
- S26Form 8-K filed Jul 14, 2026: PJM capacity auction results, planning year 2028/2029 (Item 8.01) · Vistra Corp. (SEC EDGAR) · Tier 1: company or exchange filing · Jul 14, 2026
- S27Form 8-K filed Dec 17, 2025: PJM capacity auction results, planning year 2027/2028 (Item 8.01) · Vistra Corp. (SEC EDGAR) · Tier 1: company or exchange filing · Dec 17, 2025
- S28Form 8-K filed Sep 24, 2026: $1.5 billion junior subordinated notes due 2057 (Items 1.01, 8.01) · Vistra Corp. (SEC EDGAR) · Tier 1: company or exchange filing · Sep 24, 2026
- S29Schedule 13G/A by FMR LLC, filed Nov 5, 2026 · FMR LLC (SEC EDGAR) · Tier 1: company or exchange filing · Nov 5, 2026
- S30Schedule 13G by State Street Corporation, filed Aug 7, 2026 · State Street Corporation (SEC EDGAR) · Tier 1: company or exchange filing · Aug 7, 2026
- S31Schedule 13G by Vanguard Capital Management, filed Apr 28, 2026 · Vanguard Capital Management (SEC EDGAR) · Tier 1: company or exchange filing · Apr 28, 2026
- S32Schedule 13G by Vanguard Portfolio Management, filed Apr 28, 2026 · Vanguard Portfolio Management (SEC EDGAR) · Tier 1: company or exchange filing · Apr 28, 2026
- S33Schedule 13G/A by The Vanguard Group, filed Mar 26, 2026 · The Vanguard Group (SEC EDGAR) · Tier 1: company or exchange filing · Mar 26, 2026
- S34VST historical prices, Oct 20 to Nov 5, 2026 · Nasdaq · Tier 1: company or exchange filing · Nov 5, 2026
- S35Form 8-K filed Jul 23, 2025: PJM capacity auction results, planning year 2026/2027 (Item 8.01) · Vistra Corp. (SEC EDGAR) · Tier 1: company or exchange filing · Jul 23, 2025
Changes to this page (v1 · Nov 6, 2026)
- v1 · Nov 6, 2026First version, through Q3 FY2026 (quarter ended Sep 30, 2026), with Q3 figures from the earnings release. (first version)
Numbers come only from tier 1 and tier 2 sources. Read how we research.
Disclaimer
For learning only. Cityfort is not a registered investment adviser or broker-dealer and does not recommend buying or selling any security. Prices shown are dated and may be out of date.
Investing in securities involves risk, including loss of capital. Before making any investment decision, do your own research and consider consulting a registered investment adviser or other qualified professional.
Cityfort, its owners and contributors may or may not hold securities of companies covered. Cityfort is not paid by any company it covers. Content is not an offer or solicitation to buy or sell any security, including in any initial public offering.
Read the positions policyRead the full disclaimerHide the full disclaimer
Cityfort publishes general educational content that explains how listed companies work. Cityfort is not registered with the US Securities and Exchange Commission or any state securities regulator as an investment adviser, and is not a broker-dealer or a member of FINRA. Cityfort does not provide investment, tax or legal advice, recommendations, ratings, price targets or any opinion on whether to buy, sell or hold any security. Nothing on the site is tailored to any person's circumstances.
All information is taken from publicly available sources, mainly company filings with the SEC, which are listed on each page with dates. We work to keep it accurate and correct errors publicly, but we do not guarantee that it is complete, accurate or up to date. Any market price or price-based ratio shown is dated, may be out of date by the time you read it, and is included only to explain concepts.
Statements by company management, including forward-looking statements and guidance, are reported as the company's statements, with their date and source; they are not our forecasts. Adjusted (non-GAAP) figures are the company's own measures and are shown next to the official (GAAP) figures.