Utilities · NYSE: DUK
Duke Energy: how the business works
Duke Energy owns regulated utilities that supply electricity to about 8.7 million retail customers in six states, from the Carolinas and Florida to Indiana, Ohio and Kentucky, and also sell natural gas, with FY2025 revenue of $32.2 billion.
By Hardik Bhandare · Checked against filings: . Editorial policy. Corrections
Follow Duke Energy
Email me when Duke Energy's page is updated after earnings.
We'll send a confirmation email first. See our privacy policy.
Duke Energy Corporation · Charlotte, North Carolina
Updated for Q3 FY2026 · checked
- Revenue, FY2025
- $32.2B
- Net income available to common stockholders, FY2025
- $4.9B
- Retail electric customers, Dec 31, 2025 (about)
- 8.7 million
- Employees, Dec 31, 2025
- 26,441
- Total debt, Sep 30, 2026
- $92.8B
The short version
Duke Energy in 5 points
1 · What it sells
Duke Energy sells electricity to about 8.7 million retail customers in six states through regulated utilities, from about 55,713 MW of plants it owns, and had about 1.8 million natural gas customers at Dec 31, 2025.
2 · Who pays it
In FY2025, residential customers paid 47.6% of Duke Energy's revenue, commercial customers 28.4%, industrial customers 11.2%, wholesale electricity buyers 7.5% and other sources 5.4%, and no single large customer is disclosed.
3 · What it keeps from $100
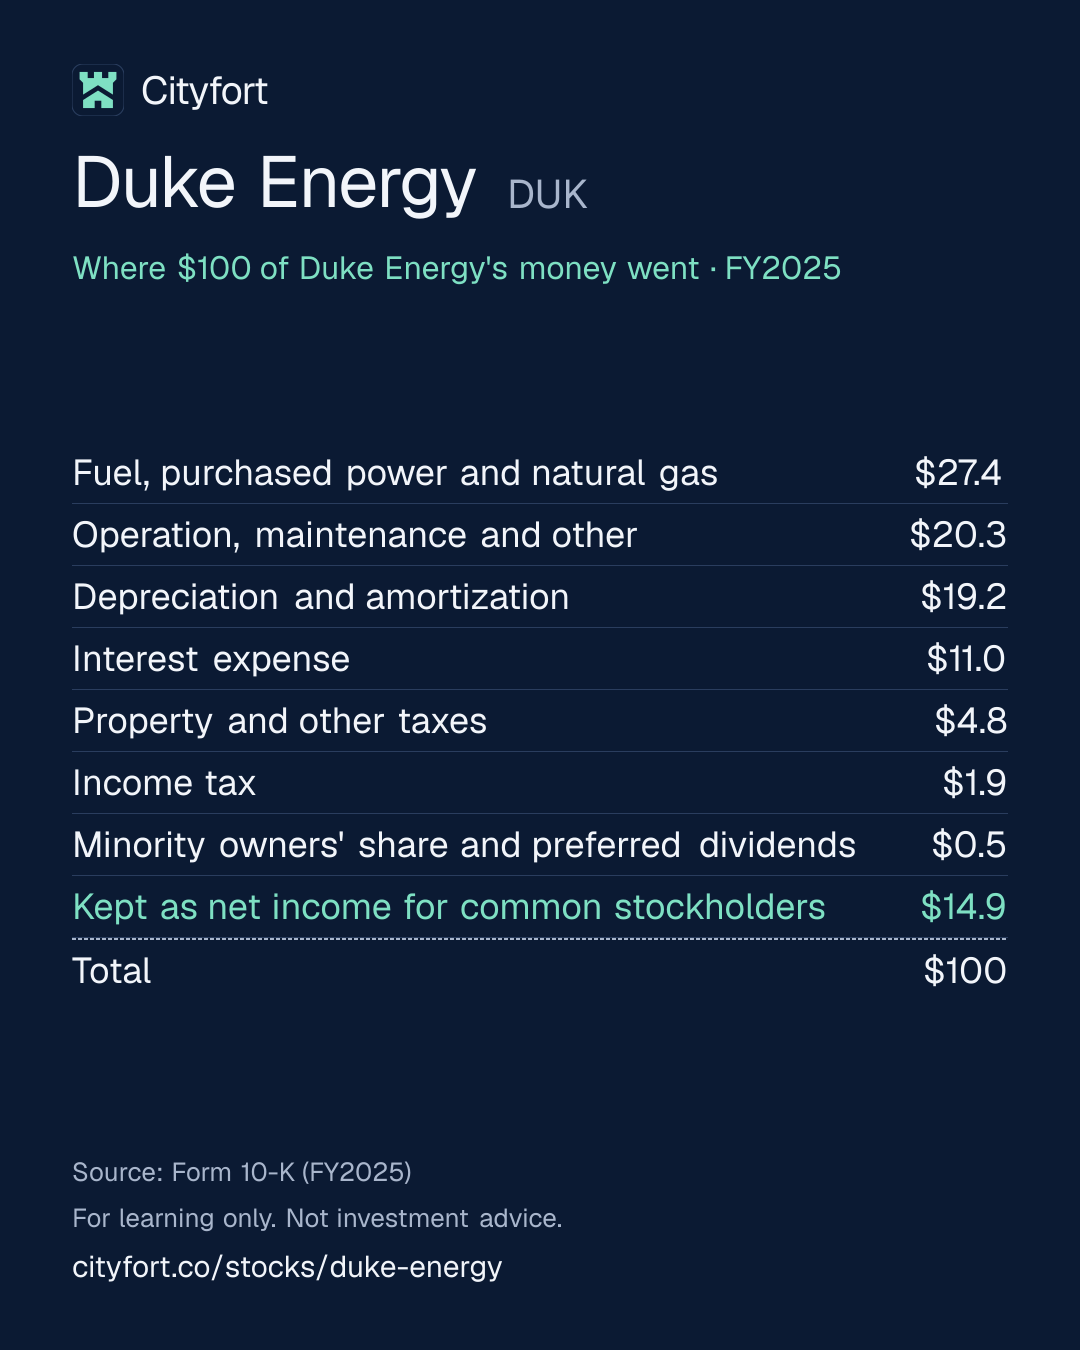
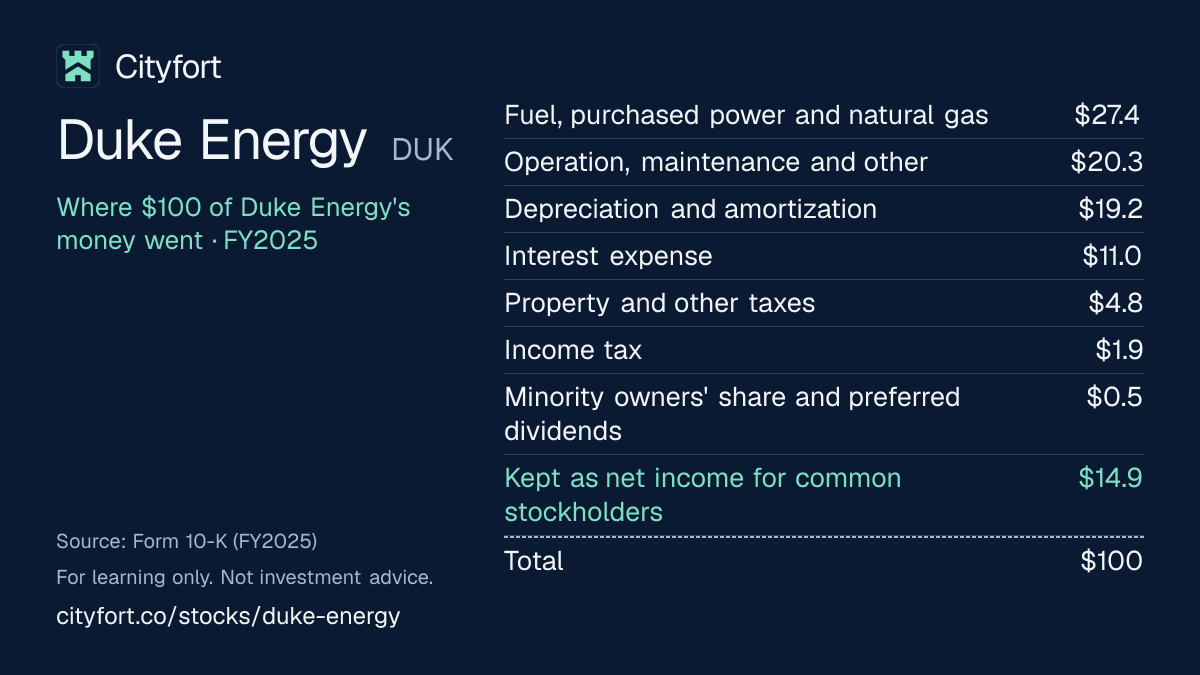
Of every $100 that came in during FY2025, Duke Energy kept $14.88 as net income for common stockholders after $11.01 of interest, while operating income was $26.14, and Duke Energy reported no special items for FY2025, so adjusted EPS equaled GAAP EPS of $6.31.
4 · Where the operating profit comes from
Electric Utilities and Infrastructure earned $5,337 million of FY2025 segment income and Gas Utilities and Infrastructure $559 million, while Other, mostly holding-company interest, lost $985 million.
5 · The one thing to watch
Capital spending reached $12,566 million in the first nine months of FY2026, up from $9,881 million a year earlier, while total debt rose from $89,836 million at Dec 31, 2025 to $92,789 million on Sep 30, 2026.
Sources: From Duke Energy's FY2025 10-K and Q3 FY2026 10-Q · checked
See the full receipt and the management scorecard below
01Where the money goes · FY2025
Where does $100 of Duke Energy's money go?
Duke Energy · FY2025
Receipt for every $100
| Fuel, purchased power and natural gas | $27.4 |
|---|---|
| Operation, maintenance and other | $20.3 |
| Depreciation and amortization | $19.2 |
| Interest expense | $11.0 |
| Property and other taxes | $4.8 |
| Income tax | $1.9 |
| Minority owners' share and preferred dividends | $0.5 |
| Kept as net income for common stockholders | $14.9 |
| Total | $100 |
Each line = amount ÷ total money in × 100. Lines may not add to exactly $100 because of rounding.
How this is worked out
Cityfort calculation from the FY2025 10-K. Of every $100 that came in during FY2025 (revenue $32,237 million + other income, gains on asset sales and earnings of part-owned companies $765 million = $33,002 million), each line = line ÷ $33,002 million × 100. Operation, maintenance and other includes a $4 million impairment credit. The minority owners' line is $103 million for noncontrolling interests and $56 million of preferred dividends, less $1 million of income from discontinued operations. Operating income was $26.14 of each $100.
Save this receipt as an image:
1080 × 1350 PNG for Instagram, LinkedIn1200 × 675 PNG for X
Embed this receipt
Paste this code into a blog or website to show the receipt, with a link back to this page:
Each week: one company explained in 5 points, picked by earnings date.
Free, no tips, unsubscribe anytime.
We'll send a confirmation email. See our privacy policy.
02The business in one line
What does Duke Energy do?
Homes and businesses in six states pay Duke Energy's utilities rates set by state regulators for electricity and gas; most of the money goes on fuel, upkeep, wear-and-tear of plants and interest, and $14.88 of every $100 that came in during FY2025 was left as net income for common stockholders.
- Residential customers paid 47.6% of FY2025 revenue and commercial customers 28.4%, at rates set by state commissions.
- Capital spending of $14,024 million in FY2025 was higher than operating cash flow of $12,330 million, so Duke Energy borrows to build.
03Who pays it
Who pays Duke Energy?
Residential customers
48%
of revenue
47.6% of FY2025 revenue: $13,756 million for electricity and $1,596 million for gas.
Commercial customers
28%
of revenue
28.4% of FY2025 revenue: $8,337 million for electricity and $808 million for gas.
Industrial customers
11%
of revenue
11.2% of FY2025 revenue: $3,423 million for electricity and $190 million for gas.
Wholesale electricity buyers
8%
of revenue
7.5% of FY2025 revenue, or $2,402 million, from other utilities and power buyers.
Other
5%
of revenue
5.4% of FY2025 revenue, or $1,725 million: other electricity ($945 million) and gas ($256 million) sales, other contracts ($28 million) and $496 million from alternative revenue programs and other sources outside customer contracts.
- Residential customers48%
- Commercial customers28%
- Industrial customers11%
- Wholesale electricity buyers8%
- Other5%
How spread out the customers are
The FY2025 10-K says no Duke Energy utility had a customer that paid more than 10% of its revenue in FY2025. Shares are a Cityfort calculation from the FY2025 10-K's revenue by customer class, which add to 100 with rounding.
04Why it makes money
Why does Duke Energy make money?
State regulators let Duke Energy's utilities charge rates that cover their costs and earn a return on what they invest, so profit grows as the base of plants, lines and pipes grows.
The FY2025 10-K says rates are designed to include the costs of service and "a reasonable return on invested capital." Electric Utilities and Infrastructure's assets grew from $143,841 million in FY2021 to $172,427 million in FY2025, and its segment income from $3,850 million to $5,337 million.
Electric Utilities and Infrastructure segment income, US$ million
$3,850$5,337
FY2021 to FY2025
- Duke Energy spends on new plants, lines and pipes
- It asks state commissions to add that spending to the base its rates are set on
- Approved rates cover costs plus a return on that base
- Customers pay the rates, and profit rises with the base
- Profit, new borrowing and outside investors fund the next round of building and the dividend
↺ Step 5 feeds back into step 1.
05Business segments · FY2025
Which businesses make up Duke Energy?
Electric Utilities and Infrastructure
90%The regulated electric utilities. The profit figure is segment income, which Duke Energy measures after interest, tax and minority owners. In Q3 FY2026 the segment had revenue of $8,747 million and segment income of $1,817 million. Shares are of segment revenue before $288 million of eliminations (Cityfort calculation from the FY2025 10-K).
Revenue $29.4B · Operating profit $5.3B
Gas Utilities and Infrastructure
9%Gas distribution, storage, pipeline and renewable natural gas investments. It earns most in winter: segment income was $532 million in Q1 FY2026, including the gain on the Tennessee sale, and a $19 million loss in Q3 FY2026.
Revenue $3.0B · Operating profit $559M
Other
1%The holding company, unallocated corporate costs and a captive insurer. Its FY2025 loss of $985 million is mostly holding-company interest ($1,317 million of interest expense).
Revenue $165M · Operating profit −$985M
How the mix changed
- Electric Utilities and Infrastructure
- Gas Utilities and Infrastructure
- Other
Revenue by segment, FY2021 to FY2025.
US$
See the numbers
06The numbers · Consolidated · US$
How has Duke Energy done?
Revenue
$32.2BFY2025
Revenue rose every year, from $24.6 billion in FY2021 to $32.2 billion in FY2025, and Q1 and Q3 are the larger quarters because of winter heating and summer cooling.
US$
See the numbers
Net profit
$4.9BFY2025
Net income to common stockholders fell to $2,444 million in FY2022 and $2,735 million in FY2023 because of losses on the Commercial Renewables sale, shown as discontinued operations, while EPS from continuing operations rose every year from $4.68 in FY2021 to $6.31 in FY2025.
US$
See the numbers
Profit kept per $100 of revenue
$15.2FY2025
Net income to common stockholders was $15.2 per $100 of revenue in FY2025 and operating income $26.8, against $15.4 and $22.3 in FY2021.
$ of profit per $100 of revenue (net margin)
See the numbers
Free cash flow
−$1.7BFY2025
Free cash flow was negative in four of the five years from FY2021 to FY2025, minus $1,694 million in FY2025, because capital spending exceeded operating cash flow, and it was minus $4,677 million in the first nine months of FY2026.
US$ · cash from operations minus spending on plants and equipment
See the numbers
See all yearly numbers
EBITDA here = operating income plus depreciation and amortization (from the cash flow statement). Fiscal years are the company's own (Fiscal year ends Dec 31). Net profit is the share belonging to the company's owners. Total net income differs from net profit to the company's owners: Net income to common stockholders deducts $103 million for noncontrolling interests (mainly GIC's stake in the Indiana business) and $56 million of preferred dividends.
Download Duke Energy's yearly and quarterly numbers (CSV, with source ids)
Learn: Fiscal years that don't end in December: Nvidia's FY2027 explained
Sources (11)
- Form 10-K, fiscal year 2023 (ended Dec 31, 2023)
- Form 10-K, fiscal year 2025 (ended Dec 31, 2025)
- Q4 and full-year FY2024 earnings release (8-K Item 2.02, Ex. 99.1)
- Q1 FY2025 earnings release (8-K Item 2.02, Ex. 99.1)
- Q2 FY2025 earnings release (8-K Item 2.02, Ex. 99.1)
- Q3 FY2025 earnings release (8-K Item 2.02, Ex. 99.1)
- Q4 and full-year FY2025 earnings release (8-K Item 2.02, Ex. 99.1)
- Q1 FY2026 earnings release (8-K Item 2.02, Ex. 99.1)
- Q2 FY2026 earnings release (8-K Item 2.02, Ex. 99.1)
- Q3 FY2026 earnings release (8-K Item 2.02, Ex. 99.1)
- Form 10-Q, Q3 FY2026 (quarter ended Sep 30, 2026)
07Who runs it
Who runs Duke Energy, and did they deliver?
Harry K. Sideris
President and Chief Executive Officer · since 2025
CEO since April 2025 and president since April 2024. His 2025 total pay in the Summary Compensation Table was $13,652,630.
Brian D. Savoy
Chief Financial Officer
His 2025 total pay in the Summary Compensation Table was $4,787,223.
Lynn J. Good
Former Chair and Chief Executive Officer
Retired as Chair and CEO on Apr 1, 2025. Her 2025 total pay in the Summary Compensation Table was $8,269,436.
What they said, and what happened
3 delivered · 2 too early to tell
Said on Feb 13, 2025
Duke Energy's Q4 FY2024 earnings release set a 2025 adjusted EPS guidance range of $6.17 to $6.42.
DeliveredWhat happened
2025 adjusted EPS was $6.31, inside the range; GAAP EPS was also $6.31.
Said on Nov 7, 2025
Duke Energy said in its Q3 FY2025 earnings release that it would announce a 2026 to 2030 capital plan of between $95 billion and $105 billion in February.
DeliveredWhat happened
The Q4 FY2025 earnings release (Feb 10, 2026) announced a $103 billion five-year capital plan.
Said on Feb 26, 2026
The FY2025 10-K described the agreed sale of Piedmont Natural Gas's Tennessee business to Spire Inc. for $2.48 billion.
DeliveredWhat happened
The sale closed on Mar 31, 2026, with about $2.5 billion of proceeds.
Said on Feb 10, 2026
Duke Energy's Q4 FY2025 earnings release set a 2026 adjusted EPS guidance range of $6.55 to $6.80.
Too early to tellWhat happened
The year is not over. On Nov 5, 2026 the company narrowed the range to $6.70 to $6.80; adjusted EPS for the first nine months was $5.35 (Cityfort calculation from the Q2 FY2026 and Q3 FY2026 earnings releases).
Said on Nov 5, 2026
Duke Energy said Duke Energy Carolinas and Duke Energy Progress would combine, with a target effective date of Jan 1, 2027.
Too early to tellWhat happened
FERC, North Carolina and South Carolina approvals had been received as of the Q3 FY2026 10-Q.
Sources (8)
- Form 10-K, fiscal year 2025 (ended Dec 31, 2025)
- 2026 proxy statement (DEF 14A)
- Q3 FY2026 earnings release (8-K Item 2.02, Ex. 99.1)
- Q4 and full-year FY2024 earnings release (8-K Item 2.02, Ex. 99.1)
- Q4 and full-year FY2025 earnings release (8-K Item 2.02, Ex. 99.1)
- Q3 FY2025 earnings release (8-K Item 2.02, Ex. 99.1)
- Form 10-Q, Q3 FY2026 (quarter ended Sep 30, 2026)
- Q2 FY2026 earnings release (8-K Item 2.02, Ex. 99.1)
08What could go wrong
What could go wrong for Duke Energy?
- Regulation
Rate decisions by state commissions
Regulated electricity and gas brought in $29,060 million and $2,870 million of FY2025 revenue, at rates set by state commissions and FERC, and the FY2025 10-K names limits on cost recovery and returns as a risk. Q2 FY2026 included a $51 million impairment tied to North Carolina rate case settlements.
Watch Rate case outcomes and Electric Utilities and Infrastructure segment income each quarter ($1,817 million in Q3 FY2026).
- Debt
Heavy borrowing to fund building
Capital spending exceeded operating cash flow in four of the five years from FY2021 to FY2025, and total debt reached $92,789 million on Sep 30, 2026. Interest expense was $3,634 million in FY2025. The 10-K says Duke Energy depends on debt and equity markets and needs investment-grade ratings.
Watch Total debt, capital spending ($12,566 million in the first nine months of FY2026) and the Moody's Baa2 and S&P BBB+ ratings.
- Other
Storms and severe weather
The FY2025 10-K names natural disasters and severe weather as risks; hurricanes Debby, Helene and Milton hit its service areas in 2024. Q4 FY2024 results included a $23 million Hurricane Helene insurance deductible.
Watch Storm costs and how state commissions let the utilities recover them.
- Execution
Cost overruns on new plants
The 10-K says new plants can run over budget or late, and the utilities may not recover all the investment. Duke Energy plans a $103 billion capital program for 2026 to 2030 and 16 GW of new generation by 2031, as it stated in Feb and Nov 2026.
Watch Capital spending against the FY2025 10-K's 2026 projection of $17,750 million.
- Other
Nuclear plants
Nuclear made 27.5% of the electricity the utilities supplied in 2025. The 10-K names decommissioning, spent fuel and insurance limits as risks; asset retirement obligations were $9,625 million at Dec 31, 2025.
Watch Nuclear decommissioning trust funds ($12,889 million at Dec 31, 2025) against those obligations.
- Execution
Completing the Brookfield investment
Brookfield's stake in Florida Progress is due to rise in steps to an anticipated 19.7% by Jun 30, 2028, for $6 billion in total. The 10-K says failing to complete such transactions could affect Duke Energy's credit profile.
Watch The next payment of $200 million, due by Dec 31, 2026.
- Other
More shares in issue
Equity units, convertible notes and a $6 billion at-the-market program can add common shares; the equity units alone settle into 13.2 million to 16.5 million shares on Aug 1, 2029.
Watch Shares outstanding on each 10-Q cover (779,708,297 on Oct 31, 2026).
Sources (7)
- Form 10-K, fiscal year 2025 (ended Dec 31, 2025)
- Q2 FY2026 earnings release (8-K Item 2.02, Ex. 99.1)
- Q3 FY2026 earnings release (8-K Item 2.02, Ex. 99.1)
- Form 10-Q, Q3 FY2026 (quarter ended Sep 30, 2026)
- Q4 and full-year FY2024 earnings release (8-K Item 2.02, Ex. 99.1)
- Q4 and full-year FY2025 earnings release (8-K Item 2.02, Ex. 99.1)
- Form 8-K filed Aug 13, 2026 (Item 8.01: equity units and remarketable senior notes)
09Both sides
What do supporters and critics point to?
What supporters point to
- Revenue rose every year from $24,621 million in FY2021 to $32,237 million in FY2025.
- Electric Utilities and Infrastructure's segment income rose from $3,850 million in FY2021 to $5,337 million in FY2025.
- Dividends declared per share rose every year from $3.90 in FY2021 to $4.22 in FY2025, and 2025 was the 99th consecutive year of quarterly dividends.
- Retail electricity sales rose 2.1% to 171,209 GWh in the first nine months of FY2026, from 167,650 GWh a year earlier.
- Net income available to common stockholders was $4,164 million in the first nine months of FY2026, up from $3,743 million a year earlier.
What critics point to
- Free cash flow was negative in four of the five years from FY2021 to FY2025, and minus $4,677 million in the first nine months of FY2026.
- Total debt rose from $67,139 million at Dec 31, 2021 to $92,789 million on Sep 30, 2026.
- Interest expense rose from $2,207 million in FY2021 to $3,634 million in FY2025, or $11.01 of every $100 that came in during FY2025.
- Equity units, convertible notes and a $6 billion at-the-market program can add common shares.
- Reported EPS fell to $3.17 in FY2022 and $3.54 in FY2023 because of losses on the Commercial Renewables sale.
10What to watch next
What should you watch next at Duke Energy?
Next event
Q4 FY2026 results
Date not announced yet.
2026 adjusted EPS
Duke Energy narrowed its 2026 range to $6.70 to $6.80 on Nov 5, 2026; adjusted EPS for the first nine months was $5.35 and GAAP EPS $5.34.
Debt and funding
Total debt was $92,789 million on Sep 30, 2026, up from $89,836 million at Dec 31, 2025. Capital spending in the first nine months of FY2026 was $12,566 million against operating cash flow of $7,889 million.
Carolinas utilities combination
Duke Energy Carolinas and Duke Energy Progress target combining on Jan 1, 2027, with FERC and both state commissions' approvals received.
Brookfield payments
Further payments for the Florida Progress stake are due: $200 million by Dec 31, 2026, $500 million by Jun 30, 2027, $1.5 billion by Dec 31, 2027 and $1 billion by Jun 30, 2028.
11Key dates
What are the key dates for Duke Energy?
| Event | Date | Source |
|---|---|---|
| Brookfield payment for the Florida Progress stake ($200 million)Due by this date under the agreement. | Form 10-Q, Q3 FY2026 (quarter ended Sep 30, 2026) | |
| Duke Energy Carolinas and Duke Energy Progress combinationTarget effective date, as the Q3 FY2026 10-Q states it. | Form 10-Q, Q3 FY2026 (quarter ended Sep 30, 2026) | |
| Equity units purchase contracts settle into common shares | Form 10-Q, Q3 FY2026 (quarter ended Sep 30, 2026); Form 8-K filed Aug 13, 2026 (Item 8.01: equity units and remarketable senior notes) |
12Key facts
Key facts about Duke Energy
- What does Duke Energy do?
- Duke Energy owns regulated electric utilities that serve about 8.7 million retail customers across about 90,000 square miles in six states: North Carolina, South Carolina, Florida, Indiana, Ohio and Kentucky. Duke Energy also had about 1.8 million natural gas customers at Dec 31, 2025, and owned about 55,713 MW of generating capacity.
- How does Duke Energy make money, and what is its business model?
- Duke Energy's business model is regulated: state commissions and FERC set the prices its utilities charge, designed to cover the cost of service and a return on the money invested in plants, lines and pipes. In FY2025 Duke Energy's revenue was $32,237 million, of which $29,060 million came from regulated electricity and $2,870 million from regulated natural gas.
- Is Duke Energy profitable?
- Yes. Duke Energy's FY2025 net income available to common stockholders was $4,912 million, or $6.31 per share, up from $4,402 million ($5.71) in FY2024. Duke Energy's operating income was $8,626 million in FY2025. In the first nine months of FY2026, net income available to common stockholders was $4,164 million.
- What is Duke Energy's revenue by segment?
- In FY2025, Duke Energy's Electric Utilities and Infrastructure segment had revenue of $29,357 million (90.3% of segment revenue before eliminations), Gas Utilities and Infrastructure $3,003 million (9.2%) and Other $165 million (0.5%). After $288 million of eliminations between segments, total revenue was $32,237 million. Shares are a Cityfort calculation from the FY2025 10-K.
- Who are Duke Energy's customers?
- In FY2025, residential customers paid Duke Energy 47.6% of revenue, commercial customers 28.4%, industrial customers 11.2%, wholesale electricity buyers 7.5% and other sources 5.4% (Cityfort calculation from the FY2025 10-K). The FY2025 10-K says no Duke Energy utility had a customer that paid more than 10% of its revenue.
- Who owns Duke Energy?
- Duke Energy's reported 5% holders include Vanguard Capital Management with 7.54% (Mar 31, 2026), and BlackRock with 7.52% and State Street with 5.42%, as the 2026 proxy statementThe yearly filing about shareholder votes, the board and executive pay. Learn more lists them from 2024 filings. Duke Energy's directors and executive officers as a group held about 0.12% on Mar 1, 2026 (Cityfort calculation from the 2026 proxy statement). Duke Energy has one class of common stock.
- What is Duke Energy's Electric Utilities and Infrastructure segment?
- Electric Utilities and Infrastructure is Duke Energy's regulated electricity business: Duke Energy Carolinas, Duke Energy Progress, Duke Energy Florida, Duke Energy Indiana and Duke Energy Ohio (which includes Kentucky). It had FY2025 revenue of $29,357 million and segment income of $5,337 million.
- What is Duke Energy's Gas Utilities and Infrastructure segment?
- Gas Utilities and Infrastructure is Duke Energy's natural gas business: Piedmont Natural Gas in North Carolina and South Carolina, gas distribution in Ohio and Kentucky, plus storage, pipeline and renewable natural gas investments. It had FY2025 revenue of $3,003 million and segment income of $559 million. Duke Energy sold Piedmont's Tennessee business on Mar 31, 2026.
- How much debt does Duke Energy have?
- Duke Energy had total debt of $92,789 million and cash of $451 million on Sep 30, 2026, up from debt of $89,836 million at Dec 31, 2025 (Cityfort calculation from the Q3 FY2026 10-Q). Duke Energy's interest expense was $3,634 million in FY2025.
- Does Duke Energy pay a dividend?
- Yes. Duke Energy declared dividends of $4.22 per share in FY2025, up from $3.90 in FY2021, and 2025 was its 99th consecutive year of quarterly dividends, according to the FY2025 10-K. Duke Energy declared $1.085 per share for Q3 FY2026.
Terms on this page
- Capital expenditures (capex)
- Debt-to-equity
- Dividend payout ratio
- Earnings per share (EPS)
- EBITDA
- Free cash flow
- Interest coverage
- Market cap
- Net debt
- Net margin
Each explains the term in plain English, with the same number from other companies on Cityfort.
Go deeper
More detail from the same filings. Open any section.
13What it sells
13What it sells
What does Duke Energy sell?
Electricity (Electric Utilities and Infrastructure)
Power for about 8.7 million retail customers in the Carolinas, Florida, Indiana, Ohio and Kentucky, from about 55,713 MW of plants Duke Energy owns. Segment revenue was $29,357 million in FY2025.
Natural gas (Gas Utilities and Infrastructure)
Gas delivered to about 1.8 million customers at Dec 31, 2025: about 1 million in the Carolinas, 205,000 in Tennessee (sold on Mar 31, 2026) and 565,000 in southwest Ohio and northern Kentucky. Segment revenue was $3,003 million in FY2025.
Power sold to other utilities
Wholesale electricity sold to other utilities and power buyers brought in $2,402 million in FY2025.
Think of it like this
Like a toll road that a state lets one company run: the state sets the toll, and the toll is meant to cover the road's costs plus a return on the money spent building it.
What it does
- Does: Generates electricity in its own gas, nuclear, coal, hydro and solar plants and delivers it to homes and businesses.
- Does: Builds and runs power lines and gas pipes in its service areas.
- Does: Asks state commissions to approve the rates it charges, in cases called rate cases.
What it does not do
- Does not: Set its own retail prices: state commissions set them.
- Does not: Have Ohio's generation supply to itself: Ohio has competitive generation supply, and Duke Energy earns on delivery there.
- Does not: Own all of its Indiana and Florida utilities' parent companies: GIC owns 19.9% of Duke Energy Indiana's holding company, and a Brookfield affiliate 9.19% of Florida Progress since Mar 3, 2026.
14How the money flows
14How the money flows · FY2025
How does money flow through Duke Energy?
Money in
- Operating revenues$32.2B
- Other income ($669M), gains on asset sales ($45M) and earnings of part-owned companies ($51M)$765M
The company
Duke Energy
$33.0B came in
Money out
- Fuel, purchased power and natural gas$9.0B
- Operation, maintenance and other$6.7B
- Depreciation and amortization$6.3B
- Interest expense$3.6B
- Property and other taxes$1.6B
- Income tax$642M
- Minority owners' share and preferred dividends$158M
- Net income available to common stockholders$4.9B
- Customers paid Duke Energy $32.2 billion in FY2025, $29.1 billion of it for regulated electricity.
- Fuel, bought-in power and gas cost $9.0 billion, and running and maintaining the system $6.7 billion.
- Wear-and-tear of plants and lines (depreciation) took $6.3 billion and property taxes $1.6 billion; with $45 million of gains on asset sales, that left operating income of $8,626 million.
- Interest took $3.6 billion and other income, including earnings of part-owned companies, added $0.7 billion, for income before tax of $5,712 million.
- After $642 million of income tax and $158 million for minority owners and preferred stock, $4,912 million was left for common stockholders.
15What it needs to run
15What it needs to run
What does Duke Energy need to run?
Power plants
About 55,713 MW of owned generating capacity. In 2025, natural gas and oil made 33.5% of the electricity the utilities supplied, nuclear 27.5%, coal 14.5%, hydro and solar 2.0%, and 22.5% was bought from others.
Lines, pipes and plants on the books
Net property, plant and equipment was $137,753 million on Sep 30, 2026, up from $105,536 million at Dec 31, 2021.
Fuel
Fuel and purchased power cost $8,058 million in FY2025. Fuel cost per kilowatt-hour in 2025 was 3.95 cents for gas, 4.19 cents for coal and 0.58 cents for nuclear.
Borrowed money
Duke Energy issued $11,891 million of long-term debt in FY2025 and repaid $5,652 million. It also had $7.8 billion available under its $10 billion credit facility at Dec 31, 2025.
Regulators' approval
Rates are set by commissions in North Carolina, South Carolina, Florida, Indiana, Ohio and Kentucky, and by the Federal Energy Regulatory Commission (FERC) for wholesale sales and transmission.
People
26,441 employees at Dec 31, 2025, of whom 5,027 were represented by unions.
16Where growth could come from
16Where growth could come from
Where could Duke Energy's growth come from?
Duke Energy said in its Q3 FY2026 earnings release (Nov 5, 2026) that it narrowed its 2026 adjusted EPS guidance range to $6.70 to $6.80, from $6.55 to $6.80 set on Feb 10, 2026. It said it expects adjusted EPS to grow 5% to 7% a year through 2030 from a 2025 base of $6.30, in the top half of that range from 2028, and plans 16 GW of new generation by 2031. On Feb 10, 2026 it announced a $103 billion five-year capital plan for 2026 to 2030. Adjusted EPS is a company measure; FY2025 GAAP EPS was $6.31.
Capital spending
Working$12,566M in 9M FY2026, up 27.2%
Capital spending in the first nine months of FY2026 rose from $9,881 million a year earlier. The FY2025 10-K projected $17,750 million of capital and investment spending for 2026, inside the $103 billion five-year plan the company announced on Feb 10, 2026.
Status: Working, on track against what the company said.
Recovering investment in rates
WorkingQ3 FY2026 segment income $1,817M vs $1,658M
The Q3 FY2026 earnings release says Electric Utilities and Infrastructure's income rose on recovery of infrastructure investment and favorable weather, partly offset by higher depreciation on a growing asset base, impacts from minority interest investments and higher interest expense.
Status: Working, on track against what the company said.
Large new electricity users
EarlyRetail sales 171,209 GWh in 9M FY2026, up 2.1%
Retail electricity sales rose 2.1% to 171,209 GWh in the first nine months of FY2026, from 167,650 GWh a year earlier; commercial sales rose 2.2% and industrial sales fell 0.9%. Duke Energy said on Nov 5, 2026 that it plans 16 GW of new generation by 2031.
Status: Early, too early to judge.
Combining the two Carolinas utilities
NewTarget effective date Jan 1, 2027
Duke Energy Carolinas and Duke Energy Progress plan to combine; the Q3 FY2026 10-Q says FERC and the North Carolina and South Carolina commissions have approved it.
Status: New, recently announced.
Selling stakes to fund building
Working$2.8B received from Brookfield, Mar 3, 2026
A Brookfield affiliate bought 9.19% of Florida Progress, rising to an anticipated 19.7% for $6 billion in total by Jun 30, 2028. Duke Energy also sold Piedmont's Tennessee gas business for about $2.5 billion on Mar 31, 2026.
Status: Working, on track against what the company said.
Status compares progress with what the company itself said it would do: Working = on track against what the company said; Mixed = partly on track; Behind = behind the company's own plan; New = recently announced; Early = too early to judge.
17The company's own measures (non-GAAP)
17The company's own measures · FY2023, FY2025 and FY2026 quarters, as each row says
What do Duke Energy's own measures show?
Official (GAAP): EPS, FY2025
$6.31
Company's own measure: Adjusted EPS, FY2025
$6.31
Duke Energy's measure starts from income from continuing operations and leaves out special items that management deems not part of ongoing performance. In FY2025 the two were the same. Adjusted EPS was $5.90 in FY2024 (GAAP EPS $5.71).
Official (GAAP): Net income available to common stockholders, FY2025
$4.9B
Company's own measure: Adjusted earnings, FY2025
$4.9B
The $1 million gap is income from discontinued operations, which the adjusted measure leaves out.
Official (GAAP): EPS, FY2023
$3.54
Company's own measure: Adjusted EPS, FY2023
$5.56
The gap is mainly the loss on the Commercial Renewables business ($1,391 million in discontinued operations) and $95 million of repositioning charges, which the adjusted measure leaves out.
Official (GAAP): EPS, Q1 FY2026
$1.97
Company's own measure: Adjusted EPS, Q1 FY2026
$1.93
The adjusted measure leaves out a $171 million after-tax gain on selling Piedmont's Tennessee business and $150 million after tax of legal and regulatory settlement charges ($197 million before tax).
Official (GAAP): EPS, Q3 FY2026
$1.99
Company's own measure: Adjusted EPS, Q3 FY2026
$1.99
No special items in the quarter. Adjusted EPS for the first nine months of FY2026 was $5.35 (Cityfort calculation from the Q2 FY2026 and Q3 FY2026 earnings releases); GAAP EPS was $5.34.
These are the company's own measures, defined by the company. They are not comparable across companies, and they are not added together. Each sits beside the nearest official (GAAP) figure.
Learn: Non-GAAP measures: what a company's "adjusted" numbers leave out
Sources (7)
- Form 10-K, fiscal year 2025 (ended Dec 31, 2025)
- Form 10-Q, Q3 FY2026 (quarter ended Sep 30, 2026)
- Form 10-K, fiscal year 2023 (ended Dec 31, 2023)
- Q4 and full-year FY2024 earnings release (8-K Item 2.02, Ex. 99.1)
- Q1 FY2026 earnings release (8-K Item 2.02, Ex. 99.1)
- Q3 FY2026 earnings release (8-K Item 2.02, Ex. 99.1)
- Q2 FY2026 earnings release (8-K Item 2.02, Ex. 99.1)
18Financial strength and debt
18Financial strength · Sep 30, 2026
How much debt does Duke Energy have?
- Total debt$92.8B
- Cash and investments$451M
- Net debt (debt minus cash)$92.3B
- Net worth (shareholders' money)$55.4B
- Debt to equity
- 1.68×
- $ of debt for every $1 of shareholders' money
- Interest cover
- 2.4×
- how many times operating profit covers interest
- Net debt of $92,338 million = total debt of $92,789 million (notes payable and commercial paper $2,341 million, current maturities of long-term debt $6,116 million and long-term debt $84,332 million) minus cash of $451 million (Cityfort calculation from the Q3 FY2026 10-Q). Operating lease liabilities are not included.
- Total debt on the same basis was $67,139 million at Dec 31, 2021 and $89,836 million at Dec 31, 2025 (Cityfort calculation from the FY2022 and FY2025 10-Ks).
- Debt to equity of 1.68 uses Duke Energy stockholders' equity of $55,377 million, which includes preferred stock; total equity including noncontrolling interests was $57,542 million (Cityfort calculation from the Q3 FY2026 10-Q).
- Interest coverage of 2.37 = FY2025 operating income of $8,626 million ÷ interest expense of $3,634 million (Cityfort calculation from the FY2025 10-K).
- EBITDA on this page = operating income + depreciation and amortization from the income statement ($6,324 million in FY2025). The cash flow statement's line ($7,704 million in FY2025) also includes nuclear fuel amortization and accretion, so it is not used (Cityfort calculation from the FY2025 10-K).
- Other large obligations at Dec 31, 2025 included asset retirement obligations of $9,625 million and deferred income taxes of $12,377 million; nuclear decommissioning trust funds held $12,889 million.
19Who owns it
19Who owns it · ownership as of Mar 1, 2026
Who owns Duke Energy?
- Officers and directors (as a group), shares
- 0.1%
Share classes
Holders of 5% or more
From the company's proxy statement (DEF 14A), later Schedule 13G filings and the share counts on its latest annual or quarterly report. Each holder row shows the date of its own filing.
Insider trades · Form 4 data as of Nov 6, 2026
What did Duke Energy's insiders report trading?
Duke Energy's insiders made 71 Form 4A filing an insider must make within two business days of buying or selling the company's shares. Learn more filings in the 12 months to Nov 6, 2026.
They reported no purchases and 13 sales (78,447 shares) in the open market or privately (codes P and S).
8 of the 13 sales were on forms with the Rule 10b5-1 plan box checked.
The same filings report 88 other share transactions (F: 57, A: 29, G: 1, I: 1).
They also report 16 transactions in options, stock units or other derivatives.
Insiders are a company's officers, directors and owners of more than 10% of a class of its shares. Most changes in their holdings must be reported to the SEC on a Form 4 within two business days. Source: SEC Form 4 filings on EDGAR.
- P
- a purchase in the open market or privately
- S
- a sale in the open market or privately
- A
- a grant, award or other acquisition from the company under Rule 16b-3
- F
- shares withheld or handed over to pay an exercise price or tax when an award is received, exercised or vests
- I
- a discretionary transaction under Rule 16b-3(f), such as a move in or out of a company stock fund
- G
- a bona fide gift
Code meanings: General Instruction 8 of Form 4 (SEC).
The latest 25 of 101 transactions
Shares: A = acquired, D = disposed of. A price the filing gives only in a footnote shows as “See filing”. The 10b5-1 box is checked when at least one trade on the form was made under a Rule 10b5-1 plan. A Form 4/A replaces the form it amends. See all of Duke Energy's Form 4 filings on EDGAR.
Learn: How to read a proxy statement (DEF 14A): Nvidia's 2026 proxy · Form 4 insider filings: who files, the codes and the footnotes · Rule 10b5-1 trading plans: how insiders pre-schedule their trades
20What it does with profit
20What it does with profit
What does Duke Energy do with its profit?
Dividend per share
$4.22FY2025
Dividend paid for each share, by financial year.
$ per share
See the numbers
Money raised · Dec 31, 2021
Contributions from noncontrolling interests (outside investors in subsidiaries) in FY2021.
$1.6B
Money raised · Dec 31, 2022
Contributions from noncontrolling interests in FY2022.
$1.4B
Money raised · Mar 3, 2026
A Brookfield affiliate bought 9.19% of Florida Progress, the holding company of Duke Energy Florida (about).
$2.8B
Money raised · Aug 13, 2026
40 million equity units (NYSE: DUKU), gross; the purchase contracts settle into 13.2 million to 16.5 million common shares on Aug 1, 2029, depending on the share price.
$2.0B
21Governance signals
21Governance signals
What do Duke Energy's governance filings show?
- Auditor
- Deloitte & Touche LLP
- Auditor changes
- None in the period covered
- Audit qualifications
- None reported
- Related-party dealings
- This page does not summarize related-party transactions: the related-person section of the 2026 proxy statement was not reviewed for it.
- Credit rating
- Moody's and S&P Global Ratings (as of February 2026, as stated in the FY2025 10-K) Baa2 (Moody's) / BBB+ (S&P), issuer ratings of Duke Energy Corporation (Stable at both), Feb 26, 2026
A credit rating describes the company's ability to repay debt. It is not a rating of the share.
Flags to know about
disclosure
Discontinued operations in FY2022 and FY2023
Losses on selling the Commercial Renewables business, shown as discontinued operations, cut reported EPS to $3.17 in FY2022 and $3.54 in FY2023; EPS from continuing operations was $4.74 and $5.35.
regulatory · May 5, 2026
Legal and regulatory settlement charges
Q1 FY2026 results include $197 million before tax of legal and regulatory settlement charges at Duke Energy Carolinas and Duke Energy Progress, and Q2 FY2026 a $51 million impairment tied to Duke Energy Carolinas' North Carolina rate case settlements.
other
Lawsuits named in the filings
The Town of Carrboro, North Carolina, sued Duke Energy on Dec 4, 2024, alleging it hid the climate dangers of fossil fuel emissions. On Feb 12, 2026 the court granted Duke Energy's motion to dismiss for lack of subject-matter jurisdiction. The Q1 FY2026 10-Q says the appeal window expired in March 2026 with no action by the town, and the matter is fully resolved. In a Maryland suit alleging water contamination by the fuel additive MTBE, Duke Energy Merchants entered into a settlement agreement with the State in November 2025. The Q3 FY2026 10-Q says some non-settling defendants opposed it, and the court withdrew its earlier dismissal orders. Mediation on Jul 29, 2026 was not successful, and the wording of the dismissal order is back before the federal district court.
other
Ways the share count can rise
The August 2026 equity units settle into 13.2 million to 16.5 million shares on Aug 1, 2029, the $1.5 billion of convertible notes due March 2029 convert at 6.2277 shares per $1,000, and a $6 billion at-the-market program from March 2026 allows sales of new shares.
other · Sep 25, 2026
New director
Joyce Mullen was appointed to the Board of Directors, effective Sep 28, 2026.
disclosure
What the filings used do not break out
This page has no earnings call transcripts or investor slides. Stock-based compensationPay given as shares instead of cash, which spreads ownership more thinly. Learn more is not a separate line in Duke Energy's cash flow statement, and cash flows include discontinued operations, which the company does not split out.
Sources (9)
- Form 10-K, fiscal year 2025 (ended Dec 31, 2025)
- 2026 proxy statement (DEF 14A)
- Form 10-Q, Q3 FY2026 (quarter ended Sep 30, 2026)
- Form 10-K, fiscal year 2023 (ended Dec 31, 2023)
- Q1 FY2026 earnings release (8-K Item 2.02, Ex. 99.1)
- Q2 FY2026 earnings release (8-K Item 2.02, Ex. 99.1)
- Form 10-Q, Q1 FY2026 (quarter ended Mar 31, 2026)
- Form 8-K filed Aug 13, 2026 (Item 8.01: equity units and remarketable senior notes)
- Form 8-K filed Sep 25, 2026 (Item 5.02: director appointment)
22What the market paid
22What the market paid · price as of Nov 5, 2026
What did the market pay for Duke Energy on Nov 5, 2026?
Price as of Nov 5, 2026 (shown for education; prices change daily).
Price as of Nov 5, 2026: a $130.08 close, from Nasdaq's historical price table for DUK; Duke Energy's shares are listed on the NYSE. Market value = $130.08 × 779,708,297 shares (10-Q cover, Oct 31, 2026) = $101,424 million (Cityfort calculation from the Nov 5, 2026 closing price and the Q3 FY2026 10-Q). P/E is price ÷ earnings per share: 20.6 on FY2025 EPS of $6.31 (Cityfort calculation from the FY2025 10-K), and 19.0 on the $6.84 of EPS in the four quarters to Sep 30, 2026 (Cityfort calculation from the Q4 FY2025 to Q3 FY2026 earnings releases). Dividend yield = $4.34 (4 × the $1.085 Q3 FY2026 dividend) ÷ $130.08 = 3.34% (Cityfort calculation from the Q3 FY2026 10-Q).
- Share price
- $130.08
- Market value (market cap)
- $101.4B
- P/E
- 20.6×
More price-based ratios · as of Nov 5, 2026
Each ratio divides a number from the company's filings by the market value or share price on Nov 5, 2026. Prices change daily, so these ratios do too.
Price to sales (P/S)
3×
$101.4B market value ÷ $33.8B revenue (four quarters to Sep 30, 2026) = 3×
Cityfort calculation from the Nov 5, 2026 closing price and the Q4 FY2025 to Q3 FY2026 10-Qs and earnings releases. Source: DUK historical daily prices, Nasdaq's table for an NYSE-listed share (close of Nov 5, 2026: $130.08); Form 10-Q, Q3 FY2026 (quarter ended Sep 30, 2026); Form 10-K, fiscal year 2025 (ended Dec 31, 2025) and 4 more
How price ratios workFree cash flow yield
−1.7%
−$1.7B free cash flow (FY2025) ÷ $101.4B market value = −1.7%
Cityfort calculation from the FY2025 10-K and the Nov 5, 2026 closing price. Source: DUK historical daily prices, Nasdaq's table for an NYSE-listed share (close of Nov 5, 2026: $130.08); Form 10-Q, Q3 FY2026 (quarter ended Sep 30, 2026); Form 10-K, fiscal year 2025 (ended Dec 31, 2025) and 4 more
What free cash flow means
Shares used for the market value: 779.71 million ($130.08 × 779.71 million shares ≈ $101.4B). Source: Form 10-Q, Q3 FY2026 (quarter ended Sep 30, 2026); Form 10-K, fiscal year 2025 (ended Dec 31, 2025)
Source: DUK historical daily prices, Nasdaq's table for an NYSE-listed share (close of Nov 5, 2026: $130.08); Form 10-Q, Q3 FY2026 (quarter ended Sep 30, 2026); Form 10-K, fiscal year 2025 (ended Dec 31, 2025) and 4 more
Sources (7)
- DUK historical daily prices, Nasdaq's table for an NYSE-listed share (close of Nov 5, 2026: $130.08)
- Form 10-Q, Q3 FY2026 (quarter ended Sep 30, 2026)
- Form 10-K, fiscal year 2025 (ended Dec 31, 2025)
- Q4 and full-year FY2025 earnings release (8-K Item 2.02, Ex. 99.1)
- Q1 FY2026 earnings release (8-K Item 2.02, Ex. 99.1)
- Q2 FY2026 earnings release (8-K Item 2.02, Ex. 99.1)
- Q3 FY2026 earnings release (8-K Item 2.02, Ex. 99.1)
23How it got here
23How it got here
How did Duke Energy get here?
2005
Milestone
Duke Energy Corporation incorporated
The current holding company was incorporated in Delaware on May 3, 2005.
2021
Business-model change
GIC invests in the Indiana utility
Duke Energy agreed to sell 19.9% of Duke Energy Indiana's holding company to GIC, in two closings.
2023
Business-model change
Commercial Renewables sold
Duke Energy sold its unregulated Commercial Renewables business to Brookfield Renewable for $1.1 billion; pre-tax losses on the sale were $1,748 million in 2022 and $1,725 million in 2023.
2024
Crisis
Hurricanes Debby, Helene and Milton
Three hurricanes hit Duke Energy's service areas in 2024, which the FY2025 10-K names among its weather risks.
2025
Milestone
New CEO
Lynn J. Good retired as Chair and CEO on Apr 1, 2025, and Harry K. Sideris became CEO.
2026
Business-model change
Brookfield buys into the Florida utility
On Mar 3, 2026 a Brookfield affiliate bought 9.19% of Florida Progress for about $2.8 billion, the first step toward an anticipated 19.7% stake.
2026
Business-model change
Tennessee gas business sold
Piedmont Natural Gas's Tennessee business, with about 205,000 customers, was sold to Spire Inc. on Mar 31, 2026 for about $2.5 billion.
24Sources and changes
Where every number on this page comes from
Sources (19 documents)
- S1Form 10-K, fiscal year 2025 (ended Dec 31, 2025) · Duke Energy Corporation (SEC EDGAR) · Tier 1: company or exchange filing · Feb 26, 2026
- S3Form 10-K, fiscal year 2023 (ended Dec 31, 2023) · Duke Energy Corporation (SEC EDGAR) · Tier 1: company or exchange filing · Feb 23, 2024
- S4Form 10-K, fiscal year 2022 (ended Dec 31, 2022) · Duke Energy Corporation (SEC EDGAR) · Tier 1: company or exchange filing · Feb 27, 2023
- S5Form 10-Q, Q3 FY2026 (quarter ended Sep 30, 2026) · Duke Energy Corporation (SEC EDGAR) · Tier 1: company or exchange filing · Nov 5, 2026
- S7Form 10-Q, Q1 FY2026 (quarter ended Mar 31, 2026) · Duke Energy Corporation (SEC EDGAR) · Tier 1: company or exchange filing · May 5, 2026
- S8Q3 FY2026 earnings release (8-K Item 2.02, Ex. 99.1) · Duke Energy Corporation (SEC EDGAR) · Tier 1: company or exchange filing · Nov 5, 2026
- S9Q2 FY2026 earnings release (8-K Item 2.02, Ex. 99.1) · Duke Energy Corporation (SEC EDGAR) · Tier 1: company or exchange filing · Aug 4, 2026
- S10Q1 FY2026 earnings release (8-K Item 2.02, Ex. 99.1) · Duke Energy Corporation (SEC EDGAR) · Tier 1: company or exchange filing · May 5, 2026
- S11Q4 and full-year FY2025 earnings release (8-K Item 2.02, Ex. 99.1) · Duke Energy Corporation (SEC EDGAR) · Tier 1: company or exchange filing · Feb 10, 2026
- S12Q3 FY2025 earnings release (8-K Item 2.02, Ex. 99.1) · Duke Energy Corporation (SEC EDGAR) · Tier 1: company or exchange filing · Nov 7, 2025
- S13Q2 FY2025 earnings release (8-K Item 2.02, Ex. 99.1) · Duke Energy Corporation (SEC EDGAR) · Tier 1: company or exchange filing · Aug 5, 2025
- S14Q1 FY2025 earnings release (8-K Item 2.02, Ex. 99.1) · Duke Energy Corporation (SEC EDGAR) · Tier 1: company or exchange filing · May 6, 2025
- S15Q4 and full-year FY2024 earnings release (8-K Item 2.02, Ex. 99.1) · Duke Energy Corporation (SEC EDGAR) · Tier 1: company or exchange filing · Feb 13, 2025
- S162026 proxy statement (DEF 14A) · Duke Energy Corporation (SEC EDGAR) · Tier 1: company or exchange filing · Mar 20, 2026
- S17Schedule 13G/A filed by The Vanguard Group (event Mar 13, 2026) · The Vanguard Group (SEC EDGAR) · Tier 1: company or exchange filing · Mar 26, 2026
- S18Schedule 13G filed by Vanguard Capital Management LLC (event Mar 31, 2026) · Vanguard Capital Management LLC (SEC EDGAR) · Tier 1: company or exchange filing · Apr 29, 2026
- S19Form 8-K filed Aug 13, 2026 (Item 8.01: equity units and remarketable senior notes) · Duke Energy Corporation (SEC EDGAR) · Tier 1: company or exchange filing · Aug 13, 2026
- S20Form 8-K filed Sep 25, 2026 (Item 5.02: director appointment) · Duke Energy Corporation (SEC EDGAR) · Tier 1: company or exchange filing · Sep 25, 2026
- S21DUK historical daily prices, Nasdaq's table for an NYSE-listed share (close of Nov 5, 2026: $130.08) · Nasdaq, Inc. · Tier 1: company or exchange filing · Nov 5, 2026
Changes to this page (v1 · Nov 6, 2026)
- v1 · Nov 6, 2026First version, through Q3 FY2026 (quarter ended Sep 30, 2026). (first version)
Numbers come only from tier 1 and tier 2 sources. Read how we research.
Disclaimer
For learning only. Cityfort is not a registered investment adviser or broker-dealer and does not recommend buying or selling any security. Prices shown are dated and may be out of date.
Investing in securities involves risk, including loss of capital. Before making any investment decision, do your own research and consider consulting a registered investment adviser or other qualified professional.
Cityfort, its owners and contributors may or may not hold securities of companies covered. Cityfort is not paid by any company it covers. Content is not an offer or solicitation to buy or sell any security, including in any initial public offering.
Read the positions policyRead the full disclaimerHide the full disclaimer
Cityfort publishes general educational content that explains how listed companies work. Cityfort is not registered with the US Securities and Exchange Commission or any state securities regulator as an investment adviser, and is not a broker-dealer or a member of FINRA. Cityfort does not provide investment, tax or legal advice, recommendations, ratings, price targets or any opinion on whether to buy, sell or hold any security. Nothing on the site is tailored to any person's circumstances.
All information is taken from publicly available sources, mainly company filings with the SEC, which are listed on each page with dates. We work to keep it accurate and correct errors publicly, but we do not guarantee that it is complete, accurate or up to date. Any market price or price-based ratio shown is dated, may be out of date by the time you read it, and is included only to explain concepts.
Statements by company management, including forward-looking statements and guidance, are reported as the company's statements, with their date and source; they are not our forecasts. Adjusted (non-GAAP) figures are the company's own measures and are shown next to the official (GAAP) figures.