Utilities · NASDAQ: CEG
Constellation: how the business works
Constellation generates electricity, mostly from nuclear plants, and sells power and natural gas to businesses, homes and utilities, with revenue of $25.5 billion in FY2025.
By Hardik Bhandare · Checked against filings: . Editorial policy. Corrections
Follow Constellation
Email me when Constellation's page is updated after earnings.
We'll send a confirmation email first. See our privacy policy.
Constellation Energy Corporation · Baltimore, Maryland
Updated for Q2 FY2026 · checked
- Revenue, FY2025
- $25.5B
- Net income, FY2025
- $2.3B
- Nuclear share of electricity supply, 2025
- 68%
- Employees, Dec 31, 2025
- 15,339
- Separate from Exelon since
- Feb 1, 2022
The short version
Constellation in 5 points
1 · What it sells
Constellation sells electricity, mostly from its own nuclear plants, plus natural gas, with FY2025 revenue of $25.5 billion, and nuclear supplied 68% of its electricity in 2025.
2 · Who pays it
Constellation serves about 2 million customer accounts, including about 1.4 million homes and three-fourths of Fortune 100 companies, plus utilities and grid markets, and it does not disclose revenue by type of customer.
3 · What it keeps from $100
Of every $100 that came in during FY2025, Constellation kept $8.76 as net income, after $805 million of unrealized hedge losses in revenue and with $936 million of other income that moves with decommissioning trust fund returns, while operating income was $11.66 per $100.
4 · Where the operating profit comes from
In FY2025 the Midwest region earned $3,702 million of revenue net of purchased power and fuel, the most of its five regions, and Mid-Atlantic $3,411 million.
5 · The one thing to watch
Borrowings rose from $8,992 million at Dec 31, 2025 to $24,700 million on Jun 30, 2026 after the Calpine deal, and plant sales for $5.0 billion and $860 million were still awaiting approval.
Sources: From Constellation's FY2025 10-K, the Q2 FY2026 10-Q and the Q2 FY2026 earnings release · checked
See the full receipt and the management scorecard below
01Where the money goes · FY2025
Where does $100 of Constellation's money go?
Constellation · FY2025
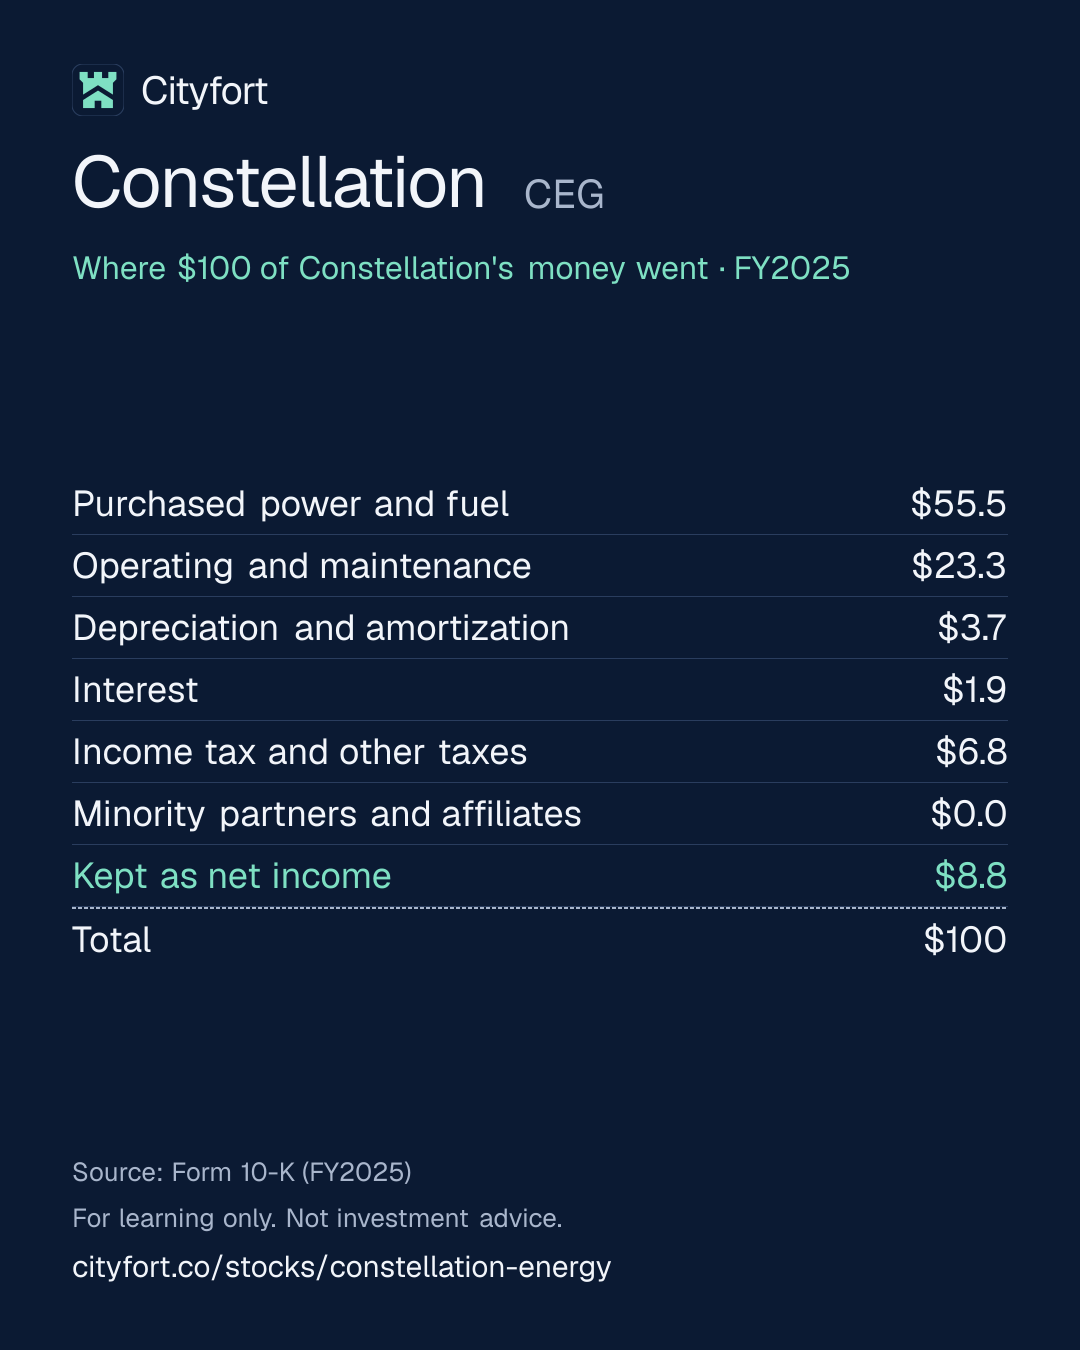
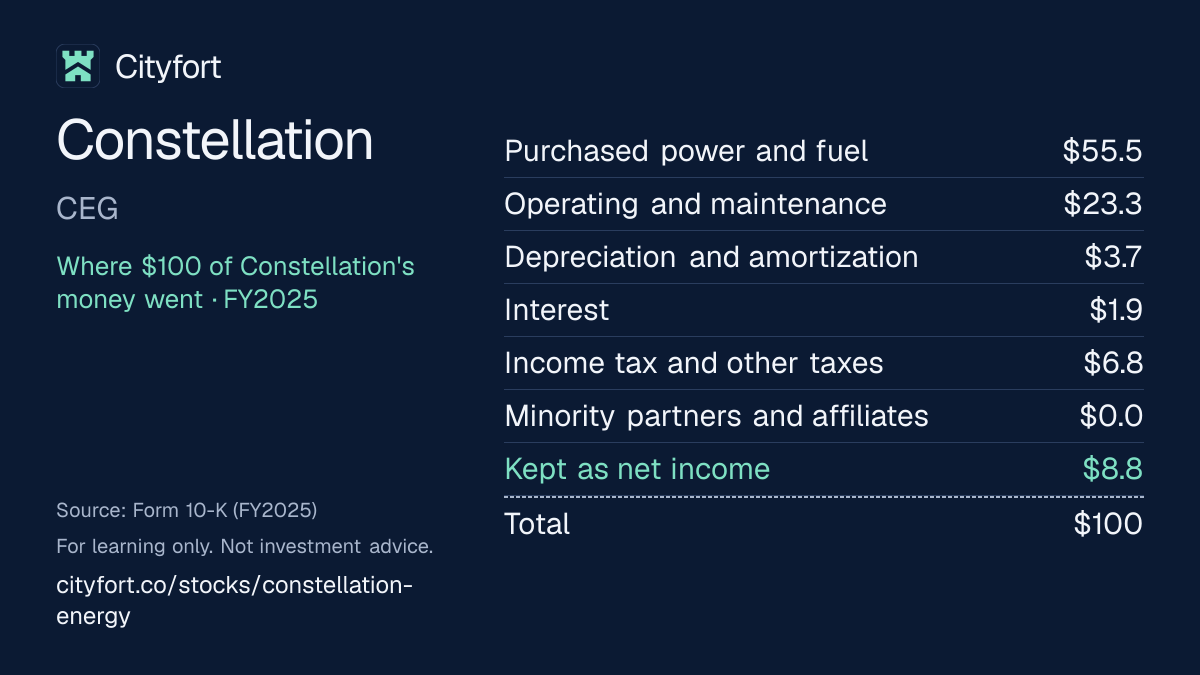
Receipt for every $100
| Purchased power and fuel | $55.5 |
|---|---|
| Operating and maintenance | $23.3 |
| Depreciation and amortization | $3.7 |
| Interest | $1.9 |
| Income tax and other taxes | $6.8 |
| Minority partners and affiliates | $0.0 |
| Kept as net income | $8.8 |
| Total | $100 |
Each line = amount ÷ total money in × 100. Lines may not add to exactly $100 because of rounding.
How this is worked out
Cityfort calculation from the FY2025 10-K. Of every $100 that came in during FY2025 (operating revenues $25,533 million + other income $936 million = $26,469 million): each line = line ÷ $26,469 million × 100. Revenue includes $805 million of unrealized hedge losses. Operating income was $11.66 of each $100.
Save this receipt as an image:
1080 × 1350 PNG for Instagram, LinkedIn1200 × 675 PNG for X
Embed this receipt
Paste this code into a blog or website to show the receipt, with a link back to this page:
Each week: one company explained in 5 points, picked by earnings date.
Free, no tips, unsubscribe anytime.
We'll send a confirmation email. See our privacy policy.
02The business in one line
What does Constellation do?
Businesses, homes, utilities and power markets pay Constellation for electricity and natural gas; most of the money goes on fuel and on power it buys from others, and $8.76 of every $100 that came in during FY2025 was left as net income.
- Nuclear plants supplied 68% of Constellation's electricity in 2025, and the gas-fired fleet of Calpine joined on Jan 7, 2026.
- Purchased power and fuel took $14,681 million of FY2025 revenue of $25,533 million, and operating and maintenance costs $6,159 million.
03Who pays it
Who pays Constellation?
Businesses and public bodies
Not disclosed
Commercial, industrial and public sector customers, the main buyers of about 147 TWh of retail power in 2025. Three-fourths of Fortune 100 companies are customers, and 77% of commercial and industrial power customers renewed in 2025.
Homes
Not disclosed
About 1.4 million residential customers, out of about 2 million customer accounts in total.
Utilities, municipalities and cooperatives
Not disclosed
Wholesale buyers that resell power to their own customers, often through load auctions. Retail and wholesale load served came to about 204 TWh in 2025.
Regional power markets
Not disclosed
Generation beyond Constellation's retail and wholesale load is sold into the regional grid market (RTO or ISO) where each plant sits.
Large companies on long-term contracts
Not disclosed
Microsoft (Crane, 20 years), Meta (Clinton, 20 years from June 2027) and Walmart (176 MW), each named by the company.
Federal nuclear tax credits
Not disclosed
Nuclear production tax credits counted in revenue: about $2,080 million in FY2024 and about $320 million in FY2025, with no material amount in the first half of 2026.
How spread out the customers are
Constellation does not split revenue by type of customer; it reports revenue by power region (see segments). No customer at 10% or more of revenue is disclosed in the FY2025 10-K text reviewed for this page.
04Why it makes money
Why does Constellation make money?
Profit is the gap between what power sells for and what fuel and bought-in power cost.
After purchased power and fuel, $10,852 million of FY2025 revenue was left; the company calls this revenue net of purchased power and fuel (RNF). Operating and maintenance costs were $6,159 million in both FY2024 and FY2025, so changes in that gap, and in nuclear tax credits, move profit.
Operating income per $100 of revenue
−$1.8$12.1
FY2021 to FY2025
- Nuclear, gas and renewable plants generate power
- Power is sold to businesses, homes and utilities, or into grid markets
- Hedges and contracts fix much of the price in advance
- What is left after fuel and bought-in power pays running costs
- Cash funds plant upkeep, license extensions, acquisitions, dividends and buybacks
↺ Step 5 feeds back into step 1.
05Business segments · FY2025
Which businesses make up Constellation?
Mid-Atlantic
25%Power sales in the Mid-Atlantic region. Revenue net of purchased power and fuel (RNF), the company's segment measure, was $3,411 million in FY2025. Shares are a Cityfort calculation from the FY2025 10-K.
Revenue $6.5B
Midwest
23%Power sales in the Midwest, the region with the most owned capacity (11,606 MW). RNF was $3,702 million in FY2025, the largest of the five regions.
Revenue $5.8B
Other Power Regions
22%New England, the South, the West and Canada. Most of this revenue went on purchased power and fuel: RNF was $819 million in FY2025.
Revenue $5.6B
New York
9%Power sales in New York. RNF was $1,600 million in FY2025.
Revenue $2.2B
ERCOT
7%Power sales in the Texas grid run by ERCOT. RNF was $1,137 million in FY2025.
Revenue $1.9B
Not allocated to a region
14%Natural gas sales ($1,758 million from customer contracts) and unrealized hedge results (an $805 million loss in FY2025), among other items. From 2026 Calpine is a sixth segment, with first-half FY2026 revenue of $4,541 million and RNF of $2,153 million.
Revenue $3.6B
How the mix changed
- Mid-Atlantic
- Midwest
- Other Power Regions
- New York
- ERCOT
- Not allocated to a region
Revenue by segment, FY2023 to FY2025.
US$
See the numbers
06The numbers · Consolidated · US$
How has Constellation done?
Revenue
$25.5BFY2025
Revenue rose from $19.6 billion in FY2021, before the Feb 1, 2022 separation from Exelon, to $25.5 billion in FY2025, and quarters from Q1 FY2026 include Calpine, bought on Jan 7, 2026.
US$
See the numbers
Net profit
$2.3BFY2025
Net income went from losses in FY2021 and FY2022 to $3,749 million in FY2024, when about $2,080 million of nuclear tax credits were in revenue, and $2,319 million in FY2025, with quarters swinging on unrealized hedge results.
US$
See the numbers
Profit kept per $100 of revenue
$9.1FY2025
Operating income was $12.1 per $100 of revenue in FY2025, down from $18.5 in FY2024; EBITDA is operating income plus the cash flow statement's depreciation and amortization line, a Cityfort calculation from the FY2025 and FY2023 10-Ks, and is not shown by quarter.
$ of profit per $100 of revenue (net margin)
See the numbers
Free cash flow
$1.3BFY2025
Operating cash flow was negative from FY2021 to FY2024 mainly because cash collected on receivables sold under a facility was recorded as investing cash ($10,217 million in FY2024); after the facility was amended on Dec 31, 2024, FY2025 free cash flow was $1,288 million.
US$ · cash from operations minus spending on plants and equipment
See the numbers
See all yearly numbers
EBITDA here = operating income plus depreciation and amortization (from the cash flow statement). Fiscal years are the company's own (Fiscal year ends Dec 31). Net profit is the share belonging to the company's owners.
Download Constellation's yearly and quarterly numbers (CSV, with source ids)
What revenue is made of · FY2025
Constellation's FY2025 revenue of $25,533 million includes $805 million of unrealized losses on economic hedges, paper results that can reverse, and about $320 million of nuclear tax credits. The other revenue line is a Cityfort calculation from the FY2025 10-K: other revenues of $2,870 million with the $805 million unrealized loss added back.
Revenue by type
Learn: Fiscal years that don't end in December: Nvidia's FY2027 explained · Stock-based compensation and dilution: pay that becomes shares
Sources (12)
- Form 10-K, fiscal year 2023 (ended Dec 31, 2023)
- Form 10-K, fiscal year 2025 (ended Dec 31, 2025)
- Q1 2025 earnings release (8-K Exhibit 99.1)
- Q2 2025 earnings release (8-K Exhibit 99.1)
- Q3 2024 earnings release (8-K Exhibit 99.1)
- Q4 and full-year 2024 earnings release (8-K Exhibit 99.1)
- Q4 and full-year 2025 earnings release (8-K Exhibit 99.1)
- Q3 2025 earnings release (8-K Exhibit 99.1)
- Q1 2026 earnings release (8-K Exhibit 99.1)
- Form 10-Q, Q1 2026 (quarter ended Mar 31, 2026)
- Q2 2026 earnings release (8-K Exhibit 99.1)
- Form 10-Q, Q2 2026 (quarter ended Jun 30, 2026)
07Who runs it
Who runs Constellation, and did they deliver?
Joseph Dominguez
President and Chief Executive Officer · since 2022
His 2025 total pay was $17,115,179, about 140 times the median employee's $122,610, per the 2026 proxy. The CEO and board chair roles are held by different people.
Shane Smith
Executive Vice President and Chief Financial Officer · since 2026
Daniel Eggers
Senior Executive Vice President, Finance and Data Economy · since 2026
Chief Financial Officer from 2022 to 2026.
What they said, and what happened
2 delivered · 3 too early to tell
Said on Nov 4, 2024
Constellation's Q3 2024 earnings release narrowed its 2024 adjusted (non-GAAPThe company's own "adjusted" numbers, not the official (GAAP) ones. Always read them next to the official figure. Learn more) operating earnings guidance to $8.00 to $8.40 per share.
DeliveredWhat happened
2024 adjusted operating earnings were $8.67 per share, above the range. GAAP diluted EPS was $11.89.
Said on Feb 18, 2025
Constellation's Q4 2024 earnings release affirmed 2025 adjusted operating earnings guidance of $8.90 to $9.60 per share.
DeliveredWhat happened
2025 adjusted operating earnings were $9.39 per share, inside the range, which had been narrowed to $9.05 to $9.45 in November 2025. GAAP diluted EPS was $7.40.
Said on Mar 31, 2026
Constellation's 2026 outlook presentation guided to 2026 adjusted operating earnings of $11.00 to $12.00 per share.
Too early to tellWhat happened
The year is not over. Constellation raised the range to $11.50 to $12.50 on Aug 6, 2026; adjusted operating earnings were $2.74 a share in Q1 and $2.55 in Q2.
Said on Aug 6, 2026
Constellation said in its Q2 2026 earnings release that it expects to restart the Crane Clean Energy Center in 2027.
Too early to tellWhat happened
In Q2 FY2026 the NRC approved the plant's fuel license request and FERC granted the grid connection waiver.
Said on Aug 6, 2026
Constellation said in its Q2 FY2026 10-Q that it expects the sales of five PJM plants and the Brazos Valley plant to LS Power to close by the end of 2026.
Too early to tellWhat happened
Not closed as of the Q2 FY2026 10-Q; both sales need regulatory approvals.
Sources (10)
- Form 10-K, fiscal year 2025 (ended Dec 31, 2025)
- 2026 proxy statement (DEF 14A)
- Q3 2024 earnings release (8-K Exhibit 99.1)
- Q4 and full-year 2024 earnings release (8-K Exhibit 99.1)
- Q4 and full-year 2025 earnings release (8-K Exhibit 99.1)
- Q3 2025 earnings release (8-K Exhibit 99.1)
- 2026 Business and Earnings Outlook presentation (8-K Exhibit 99.1, filed Mar 31, 2026)
- Q2 2026 earnings release (8-K Exhibit 99.1)
- Q1 2026 earnings release (8-K Exhibit 99.1)
- Form 10-Q, Q2 2026 (quarter ended Jun 30, 2026)
08What could go wrong
What could go wrong for Constellation?
- Raw-material prices
Power and fuel prices
The FY2025 10-K says wholesale and retail power prices and nuclear fuel, natural gas and oil prices can be volatile, and output that is not hedged earns spot and forward prices. Hedges also put unrealized gains and losses in revenue: an $805 million loss in FY2025.
Watch Unrealized hedge gains and losses in each earnings release's reconciliation, and revenue net of purchased power and fuel by region.
- Regulation
Changes to power market rules
The FY2025 10-K says PJM reforms, price caps, rules for new large power users and policies favoring new plants could lead to market designs that push existing plants into early retirement. Federal or state action on wholesale markets could also affect it.
Watch PJM and other grid operator rule changes on capacity prices and large loads such as data centers.
- Debt
Much more debt after Calpine
Borrowings rose from $8,992 million at Dec 31, 2025 to $24,700 million on Jun 30, 2026. A downgrade below investment grade would require about $3.4 billion of extra collateral (Q2 FY2026 10-Q), and the 10-K says it would raise borrowing costs.
Watch Total debt each quarter, use of the $5.0 billion and $860 million plant sale proceeds, and the BBB+ and Baa1 ratings.
- Execution
Nuclear outages and safety rules
The 10-K says NRC actions could affect nuclear operations and profits. In Q2 FY2026, planned refueling outage days rose to 86 from 41 a year earlier, and the capacity factor was 93.0%, against 94.8%.
Watch Nuclear output and capacity factor in each earnings release.
- Execution
Integrating Calpine
Goodwill rose from $420 million to $11,527 million with Calpine, and the 10-K says long-lived assets and goodwill could be impaired. The adjusted earnings reconciliations add back Calpine merger and integration costs of $119 million in Q1 FY2026 and $84 million in Q2.
Watch Calpine segment RNF, integration costs and any impairment in the 10-Q.
- Other
Decommissioning and pension funding
The 10-K says weaker returns on nuclear decommissioning trust funds and pension assets could require more funding. Trust funds were $19,336 million at Dec 31, 2025, against asset retirement obligations of $13,193 million.
Watch Trust fund balances and asset retirement obligations in the 10-K.
- Other
Weather and drought
The 10-K names weather, drought and climate as risks, including drought at Calpine's Geysers geothermal plants.
Watch Comments on weather and plant availability in the quarterly results.
09Both sides
What do supporters and critics point to?
What supporters point to
- The nuclear fleet ran at a 94.7% capacity factor in 2025, and refueling outages averaged 22 days in 2025, against an industry average of 33 days in 2024, per the FY2025 10-K.
- Constellation has 20-year contracts with Microsoft and Meta, and signed 920 MW of new 15 to 20 year contracts in Q2 FY2026, including 176 MW with Walmart.
- First-half FY2026 revenue was $18,626 million and net income $2,103 million, with Calpine included from Jan 7, 2026.
- Moody's and S&P affirmed the Baa1 and BBB+ ratings after the Calpine deal, according to the company's Mar 31, 2026 outlook presentation.
- The quarterly dividend rose from $0.1410 a share in 2022 to $0.4265 in 2026.
What critics point to
- Borrowings rose from $8,992 million at Dec 31, 2025 to $24,700 million on Jun 30, 2026, and goodwill from $420 million to $11,527 million.
- GAAP earnings swing with unrealized hedge results and trust fund returns: diluted EPS was $0.38 in Q1 FY2025 and $4.49 in Q1 FY2026.
- FY2024 revenue included about $2,080 million of nuclear tax credits, which fell to about $320 million in FY2025, with no material amount in the first half of 2026.
- Operating cash flow minus capital spending was minus $968 million in the first half of FY2026, after capital spending of $2,521 million.
- Q2 FY2026 net income was $513 million, down from $839 million a year earlier, on 360 million diluted shares against 314 million.
10What to watch next
What should you watch next at Constellation?
Next event
Q3 FY2026 results
Date not announced yet.
Plant sales and debt
The sales of five PJM plants for $5.0 billion and Brazos Valley for $860 million were expected in the Q2 FY2026 10-Q to close by the end of 2026. Borrowings were $24,700 million on Jun 30, 2026.
2026 guidance
Constellation said on Aug 6, 2026 that it expects 2026 adjusted operating earnings of $11.50 to $12.50 per share; the first two quarters were $2.74 and $2.55. GAAP diluted EPS was $4.49 and $1.42.
Crane restart
The company said on Aug 6, 2026 that it is moving toward restarting the about 835 MW Crane plant in 2027, to supply Microsoft under a 20-year contract.
Nuclear output
The nuclear capacity factor was 93.0% in Q2 FY2026, against 94.8% a year earlier, with 86 planned refueling outage days.
11Key dates
What are the key dates for Constellation?
| Event | Date | Source |
|---|---|---|
| Lock-up ends for the remaining shares issued for CalpineHalf of the shares issued to Calpine's former owners were released from lock-up on Jun 30, 2026; the rest are scheduled for release on Jun 30, 2027. | Form 10-Q, Q2 2026 (quarter ended Jun 30, 2026) |
Learn: IPO lock-up agreements: what they are and when they end
12Key facts
Key facts about Constellation
- What does Constellation Energy do?
- Constellation Energy generates electricity from nuclear, natural gas, hydro, wind and solar plants and sells power, natural gas and related products to businesses, homes, utilities and power markets across the US. Nuclear plants supplied 68% of Constellation's electricity in 2025, when its FY2025 revenue was $25,533 million and it had 15,339 employees.
- How does Constellation Energy make money, and what is its business model?
- Constellation Energy's business model is selling the power its plants produce, plus power and gas it buys, to customers under contracts and into regional power markets, and keeping the gap over fuel and purchased power. In FY2025 Constellation's revenue was $25,533 million, purchased power and fuel cost $14,681 million, and the remaining $10,852 million paid running costs, depreciation, interest and tax, and with $936 million of other income left $2,319 million of net income.
- Is Constellation Energy profitable?
- Constellation Energy's FY2025 net income was $2,319 million, down from $3,749 million in FY2024, when revenue included about $2,080 million of nuclear production tax credits; FY2025 operating income was $3,086 million. Constellation's Q2 FY2026 net income was $513 million, against $839 million in Q2 FY2025.
- What is Constellation Energy's revenue by segment?
- Constellation Energy reports by power region. In FY2025 Mid-Atlantic revenue was $6,487 million, Midwest $5,804 million, Other Power Regions $5,583 million, New York $2,190 million and ERCOT (Texas) $1,904 million, with $3,565 million not allocated to a region, for a total of $25,533 million. From 2026 Calpine is a sixth segment, with revenue of $4,541 million in the first half of FY2026.
- Who are Constellation Energy's customers?
- Constellation Energy sells to distribution utilities, municipalities, cooperatives, and commercial, industrial, public sector and residential customers. Its FY2025 10-K says Constellation serves about 2 million customer accounts, including about 1.4 million residential customers and three-fourths of Fortune 100 companies. Constellation does not disclose revenue by type of customer.
- Who owns Constellation Energy?
- Constellation Energy's reported 5% holders include Vanguard Capital Management with 6.39% (Schedule 13GA filing by anyone who owns more than 5% of a company's shares and does not seek control. Learn more, as of Mar 31, 2026), and BlackRock with 7.2% and State Street with 5.7% as listed in the 2026 proxy statementThe yearly filing about shareholder votes, the board and executive pay. Learn more from filings made in January 2024. ECP ControlCo, the former owner group of Calpine, held 4.0% on Jun 30, 2026. Constellation's officers and directors as a group held less than 1% on Mar 2, 2026, and Constellation has one class of common stock.
- How big is Constellation Energy's nuclear business?
- Constellation Energy's FY2025 10-K describes about 22 GW of nuclear capacity at 14 stations with 25 reactors in service, which produced 183 TWh in 2025. Constellation's nuclear fleet ran at a 94.7% capacity factor in 2025, and nuclear made up 68% of its electricity supply.
- What is Constellation Energy's retail business?
- Constellation Energy's retail business supplies electricity and natural gas directly to businesses, public bodies and homes. In 2025 Constellation served about 147 TWh of retail electricity load, mainly to commercial and industrial customers, and about 800 Bcf of gas, and renewed 77% of its commercial and industrial power customers.
- What did Constellation Energy buy when it acquired Calpine?
- Constellation Energy completed its acquisition of Calpine on Jan 7, 2026, for total merger consideration of $21,835 million: 50 million new Constellation shares valued at $17,603 million and $4,342 million of cash. Calpine adds about 23 GW of natural gas, geothermal and battery plants after required sales, and about 62 TWh a year of retail load.
Sources (6)
Terms on this page
- Capital expenditures (capex)
- Debt-to-equity
- Earnings per share (EPS)
- EBITDA
- Free cash flow
- Market cap
- Net debt
- Net margin
- P/E ratio
- Revenue vs net income
Each explains the term in plain English, with the same number from other companies on Cityfort.
Go deeper
More detail from the same filings. Open any section.
13What it sells
13What it sells
What does Constellation sell?
Electricity from its own plants
Owned plants supplied 204,944 GWh in 2025, and Constellation bought another 63,999 GWh. Owned generating capacity was 31,676 MW at Dec 31, 2025, before Calpine joined.
Nuclear power
About 22 GW at 14 stations with 25 reactors in service, producing 183 TWh in 2025. The company calls it the largest nuclear fleet in the US.
Retail power and gas supply
Contracts to supply electricity and gas to businesses, public bodies and homes: about 147 TWh of retail power load and about 800 Bcf of gas in 2025. Commercial and industrial contracts average about two years.
Wholesale supply to utilities
Power sold to distribution utilities, municipalities and cooperatives, including through utilities' load auctions. Output beyond its contracts is sold into the regional grid markets where the plants sit.
Long-term clean power contracts
20-year contracts with Microsoft for the output of the Crane Clean Energy Center (Sep 2024) and with Meta for Clinton from June 2027 (Jun 2025), plus 920 MW of new 15 to 20 year contracts signed in Q2 FY2026, including 176 MW with Walmart.
Gas, geothermal and battery plants from Calpine
About 23 GW across 72 generation and battery storage sites added on Jan 7, 2026, after required sales. The Calpine segment had revenue of $4,541 million in the first half of FY2026.
What it does
- Does: Runs nuclear, natural gas, hydro, wind and solar plants and sells their output.
- Does: Buys power and gas from others to meet its supply contracts.
- Does: Signs multi-year power contracts with large companies such as Microsoft, Meta and Walmart.
- Does: Uses hedges to lock in prices ahead, which puts unrealized gains and losses in its reported results.
What it does not do
- Does not: Own local power lines: Constellation is the competitive generation and customer-facing business that Exelon separated from its group in 2022.
- Does not: Belong to Exelon: Exelon distributed all Constellation shares to its stockholders on Feb 1, 2022.
- Does not: Include Calpine in its FY2025 figures: that deal closed on Jan 7, 2026.
14How the money flows
14How the money flows · FY2025
How does money flow through Constellation?
Money in
- Operating revenues$25.5B
- Other income, net (moves with decommissioning trust fund returns)$936M
The company
Constellation
$26.5B came in
Money out
- Purchased power and fuel$14.7B
- Operating and maintenance$6.2B
- Depreciation and amortization$985M
- Interest expense, net$511M
- Income tax ($1,187M) and other taxes ($622M)$1.8B
- Minority partners' share ($4M) and affiliate losses ($1M)$5M
- Net income attributable to common shareholders$2.3B
- Customers and power markets paid Constellation $25,533 million in FY2025.
- Fuel and power bought from others cost $14,681 million, leaving $10,852 million.
- Running and maintaining the plants and business cost $6,159 million, depreciation $985 million and other taxes $622 million, leaving operating income of $3,086 million.
- Other income of $936 million, which moves with decommissioning trust fund returns, came in and net interest of $511 million went out.
- After income tax of $1,187 million, net income for common shareholders was $2,319 million.
15What it needs to run
15What it needs to run
What does Constellation need to run?
Power plants
Owned generating capacity of 31,676 MW at Dec 31, 2025, before Calpine, plus 4,798 MW under contract. Property, plant and equipment was $41,228 million on Jun 30, 2026, up from $22,474 million at Dec 31, 2025, after Calpine joined.
Nuclear operating licenses
Each reactor needs a license from the Nuclear Regulatory Commission (NRC). In Q2 FY2026 Constellation applied to extend the Ginna and Nine Mile Point Unit 1 licenses to 2049.
Decommissioning trust funds
Money set aside to dismantle nuclear plants when they close: $19,336 million at Dec 31, 2025, against asset retirement obligations of $13,193 million.
People
15,339 employees at Dec 31, 2025, with more than 2,100 hired in 2025. Calpine added about 2,500.
Investment-grade credit ratings
Senior unsecured ratings of BBB+ at S&P and Baa1 at Moody's on Jun 30, 2026. A downgrade below investment grade would require about $3.4 billion of extra collateral.
16Where growth could come from
16Where growth could come from
Where could Constellation's growth come from?
Constellation said in its Q2 2026 earnings release (Aug 6, 2026) that it expects 2026 adjusted (non-GAAP) operating earnings of $11.50 to $12.50 per share, up from the $11.00 to $12.00 range it gave on Mar 31, 2026. Its Mar 31, 2026 outlook presentation said "Base EPS growth of 20%+ from 2026-2029". Adjusted operating earnings and Base EPS are company measures.
Calpine
New$4,541M Calpine segment revenue, first half FY2026
Calpine joined on Jan 7, 2026, adding about 23 GW of gas, geothermal and battery plants after required sales and about 62 TWh a year of retail load. Its segment RNF was $2,153 million in the first half.
Status: New, recently announced.
Long-term contracts with large companies
Working920 MW of new contracts, Q2 FY2026
Contracts of 15 to 20 years starting from 2029 to 2032, including 176 MW with Walmart that supports a 30 MW expansion at Dresden. They add to the Microsoft and Meta contracts signed in 2024 and 2025.
Status: Working, on track against what the company said.
Crane restart
EarlyAbout 835 MW, restart targeted for 2027
The former Three Mile Island Unit 1, to supply Microsoft under a 20-year contract. In Q2 FY2026 the NRC approved its fuel license request and FERC granted a waiver to transfer grid connection rights to it.
Status: Early, too early to judge.
Longer licenses and uprates
EarlyGinna and Nine Mile Point 1 to 2049
License renewal applications filed in Q2 FY2026 would extend both units by 20 years. Clinton gets a 30 MW uprate under the Meta contract.
Status: Early, too early to judge.
Nuclear production tax credit
BehindAbout $320M in FY2025, from about $2,080M
The federal credit phases out as a plant's gross receipts per MWh rise above set thresholds. No material benefit was recorded in the first half of 2026.
Status: Behind, behind the company's own plan.
Status compares progress with what the company itself said it would do: Working = on track against what the company said; Mixed = partly on track; Behind = behind the company's own plan; New = recently announced; Early = too early to judge.
17The company's own measures (non-GAAP)
17The company's own measures · FY2024 to Q2 FY2026, as each row says
What do Constellation's own measures show?
Official (GAAP): Net income attributable to common shareholders, FY2025
$2.3B
Company's own measure: Adjusted (non-GAAP) operating earnings, FY2025
$2.9B
Constellation's measure leaves out unrealized gains and losses on economic hedges ($709 million in the FY2025 reconciliation), decommissioning-related items and acquisition costs, among other items.
Official (GAAP): Diluted earnings per share, FY2025
$7.40
Company's own measure: Adjusted operating earnings per share, FY2025
$9.39
Same definition, on 314 million average diluted shares.
Official (GAAP): Diluted earnings per share, FY2024
$11.89
Company's own measure: Adjusted operating earnings per share, FY2024
$8.67
GAAP earnings were higher in FY2024 because they include unrealized hedge gains, which took $3.25 a share off the adjusted figure.
Official (GAAP): Diluted earnings per share, Q1 FY2026
$4.49
Company's own measure: Adjusted operating earnings per share, Q1 FY2026
$2.74
The measure took out $2.03 a share of unrealized hedge gains, plus decommissioning gains, and added back Calpine contract amortization and merger and integration costs.
Official (GAAP): Diluted earnings per share, Q2 FY2026
$1.42
Company's own measure: Adjusted operating earnings per share, Q2 FY2026
$2.55
The measure added back $0.94 a share of unrealized hedge losses, plus Calpine contract amortization and merger and integration costs, and took out decommissioning gains. It was $1.91 in Q2 FY2025.
Official (GAAP)
No official figure measures this; it is the company's own operating measure.
Company's own measure: Nuclear capacity factor, 2025
94.7%
Electricity the nuclear fleet produced as a share of what it could produce running all year, at Constellation's ownership share. It was 94.6% in 2024 and 94.4% in 2023.
These are the company's own measures, defined by the company. They are not comparable across companies, and they are not added together. Each sits beside the nearest official (GAAP) figure.
Learn: Non-GAAP measures: what a company's "adjusted" numbers leave out
18Financial strength and debt
18Financial strength · Jun 30, 2026
How much debt does Constellation have?
- Total debt$24.7B
- Cash and investments$697M
- Net debt (debt minus cash)$24.0B
- Net worth (shareholders' money)$32.0B
- Debt to equity
- 0.77×
- $ of debt for every $1 of shareholders' money
- Total debt is short-term borrowings ($5,226 million), long-term debt due within a year ($363 million) and long-term debt ($19,111 million); net debt of $24,003 million is total debt minus cash and cash equivalents (Cityfort calculation from the Q2 FY2026 10-Q). Operating leases and restricted cash ($380 million) are left out.
- Debt to equity of 0.77 uses shareholders' equity of $31,977 million (Cityfort calculation from the Q2 FY2026 10-Q). Equity rose from $14,517 million at Dec 31, 2025, mainly because 50 million new shares valued at $17,603 million were issued for Calpine.
- Goodwill rose from $420 million at Dec 31, 2025 to $11,527 million on Jun 30, 2026.
- Plants held for sale were $5,743 million on Jun 30, 2026. Constellation has agreed to sell five PJM plants to LS Power for $5.0 billion and the Brazos Valley plant for $860 million, both before closing adjustments.
- On Jun 30, 2026, $7.0 billion was available under credit facilities. A downgrade below investment grade would require about $3.4 billion of extra collateral.
- Nuclear decommissioning trust funds of $19,336 million and asset retirement obligations of $13,193 million at Dec 31, 2025 are large items outside debt.
19Who owns it
19Who owns it · ownership as of Mar 2, 2026
Who owns Constellation?
- Officers and directors (as a group), shares
- 0.3%
Share classes
Holders of 5% or more
From the company's proxy statement (DEF 14A), later Schedule 13G filings and the share counts on its latest annual or quarterly report. Each holder row shows the date of its own filing.
Insider trades · Form 4 data as of Nov 6, 2026
What did Constellation's insiders report trading?
Constellation's insiders made 32 Form 4A filing an insider must make within two business days of buying or selling the company's shares. Learn more filings in the 12 months to Nov 6, 2026.
They reported 1 purchase (1,500 shares) and no sales in the open market or privately (codes P and S).
The same filings report 38 other share transactions (A: 12, F: 9, M: 9, D: 8).
They also report 45 transactions in options, stock units or other derivatives.
Insiders are a company's officers, directors and owners of more than 10% of a class of its shares. Most changes in their holdings must be reported to the SEC on a Form 4 within two business days. Source: SEC Form 4 filings on EDGAR.
- P
- a purchase in the open market or privately
- S
- a sale in the open market or privately
- A
- a grant, award or other acquisition from the company under Rule 16b-3
- D
- shares handed back to the company under Rule 16b-3
- F
- shares withheld or handed over to pay an exercise price or tax when an award is received, exercised or vests
- M
- exercise or conversion of an option or other derivative, exempt under Rule 16b-3
Code meanings: General Instruction 8 of Form 4 (SEC).
The latest 25 of 39 transactions
Shares: A = acquired, D = disposed of. A price the filing gives only in a footnote shows as “See filing”. The 10b5-1 box is checked when at least one trade on the form was made under a Rule 10b5-1 plan. A Form 4/A replaces the form it amends. See all of Constellation's Form 4 filings on EDGAR.
Learn: How to read a proxy statement (DEF 14A): Nvidia's 2026 proxy · Form 4 insider filings: who files, the codes and the footnotes · Rule 10b5-1 trading plans: how insiders pre-schedule their trades
Sources (8)
- Form 10-Q, Q2 2026 (quarter ended Jun 30, 2026)
- Form 10-K, fiscal year 2025 (ended Dec 31, 2025)
- Schedule 13G, Vanguard Capital Management LLC (event Mar 31, 2026)
- Schedule 13G/A, The Vanguard Group (internal realignment, 0 shares; event Mar 13, 2026)
- 2026 proxy statement (DEF 14A)
- Schedule 13G/A, ECP ControlCo, LLC (event Jun 30, 2026)
- Schedule 13G, ECP ControlCo, LLC (event Jan 7, 2026)
- Schedule 13G/A, Capital International Investors (event Mar 31, 2026)
20What it does with profit
20What it does with profit
What does Constellation do with its profit?
Dividend per share
$1.55FY2025
Dividend paid for each share, by financial year.
$ per share
See the numbers
Buyback · Dec 31, 2023
Common stock repurchased in FY2023.
$992M
Buyback · Dec 31, 2024
Common stock repurchased in FY2024.
$999M
Buyback · Dec 31, 2025
Common stock repurchased in FY2025.
$400M
Buyback · Jun 30, 2026
Common stock repurchased in the first half of FY2026: 7.1 million shares, including 2 million bought from the June 2026 secondary offering by former Calpine owners.
$2.0B
Money raised · Jan 7, 2026
About 50 million new shares issued to Calpine's owners as part of the purchase price, valued at the Jan 6, 2026 closing price; no cash was raised.
$17.6B
Money raised · Jun 30, 2026
Long-term debt issued in the first half of FY2026, while $5,352 million of long-term debt was repaid.
$5.0B
21Governance signals
21Governance signals
What do Constellation's governance filings show?
- Auditor
- PricewaterhouseCoopers LLP, since 2001
- Auditor changes
- None in the period covered
- Audit qualifications
- None reported
- Related-party dealings
- The 2026 proxy says no related person transactions were identified in 2025. Its governance committee reviews any transaction over $120,000 with a director, executive officer, their family or a 5% holder.
- Credit rating
- S&P Global Ratings and Moody's (as stated in the Q2 FY2026 10-Q) BBB+ (S&P) / Baa1 (Moody's), senior unsecured (Not stated in the company's filings; the company's 2026 outlook presentation says both agencies affirmed these ratings after the Calpine deal closed), Jun 30, 2026
A credit rating describes the company's ability to repay debt. It is not a rating of the share.
Flags to know about
disclosure · Feb 1, 2022
FY2021 is the business before separation from Exelon
FY2021 figures are those of the predecessor under Exelon, with $1,188 million of revenue from Exelon companies and no earnings per share. FY2021 depreciation of $3,003 million includes accelerated depreciation from a plan to close Byron and Dresden early, reversed on Sep 15, 2021.
disclosure · Jan 7, 2026
Calpine breaks comparisons from 2026
Quarters from Q1 FY2026 include Calpine, which the FY2025 10-K figures exclude, and Calpine is reported as a sixth segment. Average diluted shares rose from 313 million in Q4 FY2025 to 360 million in Q2 FY2026.
disclosure · Dec 31, 2024
Receivables facility shaped cash flow until 2024
Until the facility was amended on Dec 31, 2024, cash collected on the deferred purchase price of sold receivables was recorded in investing activities ($3,902 million in FY2021 to $10,217 million in FY2024), making operating cash flow negative in those years.
disclosure · Dec 31, 2025
What the EBITDA figures include
EBITDAOperating profit before wear-and-tear charges (depreciation and amortization). As a margin: per $100 of sales. on this page adds the cash flow statement's depreciation and amortization line to operating income. That line also includes nuclear fuel amortization, which the income statement counts as a fuel cost, and the accretion of asset retirement obligations, so FY2025 EBITDA is $5,687 million against $4,071 million using the income statement's $985 million of depreciation and amortization (Cityfort calculation from the FY2025 10-K).
regulatory · Aug 6, 2026
Plant sales required to complete the Calpine deal
The Q2 FY2026 10-Q says the resolution with the Department of Justice requires the sale of five PJM plants, one ERCOT plant and the Gregory Power Plant interest. The Gregory interest was sold in January 2026; the other sales await approvals.
disclosure · Mar 19, 2026
Proxy ownership percentages use an older share count
The 2026 proxy computes holders' percentages on 313,309,685 shares, while the same proxy gives 362,294,672 shares at the Mar 4, 2026 record date. This page shows each holder's percentage as filed, with its filing date.
Sources (8)
- Form 10-K, fiscal year 2025 (ended Dec 31, 2025)
- 2026 proxy statement (DEF 14A)
- Form 10-Q, Q2 2026 (quarter ended Jun 30, 2026)
- 2026 Business and Earnings Outlook presentation (8-K Exhibit 99.1, filed Mar 31, 2026)
- Form 10-K, fiscal year 2023 (ended Dec 31, 2023)
- Form 10-K, fiscal year 2022 (ended Dec 31, 2022)
- Q4 and full-year 2025 earnings release (8-K Exhibit 99.1)
- Q2 2026 earnings release (8-K Exhibit 99.1)
22What the market paid
22What the market paid · price as of Nov 5, 2026
What did the market pay for Constellation on Nov 5, 2026?
Price as of Nov 5, 2026 (shown for education; prices change daily).
Price as of Nov 5, 2026: a $239.65 close, from Nasdaq's historical price table; Constellation is listed on Nasdaq. Market value = $239.65 × 354,307,379 shares (10-Q cover, Jul 31, 2026) = $84,910 million (Cityfort calculation from the Nov 5, 2026 Nasdaq closing price and the Q2 FY2026 10-Q). P/E is the price divided by earnings per share: $239.65 ÷ $10.26, the diluted earnings per share of Q3 FY2025 to Q2 FY2026, gives 23.4 (Cityfort calculation from the Q3 FY2025 to Q2 FY2026 earnings releases). Those earnings include unrealized hedge gains and losses and decommissioning trust returns, and Calpine only from Jan 7, 2026.
- Share price
- $239.65
- Market value (market cap)
- $84.9B
- P/E
- 23.4×
More price-based ratios · as of Nov 5, 2026
Each ratio divides a number from the company's filings by the market value or share price on Nov 5, 2026. Prices change daily, so these ratios do too.
Price to sales (P/S)
2.7×
$84.9B market value ÷ $31.3B revenue (four quarters to Jun 30, 2026) = 2.7×
Cityfort calculation from the Nov 5, 2026 closing price and the Q3 FY2025 to Q2 FY2026 10-Qs and earnings releases. Source: CEG historical prices, Oct 26 to Nov 5, 2026 (Nasdaq historical table; CEG is listed on Nasdaq); Form 10-Q, Q2 2026 (quarter ended Jun 30, 2026); Q3 2025 earnings release (8-K Exhibit 99.1) and 4 more
How price ratios workDividend yield
0.65%
$1.55 dividends per share (FY2025) ÷ $239.65 share price = 0.65%
Cityfort calculation from the FY2025 10-K and the Nov 5, 2026 closing price. Source: CEG historical prices, Oct 26 to Nov 5, 2026 (Nasdaq historical table; CEG is listed on Nasdaq); Form 10-Q, Q2 2026 (quarter ended Jun 30, 2026); Q3 2025 earnings release (8-K Exhibit 99.1) and 4 more
What dividend yield meansFree cash flow yield
1.5%
$1.3B free cash flow (FY2025) ÷ $84.9B market value = 1.5%
Cityfort calculation from the FY2025 10-K and the Nov 5, 2026 closing price. Source: CEG historical prices, Oct 26 to Nov 5, 2026 (Nasdaq historical table; CEG is listed on Nasdaq); Form 10-Q, Q2 2026 (quarter ended Jun 30, 2026); Q3 2025 earnings release (8-K Exhibit 99.1) and 4 more
What free cash flow means
Shares used for the market value: 354.31 million ($239.65 × 354.31 million shares ≈ $84.9B). Source: Form 10-Q, Q2 2026 (quarter ended Jun 30, 2026); Form 10-K, fiscal year 2025 (ended Dec 31, 2025)
Source: CEG historical prices, Oct 26 to Nov 5, 2026 (Nasdaq historical table; CEG is listed on Nasdaq); Form 10-Q, Q2 2026 (quarter ended Jun 30, 2026); Q3 2025 earnings release (8-K Exhibit 99.1) and 3 more
Sources (8)
- CEG historical prices, Oct 26 to Nov 5, 2026 (Nasdaq historical table; CEG is listed on Nasdaq)
- Form 10-Q, Q2 2026 (quarter ended Jun 30, 2026)
- Q3 2025 earnings release (8-K Exhibit 99.1)
- Q4 and full-year 2025 earnings release (8-K Exhibit 99.1)
- Q1 2026 earnings release (8-K Exhibit 99.1)
- Q2 2026 earnings release (8-K Exhibit 99.1)
- Form 10-Q, Q1 2026 (quarter ended Mar 31, 2026)
- Form 10-K, fiscal year 2025 (ended Dec 31, 2025)
23How it got here
23How it got here
How did Constellation get here?
2021
Crisis
Byron and Dresden closures reversed
A 2020 plan to retire the Byron and Dresden nuclear plants early was reversed on Sep 15, 2021; the accelerated depreciation it caused weighed on FY2021 results.
2022
Business-model change
Separated from Exelon
Exelon split off its competitive generation and customer-facing businesses, completing the distribution of all Constellation shares on Feb 1, 2022.
2023
Milestone
Stake in South Texas Project
Constellation bought 44% of the South Texas Project, a 2,645 MW two-unit nuclear plant, on Nov 1, 2023, for net cash of $1.65 billion.
2024
Milestone
Nuclear tax credit and the Microsoft contract
The federal nuclear production tax credit began in 2024, adding about $2,080 million to FY2024 revenue. In September 2024 Constellation signed a 20-year contract with Microsoft for the output of the restarted Crane plant.
2025
Milestone
Meta contract for Clinton
In June 2025 Constellation signed a 20-year contract with Meta for Clinton's output from June 2027, including a 30 MW uprate.
2026
Business-model change
Calpine acquired
On Jan 7, 2026 Constellation completed the purchase of Calpine for total consideration of $21,835 million, adding about 23 GW of gas, geothermal and battery plants after required sales.
2026
Milestone
Plant sales agreed
Constellation agreed in March 2026 to sell five PJM plants to LS Power for $5.0 billion, and in August 2026 the Brazos Valley plant for $860 million, both before adjustments.
24Sources and changes
Where every number on this page comes from
Sources (21 documents)
- S1Form 10-K, fiscal year 2025 (ended Dec 31, 2025) · Constellation Energy Corporation (SEC EDGAR) · Tier 1: company or exchange filing · Feb 24, 2026
- S2Form 10-K, fiscal year 2023 (ended Dec 31, 2023) · Constellation Energy Corporation (SEC EDGAR) · Tier 1: company or exchange filing · Feb 27, 2024
- S3Form 10-K, fiscal year 2022 (ended Dec 31, 2022) · Constellation Energy Corporation (SEC EDGAR) · Tier 1: company or exchange filing · Feb 16, 2023
- S4Form 10-Q, Q2 2026 (quarter ended Jun 30, 2026) · Constellation Energy Corporation (SEC EDGAR) · Tier 1: company or exchange filing · Aug 6, 2026
- S5Form 10-Q, Q1 2026 (quarter ended Mar 31, 2026) · Constellation Energy Corporation (SEC EDGAR) · Tier 1: company or exchange filing · May 11, 2026
- S6Q3 2024 earnings release (8-K Exhibit 99.1) · Constellation Energy Corporation (SEC EDGAR) · Tier 1: company or exchange filing · Nov 4, 2024
- S7Q4 and full-year 2024 earnings release (8-K Exhibit 99.1) · Constellation Energy Corporation (SEC EDGAR) · Tier 1: company or exchange filing · Feb 18, 2025
- S8Q1 2025 earnings release (8-K Exhibit 99.1) · Constellation Energy Corporation (SEC EDGAR) · Tier 1: company or exchange filing · May 6, 2025
- S9Q2 2025 earnings release (8-K Exhibit 99.1) · Constellation Energy Corporation (SEC EDGAR) · Tier 1: company or exchange filing · Aug 7, 2025
- S10Q3 2025 earnings release (8-K Exhibit 99.1) · Constellation Energy Corporation (SEC EDGAR) · Tier 1: company or exchange filing · Nov 7, 2025
- S11Q4 and full-year 2025 earnings release (8-K Exhibit 99.1) · Constellation Energy Corporation (SEC EDGAR) · Tier 1: company or exchange filing · Feb 24, 2026
- S12Q1 2026 earnings release (8-K Exhibit 99.1) · Constellation Energy Corporation (SEC EDGAR) · Tier 1: company or exchange filing · May 11, 2026
- S13Q2 2026 earnings release (8-K Exhibit 99.1) · Constellation Energy Corporation (SEC EDGAR) · Tier 1: company or exchange filing · Aug 6, 2026
- S142026 Business and Earnings Outlook presentation (8-K Exhibit 99.1, filed Mar 31, 2026) · Constellation Energy Corporation (SEC EDGAR) · Tier 1: company or exchange filing · Mar 31, 2026
- S162026 proxy statement (DEF 14A) · Constellation Energy Corporation (SEC EDGAR) · Tier 1: company or exchange filing · Mar 19, 2026
- S17Schedule 13G, ECP ControlCo, LLC (event Jan 7, 2026) · SEC EDGAR (filed by the holder) · Tier 1: company or exchange filing · Jan 14, 2026
- S18Schedule 13G/A, ECP ControlCo, LLC (event Jun 30, 2026) · SEC EDGAR (filed by the holder) · Tier 1: company or exchange filing · Aug 7, 2026
- S19Schedule 13G, Vanguard Capital Management LLC (event Mar 31, 2026) · SEC EDGAR (filed by the holder) · Tier 1: company or exchange filing · Apr 29, 2026
- S20Schedule 13G/A, Capital International Investors (event Mar 31, 2026) · SEC EDGAR (filed by the holder) · Tier 1: company or exchange filing · May 14, 2026
- S22Schedule 13G/A, The Vanguard Group (internal realignment, 0 shares; event Mar 13, 2026) · SEC EDGAR (filed by the holder) · Tier 1: company or exchange filing · Mar 26, 2026
- S23CEG historical prices, Oct 26 to Nov 5, 2026 (Nasdaq historical table; CEG is listed on Nasdaq) · Nasdaq, Inc. · Tier 1: company or exchange filing · Nov 5, 2026
Changes to this page (v1 · Nov 6, 2026)
- v1 · Nov 6, 2026First version, through Q2 FY2026 (quarter ended Jun 30, 2026). (first version)
Numbers come only from tier 1 and tier 2 sources. Read how we research.
Disclaimer
For learning only. Cityfort is not a registered investment adviser or broker-dealer and does not recommend buying or selling any security. Prices shown are dated and may be out of date.
Investing in securities involves risk, including loss of capital. Before making any investment decision, do your own research and consider consulting a registered investment adviser or other qualified professional.
Cityfort, its owners and contributors may or may not hold securities of companies covered. Cityfort is not paid by any company it covers. Content is not an offer or solicitation to buy or sell any security, including in any initial public offering.
Read the positions policyRead the full disclaimerHide the full disclaimer
Cityfort publishes general educational content that explains how listed companies work. Cityfort is not registered with the US Securities and Exchange Commission or any state securities regulator as an investment adviser, and is not a broker-dealer or a member of FINRA. Cityfort does not provide investment, tax or legal advice, recommendations, ratings, price targets or any opinion on whether to buy, sell or hold any security. Nothing on the site is tailored to any person's circumstances.
All information is taken from publicly available sources, mainly company filings with the SEC, which are listed on each page with dates. We work to keep it accurate and correct errors publicly, but we do not guarantee that it is complete, accurate or up to date. Any market price or price-based ratio shown is dated, may be out of date by the time you read it, and is included only to explain concepts.
Statements by company management, including forward-looking statements and guidance, are reported as the company's statements, with their date and source; they are not our forecasts. Adjusted (non-GAAP) figures are the company's own measures and are shown next to the official (GAAP) figures.