Industrials · NYSE: URI
United Rentals: how the business works
United Rentals rents out construction and industrial equipment, from lifts and loaders to generators and pumps, at 1,768 locations, mostly in the US. Its FY2025 revenue was $16.1 billion.
By Hardik Bhandare · Checked against filings: . Editorial policy. Corrections
Follow United Rentals
Email me when United Rentals's page is updated after earnings.
We'll send a confirmation email first. See our privacy policy.
United Rentals, Inc. · Stamford, Connecticut · Founded 1997
Updated for Q3 FY2026 · checked
- Revenue, FY2025
- $16.1B
- Net income, FY2025
- $2.49B
- Rental locations, Jan 1, 2026
- 1,768
- Employees, end of FY2025
- About 28,500
- Incorporated
- 1997
The short version
United Rentals in 5 points
1 · What it sells
United Rentals rents construction and industrial equipment, from lifts and loaders to generators, pumps and mobile storage, and equipment rentals brought in $13,806 million of its $16,099 million FY2025 revenue.
2 · Who pays it
Customers in the US paid 91.1% of United Rentals' FY2025 revenue and customers outside the US, mainly in Canada, paid 8.9%; the 10-K does not split revenue by customer type.
3 · What it keeps from $100
Of every $100 that came in during FY2025, United Rentals kept $15.41 as net income, which includes a $64M break-up fee from the ended H&E merger, while operating income was $3,973 million.
4 · Where the operating profit comes from
The 10-K gives no operating income by segment; in FY2025 General rentals brought in $11,001 million at a 35.2% equipment rentals gross margin, and Specialty $5,098 million at 43.6%.
5 · The one thing to watch
In its Oct 21, 2026 release, management raised its FY2026 total revenue outlook to $18.0 billion to $18.2 billion; revenue for the first nine months of FY2026 was $13,288M.
Sources: From United Rentals' FY2025 10-K, the Q3 FY2026 10-Q and the Q3 FY2026 earnings release · checked
01Where the money goes · FY2025
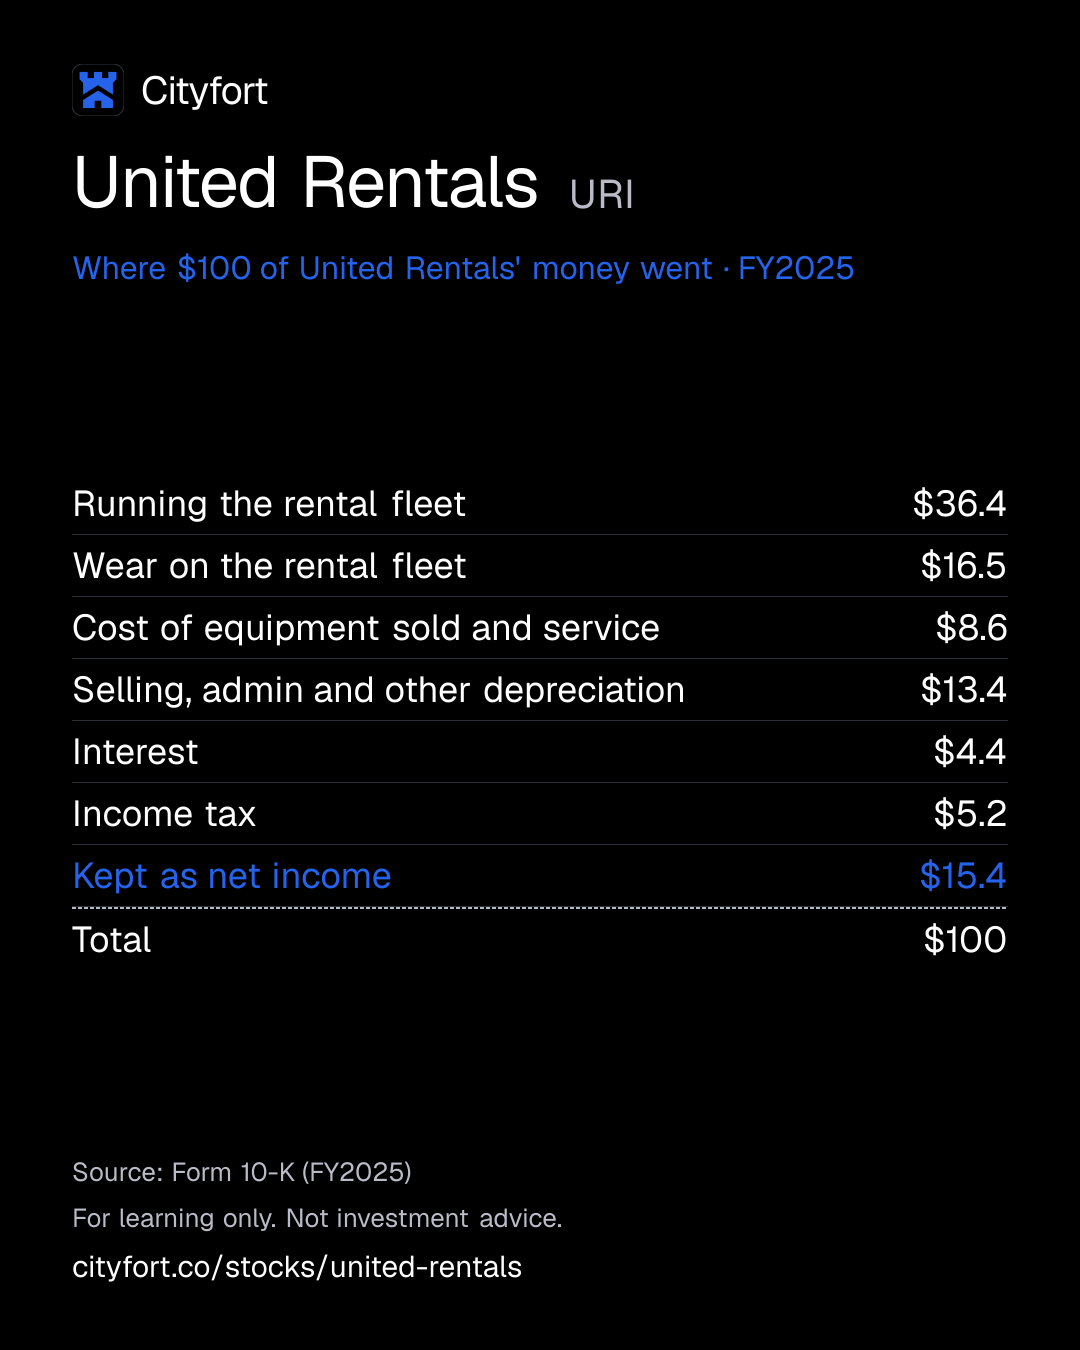
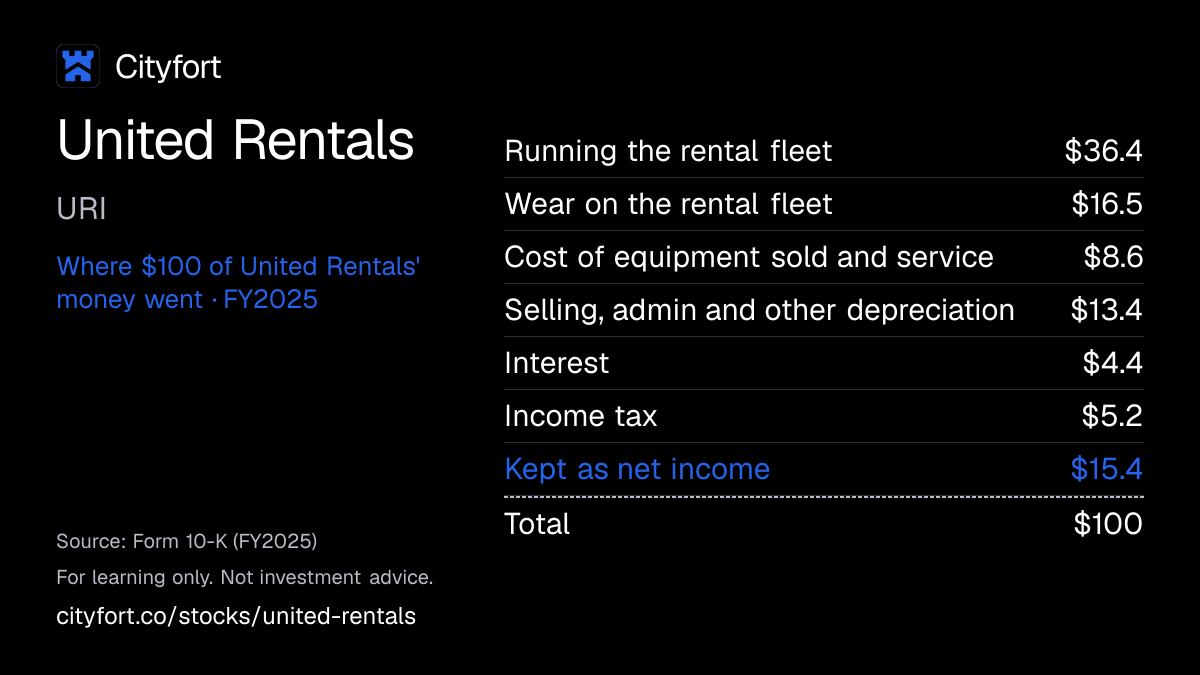
Where does $100 of United Rentals' money go?
United Rentals · FY2025
Receipt for every $100
| Running the rental fleet | $36.4 |
|---|---|
| Wear on the rental fleet | $16.5 |
| Cost of equipment sold and service | $8.6 |
| Selling, admin and other depreciation | $13.4 |
| Interest | $4.4 |
| Income tax | $5.2 |
| Kept as net income | $15.4 |
| Total | $100 |
Each line = amount ÷ total money in × 100. Lines may not add to exactly $100 because of rounding.
How this is worked out
Cityfort calculation from the FY2025 10-K. Of every $100 that came in during FY2025: each line = line ÷ $16,180 million × 100 (revenue $16,099 million + other income $81 million).
Save this receipt as an image
Embed this receipt or the key numbers
Paste this code into a blog or website to show the card you choose, with a link back to this page.
Each week: the next company due to report earnings, explained in 5 points.
No tips. Unsubscribe anytime.
We'll send a confirmation email. See our privacy policy.
02The business in one line
What does United Rentals do?
Builders, factories and towns pay United Rentals to use its machines for days or months. Most of that money goes on running and wearing out the fleet; $15.41 of every $100 that came in during FY2025 was left as net income.
- Equipment rentals brought in $13,806M of the $16,099M FY2025 revenue; selling used machines added $1,413M.
- Customers in the US paid 91.1% of FY2025 revenue, and the largest single customer was about 1%.
03Who pays it
Who pays United Rentals?
United Rentals does not disclose how much each type of customer pays.
Construction companies
Builders of commercial buildings, warehouses, factories, office parks, airports and homes.
Industrial companies
Manufacturers, chemical companies, paper mills, railroads, ship builders and utilities, for plant upkeep, upgrades and expansion.
Municipalities
Towns and cities that need equipment for many kinds of public work.
Homeowners and individuals
People renting for projects from simple repairs to major renovations.
Where its revenue came from · FY2025
- United States91.1%
- Outside the US (mainly Canada)8.9%
How spread out the customers are
The largest customer was about 1% and the top 10 customers about 5% of FY2025 revenue. Key accounts (customers it manages centrally) gave 69% of FY2025 rental revenue, and national accounts 46%. The 10-K does not split revenue by customer type.
- Largest customer
- 1%
- Top 10 customers
- 5%
Sources (1)
04How it makes money
How does United Rentals make money?
It earns rent on the same machine many times, then sells it used.
A machine is bought once and rented out again and again over several years. Rent comes in only while the machine is out on a job, but it loses value either way. When it ages, it is sold, and the cash helps pay for new machines.
Net income per $100 of revenue
$14.3$15.5
FY2021 to FY2025
- Buy machines (FY2025: $4,149M of rental equipment)
- Rent them out from 1,768 locations
- Deliver, pick up and repair them
- Sell older machines used ($1,413M in FY2025)
- Use that cash and new borrowing to buy more
↺ Step 5 feeds back into step 1.
05Business segments · FY2025
Which businesses make up United Rentals?
General rentals
68.3%Everyday construction and industrial equipment and tools. Its equipment rentals gross margin was 35.2% in FY2025.
Revenue $11.0B ($11,001M)
Specialty
31.7%Power and heating or cooling, fluid solutions, trench safety, mobile storage and ground mats. Its equipment rentals gross margin was 43.6% in FY2025.
Revenue $5.1B ($5,098M)
How the mix changed
- General rentals
- Specialty
Revenue by segment, FY2021 to FY2025.
US$
See the numbers
06The numbers · Consolidated · US$
How has United Rentals done?
Revenue
$16.1BFY2025
Revenue rose every year, from $9,716M in FY2021 to $16,099M in FY2025, and Q3 FY2026 revenue of $4,893M was 15.7% above Q3 FY2025.
US$
See the numbers
Net income
$2.5BFY2025
Net income grew from $1,386M in FY2021 to $2,575M in FY2024, then fell to $2,494M in FY2025.
US$
See the numbers
Net income for every $100 of revenue
$15.5FY2025
Net income was $15.5 of every $100 of revenue in FY2025, down from $18.1 in FY2022.
Net margin: $ of net income per $100 of revenue
See the numbers
Free cash flow
$662MFY2025
Capex in every year here is the 10-K's cash-flow purchases of rental and non-rental equipment (FY2025: $4,149M and $379M), so FY2025 free cash flow is $662M; the company's own measure adds back $1,519M of equipment sale and insurance proceeds.
US$ · cash from operations minus spending on plants and equipment
See the numbers
See all yearly numbers
EBITDA here = operating income plus depreciation and amortization (from the cash flow statement). Fiscal years are the company's own: Fiscal year ends Dec 31 (the calendar year). Net income is the share belonging to the company's owners.
Learn: Fiscal years that don't end in December: Nvidia's FY2027 explained · Stock-based compensation and dilution: pay that becomes shares
Sources (15)
- Form 10-K for FY2021
- Form 10-K for FY2022
- Form 10-K for FY2023
- Form 10-K for FY2024
- Form 10-K for FY2025
- Form 10-Q for Q1 FY2024
- Form 10-Q for Q2 FY2024
- Form 10-Q for Q3 FY2024
- Q4 FY2025 earnings release (8-K Ex. 99.1)
- Form 10-Q for Q1 FY2025
- Form 10-Q for Q2 FY2025
- Form 10-Q for Q3 FY2025
- Form 10-Q for Q1 FY2026
- Q2 FY2026 earnings release (8-K Ex. 99.1)
- Form 10-Q for Q3 FY2026
07Who runs it
Who runs United Rentals, and did they deliver?
Matthew J. Flannery
President and Chief Executive Officer · since 2019
CEO and director since May 2019; President since March 2018; Chief Operating Officer from 2012 to 2018.
William E. (Ted) Grace
Executive Vice President and Chief Financial Officer · since 2022
CFO since November 2022 (interim from July 2022); with the company since 2016.
Michael D. Durand
Executive Vice President and Chief Operating Officer · since 2023
COO since September 2023; with the company since 2002.
Michael J. Kneeland
Non-executive Chair · since 2019
Chair since May 2019; CEO from 2008 to 2019.
Gracia C. Martore
Lead Independent Director · since 2017
Director since 2017.
What they said, and what happened
2 delivered · 2 too early to tell
Said on Apr 23, 2025
In April 2025, management gave an FY2025 outlook of total revenue of $15.6 billion to $16.1 billion and adjusted EBITDAOperating profit before wear-and-tear charges (depreciation and amortization). As a margin: per $100 of sales. of $7.2 billion to $7.45 billion.
DeliveredWhat happened
FY2025 total revenue was $16.099 billion and adjusted EBITDA $7.328 billion, both inside the April range.
Said on Oct 22, 2025
In October 2025, management gave an FY2025 free cash flowCash from operations minus spending on buildings and equipment. Learn more outlook of $2.1 billion to $2.3 billion.
DeliveredWhat happened
FY2025 free cash flow was $2.186 billion excluding merger and restructuring payments, as the Q4 FY2025 release states.
Said on Jan 28, 2026
In January 2026, the company said it intends to repurchase $1.5 billion of common stock in 2026, including $1.15 billion under its new $5 billion program; it repeated the $1.5 billion in October 2026.
Too early to tellWhat happened
$1.125 billion was repurchased in the first nine months of FY2026.
Said on Oct 21, 2026
In October 2026, management raised its FY2026 outlook to total revenue of $18.0 billion to $18.2 billion and adjusted EBITDA of $8.3 billion to $8.4 billion.
Too early to tellWhat happened
First nine months of FY2026: revenue $13,288M and adjusted EBITDA $6,146M.
08What could go wrong
What could go wrong for United Rentals?
- Demand
Demand follows construction and industry
The 10-K says its equipment is used mainly for private non-residential construction and industrial work. Past weakness in those markets lowered both demand and the rental rates it earned.
Watch Fleet productivity and rental revenue growth in each quarterly release.
- Competition
A crowded, fragmented market
Rivals range from one-branch independents to national firms and dealers that sell and rent. The 10-K says competition has in the past cut its market share or the prices it could charge.
Watch The company's estimated North American market share (15% in 2025).
- Debt
$14.7 billion of debt
Total debt was $14,671M at Sep 30, 2026, and interest cost $716M in FY2025. The 10-K says it relies on its ABL and receivables facilities for liquidity and may not always refinance on good terms.
Watch Net leverage (1.8x at Sep 30, 2026) and interest expense.
- Raw-material prices
Oil and gas customers
The 10-K says demand from oil and gas companies has fallen in the past when oil and gas prices dropped, and it lists fuel price rises as a risk to its mobile fleet.
Watch Commentary on energy customers in quarterly releases.
- Execution
Buying and absorbing other companies
Much of its past growth came from acquisitions such as General Finance (2021), Ahern Rentals' assets (2022) and Yak (2024). The 10-K warns acquired businesses may not deliver the expected benefits and goodwill may need to be written down.
Watch Goodwill ($7,119M at Dec 31, 2025) and any impairment charge.
- Execution
New risks in the specialty business
The 10-K says its growing specialty segment and onsite services bring new risks, such as spills, system failures and claims about the solutions it provides.
Watch Specialty rental gross margin (47.6% in Q3 FY2026, 43.6% in FY2025).
- Other
Seasons and weather
Demand tends to be lower in winter, and the 10-K says severe weather can disrupt its operations and markets.
Watch Revenue in the January to March quarter, when winter demand tends to be lower.
09Supporters vs. critics
What do supporters and critics point to?
What supporters point to
- Revenue rose every year from $9,716M in FY2021 to $16,099M in FY2025, and Q3 FY2026 revenue of $4,893M was 15.7% above Q3 FY2025.
- Specialty equipment rental revenue was $1,704M in Q3 FY2026, up 34.7% from a year earlier, and the segment's rental gross margin was 47.6%.
- FY2025 revenue of $16.099 billion and adjusted EBITDA (a company measure) of $7.328 billion both fell inside the ranges management gave in April 2025.
- No customer was more than about 1% of FY2025 revenue, and the top 10 customers were about 5%.
- The company repurchased $1.9 billion of shares in FY2025 and raised its quarterly dividend 10% to $1.97 a share on Jan 28, 2026.
What critics point to
- Total debt of $14,671M at Sep 30, 2026 equals about 2.8 years of FY2025 operating cash flow (Cityfort calculation from the Q3 FY2026 10-Q and the FY2025 10-K), and interest cost $716M in FY2025.
- FY2025 net income was $2,494M, down from $2,575M in FY2024, while revenue rose to $16,099M from $15,345M.
- Operating cash flow minus all equipment purchases was $662M in FY2025; the company's own free cash flow of $2,181M adds back proceeds from selling equipment.
- The 10-K says demand comes mainly from private non-residential construction and industrial work, and that past weakness there lowered both demand and rental rates.
- Goodwill from past acquisitions was $7,119M at Dec 31, 2025, and the 10-K warns it may need to be written down if acquired businesses fall short.
10What to watch next
What should you watch next at United Rentals?
Next event
Q4 FY2026 results
Date not announced yet.
The raised FY2026 outlook
On Oct 21, 2026, management raised its FY2026 outlook to revenue of $18.0 billion to $18.2 billion and adjusted EBITDA of $8.3 billion to $8.4 billion. Revenue for the first nine months was $13,288M.
Specialty growth
Specialty rental revenue grew 34.7% in Q3 FY2026, against 8.8% for general rentals. Specialty was 31.7% of FY2025 revenue.
Debt after the new notes
Total debt was $14,671M at Sep 30, 2026. An 8-K filed Oct 29, 2026 then reported new notes of $700M due 2029, $800M due 2031 and $1.0 billion due 2036.
Buybacks against the plan
The company said in October 2026 it expects $1.5 billion of buybacks in 2026; it had repurchased $1.125 billion in the first nine months.
11Key dates
What are the key dates for United Rentals?
| Event | Date | Source |
|---|---|---|
| Quarterly dividend of $1.97 a share paidTo holders of record on Nov 11, 2026. | Q3 FY2026 earnings release (8-K Ex. 99.1) | |
| Fiscal 2026 ends | Form 10-K for FY2025 | |
| Receivables facility expires (extendable)Extended by an 8-K filed Jun 18, 2026; it can be extended on a 364-day basis. | 8-K filed Jun 18, 2026 (receivables facility amendment) |
Learn: Fiscal years that don't end in December: Nvidia's FY2027 explained
12Key facts
Key facts about United Rentals
- What does United Rentals do?
- United Rentals rents construction and industrial equipment, such as aerial work platforms, forklifts, earthmoving machines, generators, pumps, trench safety gear and mobile storage. It had FY2025 revenue of $16,099 million and 1,768 rental locations on Jan 1, 2026, most of them in the US and Canada.
- How does United Rentals make money?
- United Rentals buys machines, rents them out many times over several years, then sells them used. In FY2025, equipment rentals brought in $13,806 million of United Rentals' $16,099 million revenue, used equipment sales $1,413 million, and operating income was $3,973 million.
- Who are United Rentals' customers?
- United Rentals rents to construction companies, industrial companies such as manufacturers and utilities, municipalities and homeowners. Its largest customer was about 1% and its top 10 customers about 5% of FY2025 revenue, and customers in the US paid 91.1% of FY2025 revenue.
- Is United Rentals profitable?
- United Rentals' FY2025 net income was $2,494 million, down from $2,575 million in FY2024, on revenue of $16,099 million. Its Q3 FY2026 net income was $920 million, up from $701 million in Q3 FY2025, on revenue of $4,893 million.
- What are United Rentals' business segments?
- United Rentals reports two segments. In FY2025, General rentals (everyday construction and industrial equipment) brought in $11,001 million and Specialty (power, heating and cooling, fluid solutions, trench safety, mobile storage and ground mats) brought in $5,098 million.
- How much debt does United Rentals have?
- United Rentals had total debt of $14,671 million and cash of $153 million on Sep 30, 2026, as its Q3 FY2026 10-Q reports. Most of its debt is fixed-rate notes due from 2027 to 2034.
- Who owns United Rentals?
- United Rentals has one class of common stock and no controlling holder. The 2026 proxy lists The Vanguard Group with 11.17% and BlackRock with 7.7%, from Schedule 13GA filing by anyone who owns more than 5% of a company's shares and does not seek control. Learn more/A filings made in early 2024. Its executive officers and directors as a group held 0.47% at the Mar 9, 2026 record date (Cityfort calculation from the 2026 proxy statementThe yearly filing about shareholder votes, the board and executive pay. Learn more).
Terms on this page
- Capital expenditures (capex)
- Customer concentration
- Debt-to-equity
- Earnings per share (EPS)
- EBITDA
- Free cash flow
- Net debt
- Net margin
- Revenue vs net income
- Stock buyback
Each explains the term in plain English, with the same number from other companies on Cityfort.
Go deeper
More detail from the same filings. Open any section.
13What it sells
13What it sells
What does United Rentals sell?
General rentals
Backhoes, skid-steer loaders, forklifts, earthmoving machines, aerial work platforms (lifts that raise workers) and general tools. This segment brought in $11,001M in FY2025.
Specialty rentals
Power generators and heating and cooling units, pumps for moving water (fluid solutions), trench safety gear, mobile storage and site offices, and ground mats. This segment brought in $5,098M in FY2025.
Selling used equipment
Machines leave the fleet as they age and are sold. These sales brought in $1,413M in FY2025.
New equipment, supplies and service
Sales of new equipment ($348M), contractor supplies ($163M) and service and other work ($369M) in FY2025.
Think of it like this
It works like a car-rental company for diggers and lifts: it buys a machine once, rents it out many times, then sells it used.
What it does
- Does: Rents equipment from 1,768 locations, mostly in the US and Canada (Jan 1, 2026)
- Does: Delivers and picks up the equipment; delivery and pick-up brought in $1,153M in FY2025
- Does: Gives large customers Total Control, its own software to track all the equipment they rent
What it does not do
- Does not: Does not make the machines; it buys them, and its largest supplier took 11% of FY2025 equipment spending
- Does not: Does not depend on one customer: the largest was about 1% of FY2025 revenue
- Does not: Does not count party and event rentals in its market-share estimate
Sources (1)
14How the money flows
14How the money flows · FY2025
How does money flow through United Rentals?
Money in
- Equipment rentals$13.8B
- Sales of used rental equipment$1.4B
- New equipment, contractor supplies, service and other$880M
- Other income, net (includes the $64M H&E break-up fee)$81M
The company
United Rentals
$16.2B came in
Money out
- Running the rental fleet (labor, repairs, delivery and other, before depreciation)$5.9B
- Wear on the rental fleet (depreciation of rental equipment)$2.7B
- Cost of used, new and supplies sold, and of service work$1.4B
- Selling and admin, restructuring, and other depreciation and amortization$2.2B
- Interest on debt (net)$716M
- Income tax$844M
- Net income$2.5B
- Customers paid United Rentals $16,099M in FY2025, of which $13,806M was rent for equipment.
- Running the fleet cost $5,888M, and wear on the machines (depreciation) took another $2,670M.
- Equipment sold and service work cost $1,397M; selling, admin and other depreciation took $2,171M.
- Interest on debt took $716M, other income added $81M, and income tax took $844M.
- That left $2,494M of net income.
Sources (1)
15What it needs to run
15What it needs to run
What does United Rentals need to run?
A large rental fleet
About 1,095,000 units with an original cost of $22.48 billion at the end of FY2025, an average of 49.5 months old.
Money to buy machines
It spent $4,149M on rental equipment in FY2025, paid for from operating cash and borrowing, including a $4.5 billion revolving credit line (ABL facility).
Equipment suppliers
The largest supplier took 11% and the top 10 took 52% of FY2025 equipment spending. The company says it has alternative sources for each major category.
Branches near job sites
1,768 rental locations on Jan 1, 2026: 1,494 in the US, 169 in Canada, 41 in Europe and 64 in Australia and New Zealand.
People
About 28,500 employees at the end of FY2025, 20,300 of them hourly; collective bargaining agreements cover about 1,800.
Sources (1)
16Where it sells
16Where it sells · FY2025
Where does United Rentals sell?
- United States91.1%
- Outside the US (mainly Canada)8.9%
Sources (1)
17Where growth could come from
17Where growth could come from
Where could United Rentals' growth come from?
In its Oct 21, 2026 release, United Rentals raised its FY2026 outlook to total revenue of $18.0 billion to $18.2 billion (from $17.5 billion to $17.8 billion) and adjusted EBITDA of $8.3 billion to $8.4 billion. It kept its free cash flow outlook, excluding restructuring payments, at $2.15 billion to $2.45 billion.
Specialty rentals
Working+34.7% rental revenue, Q3 FY2026
Specialty equipment rental revenue was $1,704M in Q3 FY2026, up 34.7% from a year earlier; general rentals grew 8.8%.
Status: Working, on track against what the company said.
Fleet productivity
Working+6.5% in Q3 FY2026
This company measure combines changes in rental rates, how much of the time machines are out on rent, and mix. It was +2.2% for FY2025.
Status: Working, on track against what the company said.
Buying other rental companies
Mixed$357M spent in FY2025
It bought Yak (ground mats) in March 2024. Its planned purchase of H&E Equipment Services, signed in January 2025, ended in February 2025.
Status: Mixed, partly on track.
Bigger fleet
Working+7.9% average fleet cost, Q3 FY2026
Average original equipment cost rose 7.9% from a year earlier in Q3 FY2026. In its Oct 21, 2026 release, the company put FY2026 gross rental purchases at $5.2 billion to $5.5 billion.
Status: Working, on track against what the company said.
Status compares progress with what the company itself said it would do: Working = on track against what the company said; Mixed = partly on track; Behind = behind the company's own plan; New = recently announced; Early = too early to judge.
18The company's own measures (non-GAAP)
18The company's own measures · FY2025 and Q3 FY2026, as each row says
What do United Rentals' own measures show?
Official (GAAP): Net income, FY2025
$2.5B
Company's own measure: Adjusted EBITDA, FY2025
$7.3B
Adds back interest, tax and all depreciation and amortization (including $2,670M on rental equipment), plus stock-based payPay given as shares instead of cash, which spreads ownership more thinly. Learn more ($134M), the fair-value mark-up of acquired fleet ($31M) and restructuring ($1M). It includes a $52M benefit from the ended H&E merger.
Official (GAAP): Net income, Q3 FY2026
$920M
Company's own measure: Adjusted EBITDA, Q3 FY2026
$2.3B
Same definition. The first nine months of FY2026 also include a $53M pre-tax gain on selling part of the scaffolding business.
Official (GAAP): Net cash from operating activities, FY2025
$5.2B
Company's own measure: Free cash flow (company definition), FY2025
$2.2B
Subtracts purchases of rental and non-rental equipment ($4,528M) and adds back proceeds from selling equipment ($1,413M rental, $56M non-rental) and insurance proceeds ($50M).
Official (GAAP): Diluted EPS, Q3 FY2026
$14.77
Company's own measure: Adjusted EPS, Q3 FY2026
$15.55
Adds back, after tax, amortization of intangibles from mergers ($0.37), extra depreciation on acquired assets ($0.18), restructuring ($0.18) and the fair-value mark-up of acquired fleet ($0.05).
Official (GAAP): Equipment rental revenue growth, Q3 FY2026
17.8%
Company's own measure: Fleet productivity, Q3 FY2026
6.5%
The company's measure of the combined effect of rental rates, time on rent and mix on owned equipment rental revenue, year over year.
These are the company's own measures, defined by the company. They are not comparable across companies, and they are not added together. Each sits beside the nearest official (GAAP) figure.
Learn: Non-GAAP measures: what a company's "adjusted" numbers leave out · Stock-based compensation and dilution: pay that becomes shares
19Financial strength and debt
19Financial strength · Sep 30, 2026
How much debt does United Rentals have?
- Total debt$14.7B
- Cash and investments$153M
- Net debt (debt minus cash)$14.5B
- Net worth (shareholders' money)$9.7B
- Debt to equity
- 1.51×
- $ of debt for every $1 of shareholders' money
- Net debt of $14,518M is total debt of $14,671M minus cash of $153M at Sep 30, 2026 (Cityfort calculation from the Q3 FY2026 10-Q). Total debt includes $370M of finance leases.
- The company states net leverage (net debt ÷ adjusted EBITDA, its own measure) of 1.8x and total liquidity of $2,615M at Sep 30, 2026, in its Q3 FY2026 earnings release.
- Most of the debt is fixed-rate notes due from 2027 to 2034; the rest is drawn on a $4.5 billion ABL credit line ($2,033M), a receivables facility ($1,473M) and a term loan ($969M).
- The only financial covenant, a fixed charge coverage ratio under the ABL facility, applies only if availability falls below 10% of the maximum; the 10-Q says the company was in compliance at Sep 30, 2026.
- After the quarter, an 8-K filed Oct 29, 2026 reported new notes of $700M due 2029, $800M due 2031 and $1.0 billion due 2036, issued by its subsidiary United Rentals (North America).
20Who owns it
20Who owns it · ownership as of Mar 16, 2026
Who owns United Rentals?
- Officers and directors (as a group), shares
- 0.5%
Share classes
Holders of 5% or more
From the company's proxy statement (DEF 14A), later Schedule 13G filings and the share counts on its latest annual or quarterly report. Each holder row shows the date of its own filing.
Learn: How to read a proxy statement (DEF 14A): Nvidia's 2026 proxy · Form 4 insider filings: who files, the codes and the footnotes
21What it does with profit
21What it does with profit
What does United Rentals do with its profit?
Dividend per share
$7.16FY2025
Dividend paid for each share, by financial year.
$ per share
See the numbers
Buyback · Dec 31, 2021
Common stock repurchased in FY2021.
$34M
Buyback · Dec 31, 2022
Common stock repurchased in FY2022.
$1.1B
Buyback · Dec 31, 2023
Common stock repurchased in FY2023, including shares withheld for tax.
$1.1B
Buyback · Dec 31, 2024
Common stock repurchased in FY2024, including shares withheld for tax.
$1.6B
Buyback · Dec 31, 2025
Common stock repurchased in FY2025, including shares withheld for tax.
$2.0B
Buyback · Sep 30, 2026
Shares repurchased in the first nine months of FY2026.
$1.1B
22Governance signals
22Governance signals
What do United Rentals' governance filings show?
- Auditor
- Ernst & Young LLP, since 1997
- Auditor changes
- None in the period covered
- Audit qualifications
- None reported
- Related-party dealings
- The 2026 proxy describes a written policy under which the Audit Committee reviews and approves or rejects related-party transactions; no such transactions were collected for this page.
- Credit rating
- Moody's and S&P (as stated in the Q3 FY2026 10-Q) Ba1 (Moody's) / BBB- (S&P) (outlook Positive (Moody's) / Stable (S&P)), Oct 21, 2026
A credit rating describes the company's ability to repay debt. It is not a rating of the share.
Flags to know about
other · Oct 21, 2026
Rating changes during 2026
The FY2025 10-K listed Moody's at Ba1 with a Stable outlook and S&P at BB+ Stable. The Q3 FY2026 10-Q lists Moody's Ba1 Positive and S&P BBB- Stable. The filings do not give the date of each change.
other · Jan 28, 2026
Legal matters the company reports
The FY2025 10-K lists ordinary-course claims, such as personal injury, product liability, employment and contract matters. The company says it believes they will not have a material adverse effect on its financial position.
other · May 8, 2026
2026 annual meeting
All 11 directors were elected, Ernst & Young was ratified as auditor and say-on-pay (the shareholder vote on executive pay) was approved. A stockholder proposal on directors who fail to get a majority vote was rejected.
disclosure · Mar 25, 2026
Old ownership data in the proxy
The 2026 proxy's 5% holder rows for Vanguard and BlackRock come from Schedule 13G/A filings made in early 2024.
23How it got here
23How it got here
How did United Rentals get here?
1997
Milestone
Company formed
United Rentals was incorporated in Delaware in 1997; Ernst & Young has audited it since then.
2019
Milestone
New CEO
Matthew Flannery became CEO in May 2019, and former CEO Michael Kneeland became Chair.
2021
Business-model change
Mobile storage added
It bought General Finance in May 2021, adding mobile storage and modular offices to the specialty business.
2022
Milestone
Ahern Rentals assets
In December 2022 it bought the assets of Ahern Rentals to expand its core rental business.
2023
Milestone
First dividend
The first dividend was paid in February 2023; the FY2025 total declared was $7.16 a share.
2024
Business-model change
Ground mats via Yak
Yak was bought in March 2024; surface protection mats were 4% of FY2025 equipment rental revenue.
2025
Crisis
H&E deal ends
A merger agreement to buy H&E Equipment Services, signed in January 2025, was ended in February 2025, and United Rentals received a $64M break-up fee.
2026
Milestone
Part of scaffolding sold
It sold part of its scaffolding business, booking a $53M pre-tax gain in the first nine months of FY2026.
24Sources and changes
Where every number on this page comes from
Sources (22 documents)
- S1Form 10-Q for Q3 FY2026 · SEC EDGAR · Tier 1: company or exchange filing · Oct 21, 2026
- S2Form 10-Q for Q1 FY2026 · SEC EDGAR · Tier 1: company or exchange filing · Apr 22, 2026
- S3Form 10-K for FY2025 · SEC EDGAR · Tier 1: company or exchange filing · Jan 28, 2026
- S4Form 10-Q for Q3 FY2025 · SEC EDGAR · Tier 1: company or exchange filing · Oct 22, 2025
- S5Form 10-Q for Q2 FY2025 · SEC EDGAR · Tier 1: company or exchange filing · Jul 23, 2025
- S6Form 10-Q for Q1 FY2025 · SEC EDGAR · Tier 1: company or exchange filing · Apr 23, 2025
- S7Form 10-K for FY2024 · SEC EDGAR · Tier 1: company or exchange filing · Jan 29, 2025
- S8Form 10-Q for Q3 FY2024 · SEC EDGAR · Tier 1: company or exchange filing · Oct 23, 2024
- S9Form 10-Q for Q2 FY2024 · SEC EDGAR · Tier 1: company or exchange filing · Jul 24, 2024
- S10Form 10-Q for Q1 FY2024 · SEC EDGAR · Tier 1: company or exchange filing · Apr 24, 2024
- S11Form 10-K for FY2023 · SEC EDGAR · Tier 1: company or exchange filing · Jan 24, 2024
- S12Form 10-K for FY2022 · SEC EDGAR · Tier 1: company or exchange filing · Jan 25, 2023
- S13Form 10-K for FY2021 · SEC EDGAR · Tier 1: company or exchange filing · Jan 26, 2022
- S152026 proxy statement (DEF 14A) · SEC EDGAR · Tier 1: company or exchange filing · Mar 25, 2026
- S16Q3 FY2026 earnings release (8-K Ex. 99.1) · SEC EDGAR · Tier 1: company or exchange filing · Oct 21, 2026
- S17Q2 FY2026 earnings release (8-K Ex. 99.1) · SEC EDGAR · Tier 1: company or exchange filing · Jul 22, 2026
- S19Q4 FY2025 earnings release (8-K Ex. 99.1) · SEC EDGAR · Tier 1: company or exchange filing · Jan 28, 2026
- S20Q3 FY2025 earnings release (8-K Ex. 99.1) · SEC EDGAR · Tier 1: company or exchange filing · Oct 22, 2025
- S22Q1 FY2025 earnings release (8-K Ex. 99.1) · SEC EDGAR · Tier 1: company or exchange filing · Apr 23, 2025
- S238-K filed Oct 29, 2026 (notes offering) · SEC EDGAR · Tier 1: company or exchange filing · Oct 29, 2026
- S258-K filed Jun 18, 2026 (receivables facility amendment) · SEC EDGAR · Tier 1: company or exchange filing · Jun 18, 2026
- S278-K filed May 8, 2026 (Item 5.07, vote results) · SEC EDGAR · Tier 1: company or exchange filing · May 8, 2026
Changes to this page (v1 · Nov 20, 2026)
- v1 · Nov 20, 2026First version. (first version)
Numbers come only from tier 1 and tier 2 sources. Read how we research.
Disclaimer
For learning only. Cityfort is not a registered investment adviser or broker-dealer and does not recommend buying or selling any security. Prices shown are dated and may be out of date.
Investing in securities involves risk, including loss of capital. Before making any investment decision, do your own research and consider consulting a registered investment adviser or other qualified professional.
Cityfort, its owners and contributors may or may not hold securities of companies covered. Cityfort is not paid by any company it covers. Content is not an offer or solicitation to buy or sell any security, including in any initial public offering.
Read the positions policyRead the full disclaimerHide the full disclaimer
Cityfort publishes general educational content that explains how listed companies work. Cityfort is not registered with the US Securities and Exchange Commission or any state securities regulator as an investment adviser, and is not a broker-dealer or a member of FINRA. Cityfort does not provide investment, tax or legal advice, recommendations, ratings, price targets or any opinion on whether to buy, sell or hold any security. Nothing on the site is tailored to any person's circumstances.
All information is taken from publicly available sources, mainly company filings with the SEC, which are listed on each page with dates. We work to keep it accurate and correct errors publicly, but we do not guarantee that it is complete, accurate or up to date. Any market price or price-based ratio shown is dated, may be out of date by the time you read it, and is included only to explain concepts.
Statements by company management, including forward-looking statements and guidance, are reported as the company's statements, with their date and source; they are not our forecasts. Adjusted (non-GAAP) figures are the company's own measures and are shown next to the official (GAAP) figures.