Industrials · NASDAQ: ADP
ADP: how the business works
ADP runs payroll, payroll taxes and HR for over 1.1 million employers and pays over 42 million workers, with revenue of $21.9 billion in FY2026.
By Hardik Bhandare · Checked against filings: . Editorial policy. Corrections
Follow ADP
Email me when ADP's page is updated after earnings.
We'll send a confirmation email first. See our privacy policy.
Automatic Data Processing, Inc. · Roseland, New Jersey · Founded 1949
Updated for Q1 FY2027 · checked
- Revenue, FY2026
- $21.9B
- Net income, FY2026
- $4.41B
- Clients, FY2026
- Over 1.1 million
- Interest on client funds, FY2026
- $1,355M
- Employees, FY2026
- About 67,000
The short version
ADP in 5 points
1 · What it sells
ADP runs payroll, payroll tax filing, HR software and outsourced HR for employers, paying over 42 million workers in more than 140 countries and territories.
2 · Who pays it
In FY2026, HR and payroll software brought in 41.5% of ADP's revenue, PEO benefit pass-throughs 21%, other HR outsourcing 18.1%, non-US payroll 13.2% and interest on client money 6.2%.
3 · What it keeps from $100
Of every $100 that came in during FY2026, ADP kept $19.7 as net income, including $410.6 million of other income; ADP reports no operating margin, and its own adjusted EBIT margin was 26.8%.
4 · Where the operating profit comes from
Employer Services earned $5,436.8 million before tax in FY2026, a 36.7% margin, against $936.1 million and a 13.1% margin for PEO Services.
5 · The one thing to watch
Interest on client funds rose from $451.8 million in FY2022 to $1,354.8 million in FY2026, and the average yield on client funds was 3.6% in Q1 FY2027.
Sources: From ADP's FY2022 to FY2026 10-Ks, Q1 FY2027 10-Q, 2026 proxy and earnings releases · checked
01Where the money goes · FY2026
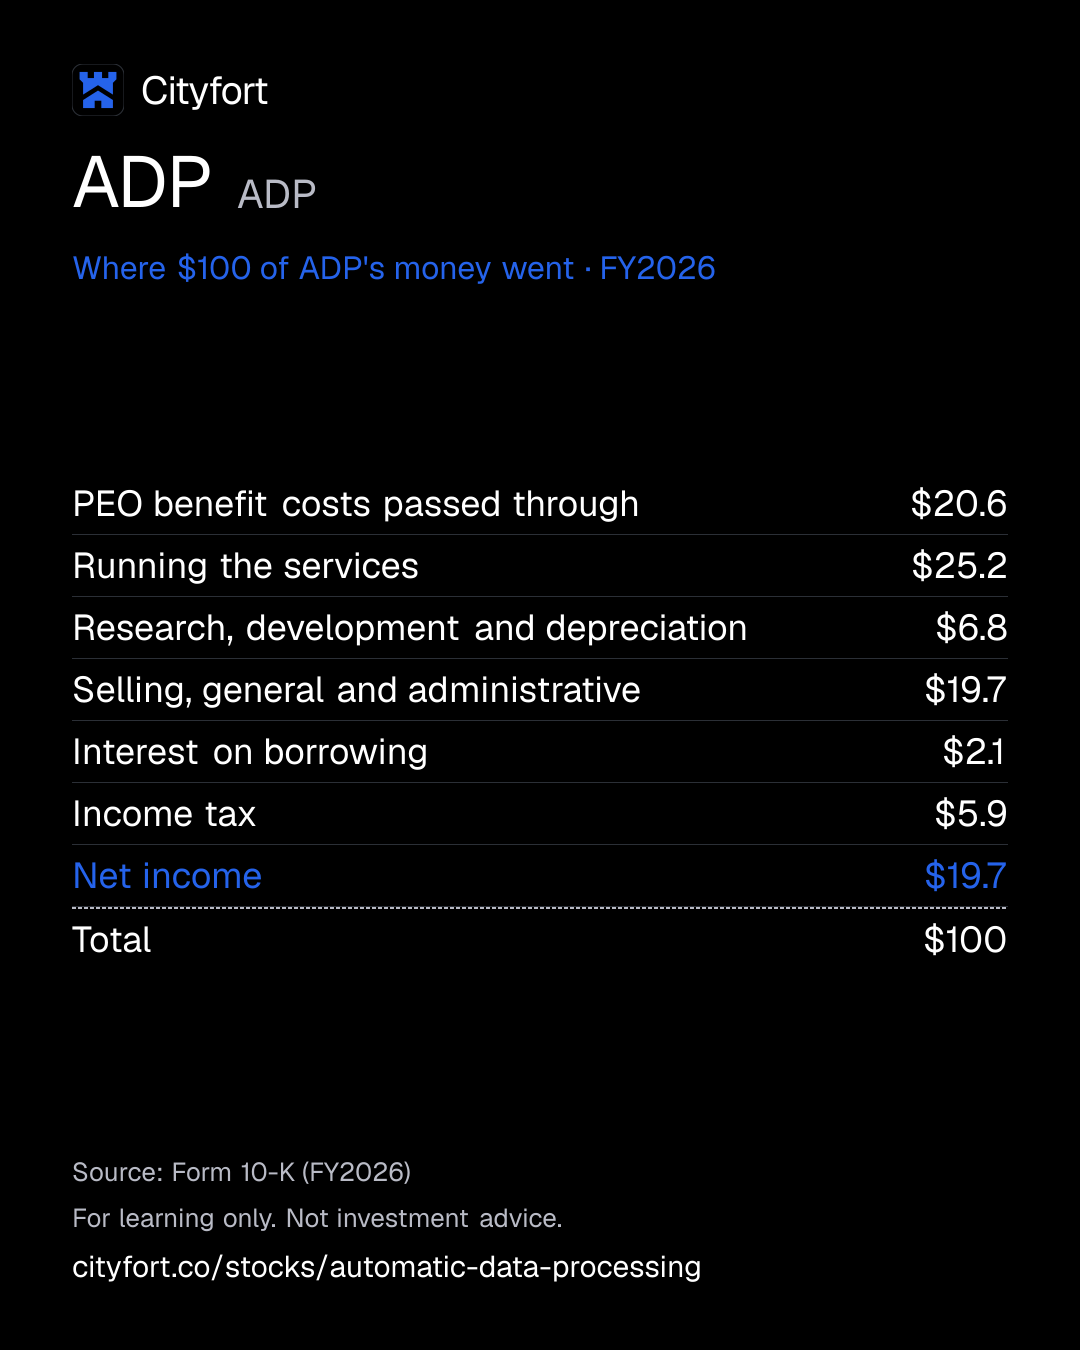
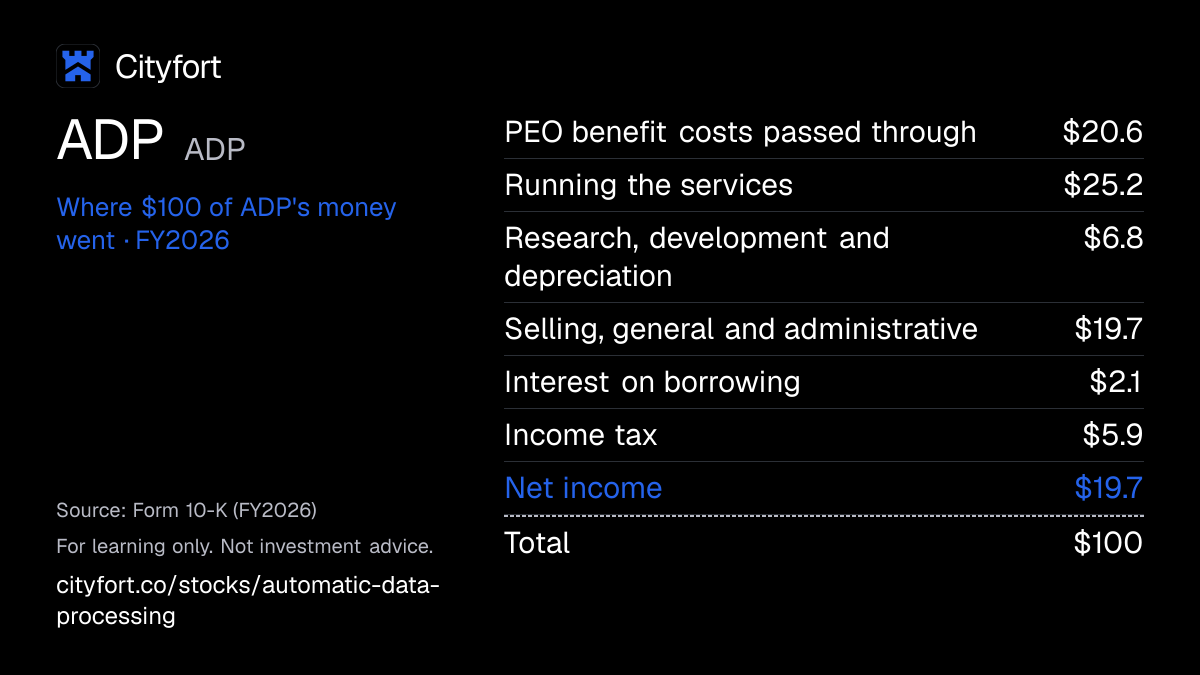
Where does $100 of ADP's money go?
ADP · FY2026
Receipt for every $100
| PEO benefit costs passed through | $20.6 |
|---|---|
| Running the services | $25.2 |
| Research, development and depreciation | $6.8 |
| Selling, general and administrative | $19.7 |
| Interest on borrowing | $2.1 |
| Income tax | $5.9 |
| Net income | $19.7 |
| Total | $100 |
Each line = amount ÷ total money in × 100. Lines may not add to exactly $100 because of rounding.
How this is worked out
Cityfort calculation from the FY2026 10-K: each line divided by total money in (revenue of $21,947.4 million plus other income of $410.6 million), times 100. Running the services is operating costs of $10,240.6 million minus the $4,607.3 million of pass-through benefit costs.
Save this receipt as an image
Embed this receipt or the key numbers
Paste this code into a blog or website to show the card you choose, with a link back to this page.
Each week: the next company due to report earnings, explained in 5 points.
No tips. Unsubscribe anytime.
We'll send a confirmation email. See our privacy policy.
02The business in one line
What does ADP do?
Employers pay ADP fees to run their payroll, taxes and HR, and ADP keeps the interest on payroll money it holds before payday. In FY2026, $19.7 of every $100 that came in was left as net income.
- Employers of every size pay for payroll, HR, time, tax and benefits services; PEO clients, whose staff ADP co-employs, also pay their workers' benefit costs, which ADP passes on at no margin.
- Of every $100 that came in during FY2026, $25.2 went on running the services, $20.6 on PEO benefit costs passed through and $19.7 on selling and administration.
03Who pays it
Who pays ADP?
Employers using its HR and payroll software
41.5%
of revenue
Payroll, HR, time, tax and benefits services: $9,110.6 million in FY2026.
PEO clients: benefits passed through
21%
of revenue
Health and other benefit costs of PEO worksite employees, billed to clients at no margin: $4,607.3 million.
HR outsourcing clients
18.1%
of revenue
PEO fees and other outsourcing services, not counting the pass-through benefit costs: $3,973.5 million.
Multinational and non-US employers
13.2%
of revenue
Global Solutions payroll and HR outside the US: $2,901.2 million.
Interest on clients' payroll money
6.2%
of revenue
ADP invests client funds until it pays them out and keeps the interest: $1,354.8 million.
- Employers using its HR and payroll software41.5%
- PEO clients: benefits passed through21%
- HR outsourcing clients18.1%
- Multinational and non-US employers13.2%
- Interest on clients' payroll money6.2%
How spread out the customers are
No single client or group of affiliated clients was more than 2% of revenue in FY2026, the 10-K says. Revenue shares above are a Cityfort calculation from the FY2026 10-K.
Sources (1)
04How it makes money
How does ADP make money?
Fees every pay run, plus interest on payroll money it holds
Employers pay ADP fees for payroll, HR and tax services, and most stay: Employer Services kept 92.1% of client revenue in FY2026. ADP also collects payroll money before payday and invests it. That interest reached $1,354.8 million in FY2026.
Interest earned on client funds ($ million)
$451.8$1,354.8
FY2022 to FY2026
- A business signs up to run payroll with ADP
- ADP collects the pay and tax money before payday
- It invests that money until workers and tax agencies are paid
- Clients pay fees for payroll, HR and tax services
- ADP keeps the interest: $1,354.8 million in FY2026, up from $451.8 million in FY2022
- Clients stay about 13 years on average in Employer Services
↺ Step 6 feeds back into step 1.
05Business segments · FY2026
Which businesses make up ADP?
Employer Services
67.5%Payroll, HR, time, tax and benefits services for employers of all sizes. Pre-tax earnings were $5,436.8 million, a 36.7% margin.
Revenue $14.8B ($14,831M) · Operating profit $5.4B ($5,437M)
PEO Services
32.5%ADP TotalSource, the co-employer business. Revenue includes $4,607.3 million of benefit costs passed through at no margin; pre-tax margin 13.1%.
Revenue $7.1B ($7,128M) · Operating profit $936M
How the mix changed
- Employer Services
- PEO Services
Revenue by segment, FY2024 to FY2026.
US$
See the numbers
Sources (1)
06The numbers · Consolidated · US$
How has ADP done?
Revenue
$21.9BFY2026
Revenue rose every year, from $16,498.3 million in FY2022 to $21,947.4 million in FY2026, which included $1,354.8 million of interest earned on client funds.
US$
See the numbers
Net income
$4.4BFY2026
Net income rose every year, from $2,948.9 million in FY2022 to $4,413.5 million in FY2026.
US$
See the numbers
Net income for every $100 of revenue
$20.1FY2026
EBITDA per $100 of revenue rose from $26.2 in FY2022 to $29.0 in FY2026. ADP reports no operating income line, so EBITDA here is revenue minus costs of revenues and selling, general and administrative costs, plus depreciation and amortization (Cityfort calculation from the FY2023 to FY2026 10-Ks).
Net margin: $ of net income per $100 of revenue
See the numbers
Free cash flow
$5.2BFY2026
Free cash flow (cash from operations minus the capital expenditures line) was $5,244.6 million in FY2026; the $468.5 million spent on capitalized software that year is not deducted.
US$ · cash from operations minus spending on plants and equipment
See the numbers
See all yearly numbers
EBITDA here = operating income plus depreciation and amortization (from the cash flow statement). Fiscal years are the company's own: Fiscal year ends June 30; FY2026 ran from July 1, 2025 to June 30, 2026. Net income is the share belonging to the company's owners.
Learn: Fiscal years that don't end in December: Nvidia's FY2027 explained · Stock-based compensation and dilution: pay that becomes shares
Sources (16)
- Form 10-K for FY2022
- Form 10-K for FY2023
- Form 10-K for FY2024
- Form 10-K for FY2025
- Form 10-K for FY2026
- Form 10-Q for Q2 FY2024
- Form 10-Q for Q3 FY2024
- 8-K Ex. 99.1: Q4 and FY2025 results
- Form 10-Q for Q1 FY2025
- Form 10-Q for Q2 FY2025
- Form 10-Q for Q3 FY2025
- Form 10-Q for Q1 FY2026
- Form 10-Q for Q2 FY2026
- Form 10-Q for Q3 FY2026
- 8-K Ex. 99.1: Q4 and FY2026 results, FY2027 outlook
- Form 10-Q for Q1 FY2027
07Who runs it
Who runs ADP, and did they deliver?
Maria Black
President and Chief Executive Officer · since 2023
Joined ADP in 1996; CEO since January 2023.
Peter Hadley
Chief Financial Officer · since 2025
CFO since July 2025; ADP's corporate treasurer from October 2022 to June 2025.
Thomas J. Lynch
Non-Executive Chair of the Board
Former chairman and CEO of TE Connectivity; an ADP director since 2018.
Sreeni Kutam
President, Global Product and Innovation · since 2023
Joe DeSilva
Executive Vice President, North America, and Chief of Operations · since 2025
David Foskett
President, Global Sales · since 2025
What they said, and what happened
2 delivered · 1 too early to tell
Said on Apr 29, 2026
In its Q3 FY2026 earnings release, ADP said it expected FY2026 revenue growth of 6% to 7%.
DeliveredWhat happened
FY2026 revenue was $21,947.4 million, 6.7% above FY2025's $20,560.9 million (Cityfort calculation from the FY2026 10-K).
Said on Apr 29, 2026
In the same release, ADP said it expected FY2026 adjusted diluted EPS growth of 10% to 11%.
DeliveredWhat happened
Adjusted diluted EPS was $11.12, up 11.1% from $10.01 (Cityfort calculation from the Q4 FY2026 earnings release); the CFO said the year ended at the high end of guidance.
Said on Oct 28, 2026
In its Q1 FY2027 earnings release, ADP said it expects FY2027 revenue growth of about 6% and adjusted diluted EPS growth of 10% to 12%.
Too early to tellWhat happened
FY2027 ends Jun 30, 2027.
08What could go wrong
What could go wrong for ADP?
- Demand
Fewer workers on client payrolls
The 10-K says a slowdown or lower employment, including from AI, could hurt its businesses. US pays per control, ADP's measure of growth in workers on clients' US payrolls, rose 1% in FY2026.
Watch US pays per control in each earnings release.
- Other
Lower interest rates on client money
Interest on client funds was $1,354.8 million, 6.2% of FY2026 revenue. These investments face interest rate, credit and liquidity risks, the 10-K notes.
Watch Average client funds yield, 3.6% in Q1 FY2027.
- Regulation
PEO depends on its legal status as employer
To sponsor benefit plans, the PEO must count as the employer under tax rules and ERISA, the federal law on workplace benefit plans. If not, the 10-K says it would likely have to change its model and could face fines.
Watch Changes to PEO rules and PEO pre-tax margin, 13.1% in FY2026.
- Technology
Data breaches and outages
ADP holds pay, tax and personal data for millions of workers. Its cyber insurance may not cover all losses, and system or data center outages could cause material harm, the 10-K warns.
Watch Cyber incidents disclosed in 10-Q and 8-K filings.
- Competition
AI and fast-changing technology
Demand could fall if ADP fails to upgrade its technology, including for AI, according to the 10-K. It spent about $1.405 billion on research and development in FY2026.
Watch Employer Services bookings growth, 6% in FY2026.
- Legal
Retirement plan lawsuit
According to the FY2026 10-K, a 2020 proposed class action alleged ERISA violations in running the ADP TotalSource Retirement Savings Plan. The 10-K says ADP reached a settlement of all outstanding claims for $48 million, subject to the court's approval.
Watch Court approval of the settlement, reported in later 10-Q filings.
- Currency
Currency moves
About 12% of FY2026 revenue was billed outside the US (Cityfort calculation from the FY2026 10-K), so exchange rates change reported results.
Watch Constant-currency growth in Employer Services.
09Supporters vs. critics
What do supporters and critics point to?
What supporters point to
- Employer Services kept 92.1% of client revenue in FY2026, and the FY2026 10-K estimates clients stay about 13 years on average.
- Revenue grew every year from $16,498.3 million in FY2022 to $21,947.4 million in FY2026, and net income from $2,948.9 million to $4,413.5 million.
- No single client was more than 2% of FY2026 revenue, according to the FY2026 10-K.
- Operating cash flow was $5,441.2 million in FY2026, and net debt was $873.3 million at Jun 30, 2026 (Cityfort calculation from the FY2026 10-K).
What critics point to
- Interest on client funds was 6.2% of FY2026 revenue, and the 10-K says those investments face interest rate, credit and liquidity risks.
- PEO Services pre-tax earnings fell 2% to $936.1 million in FY2026; the 10-K cites higher selling and benefit costs.
- US pays per control, ADP's measure of growth in workers on clients' US payrolls, rose 1% in FY2026; the 10-K says lower employment, including from AI, could hurt its businesses.
- Stockholders' equity fell from $6,031.2 million at Jun 30, 2026 to $5,092.1 million at Sep 30, 2026, after buybacks, dividends and a fall in the value of available-for-sale bonds.
- According to the FY2026 10-K, a 2020 proposed class action alleged ERISA violations in running the ADP TotalSource Retirement Savings Plan; ADP reached a $48 million settlement, subject to court approval.
10What to watch next
What should you watch next at ADP?
Next event
Q2 FY2027 results
Date not announced yet.
FY2027 outlook
In its Q1 FY2027 earnings release on Oct 28, 2026, ADP said it expects FY2027 revenue growth of about 6% and adjusted diluted EPS growth of 10% to 12%. The Q2 FY2027 release will show the next update.
Interest on client funds
ADP said on Oct 28, 2026 that it expects $1.59 billion to $1.61 billion in FY2027, against $1,354.8 million in FY2026. The average yield on client funds was 3.6% in Q1 FY2027.
PEO growth and margin
PEO average worksite employees were about 762,000 in FY2026, up 2%, and PEO pre-tax margin was 13.1%. ADP reports worksite employees in each earnings release.
Retirement plan settlement
The FY2026 10-K says the $48 million settlement of the ERISA class action needs the court's approval; later 10-Q filings will report its status.
11Key facts
Key facts about ADP
- What does ADP do?
- Automatic Data Processing (ADP) runs payroll, payroll tax filing and HR services for employers. According to its FY2026 10-K, ADP pays over 42 million workers in more than 140 countries and territories.
- How does ADP make money?
- ADP earns fees from employers for payroll, HR, tax and benefits services, plus interest on client payroll money it holds before payday. That interest was $1,354.8 million in FY2026, 6.2% of ADP's revenue (Cityfort calculation from the FY2026 10-K).
- Who are ADP's customers?
- ADP serves over 1.1 million clients, from small businesses to multinational employers. According to its FY2026 10-K, no single ADP client was more than 2% of FY2026 revenue.
- How big is ADP?
- ADP's revenue was $21,947.4 million in FY2026 (the year ended Jun 30, 2026), up from $20,560.9 million in FY2025. ADP's FY2026 net income was $4,413.5 million.
- What are ADP's business segments?
- ADP reports two segments. In FY2026, Employer Services had revenue of $14,831.4 million and PEO Services, where ADP is co-employer of clients' workers, had $7,128.1 million.
- Who owns ADP?
- No shareholder controls ADP. ADP's 2026 proxy statementThe yearly filing about shareholder votes, the board and executive pay. Learn more lists BlackRock (8.10%, from a Jan 2024 filing), Vanguard (7.51%) and State Street (5.1%) as holders of over 5%; directors and executive officers held about 0.15% (Cityfort calculation from the 2026 proxy statement).
- Does ADP pay dividends?
- ADP declared dividends of $6.64 per share for FY2026 and paid $2,626.3 million in dividends during the year. ADP also paid $2,083.3 million for share buybacks in FY2026.
Terms on this page
- Capital expenditures (capex)
- Debt-to-equity
- Earnings per share (EPS)
- EBITDA
- Free cash flow
- Net debt
- Net margin
- Revenue vs net income
- Stock buyback
Each explains the term in plain English, with the same number from other companies on Cityfort.
Go deeper
More detail from the same filings. Open any section.
12What it sells
12What it sells
What does ADP sell?
Payroll and HR software
RUN serves over 980,000 small businesses, Workforce Now over 90,000 mid-sized and large firms, and Lyric HCM large global employers.
Payroll tax filing and compliance
ADP prepares and files federal, state and local payroll tax returns for US clients; SmartCompliance handles tax and wage payment rules.
PEO: ADP TotalSource
ADP becomes co-employer of a small or mid-sized client's staff and runs their payroll, benefits, workers' compensation and HR.
Time tracking and scheduling
Time clocks, scheduling and absence tools used by over 160,000 employers; WorkForce Software, bought in October 2024, adds tools for large global firms.
Global payroll
Payroll and HR for multinational employers; over 70,000 clients, and over 16 million workers paid outside the US.
Retirement and insurance services
Runs 401(k) and other retirement plans for over 210,000 US employers; its licensed agency arranges workers' compensation and health cover for over 280,000 clients.
Think of it like this
Like hiring an outside payroll office: the employer decides who gets paid, and ADP does the math, the transfers and the tax forms.
What it does
- Does: Calculates pay and moves the money to workers on payday
- Does: Files payroll taxes and sends over 79 million US year-end tax statements
- Does: Acts as co-employer of clients' workers in its PEO business
What it does not do
- Does not: Does not own the payroll money it holds: $43,957.8 million of funds held for clients at Jun 30, 2026 were matched by $44,415.5 million of client fund obligations
- Does not: Does not act as the insurer in its Insurance Services business: its licensed agency arranges cover through insurance carriers
- Does not: Does not rely on one big client: none was more than 2% of FY2026 revenue
Sources (2)
13How the money flows
13How the money flows · FY2026
How does money flow through ADP?
Money in
- Revenue$21.9B
- Other income, mostly interest on ADP's own cash$411M
The company
ADP
$22.4B came in
Money out
- PEO benefit costs passed through$4.6B
- Running the services$5.6B
- Research, development and depreciation$1.5B
- Selling, general and administrative$4.4B
- Interest on borrowing$459M
- Income tax$1.3B
- Net income$4.4B
- Revenue was $21,947.4 million in FY2026, including $1,354.8 million of interest earned on clients' payroll money.
- ADP passed $4,607.3 million straight through: PEO benefit costs billed to clients at no margin.
- Running the services cost $5,633.3 million, and selling, general and administrative costs were $4,408.2 million.
- Interest on debt took $459.3 million and income tax $1,316.8 million.
- The remaining $4,413.5 million was net income.
Sources (1)
14What it needs to run
14What it needs to run
What does ADP need to run?
People
About 67,000 associates at Jun 30, 2026 deliver its services in over 140 countries and territories.
Links to tax agencies and banks
Direct connections to tens of thousands of government entities, tax authorities and banks let ADP file taxes and move pay.
Software spending
ADP says it invested about $1.405 billion in research and development in FY2026, including AI tools and software purchases.
Short-term borrowing
To keep client money invested longer, ADP borrows short term; its commercial paper (short-term IOUs sold to investors) averaged $4.2 billion in FY2026.
Data centers and cloud services
The 10-K lists a disruption of the data centers or cloud services it uses as a material risk.
Sources (1)
15Where it sells
15Where it sells · FY2026
Where does ADP sell?
- United States87.8%
- Europe, Middle East and Africa7.9%
- Canada2.4%
- Other1.9%
Sources (1)
16Where growth could come from
16Where growth could come from
Where could ADP's growth come from?
In its Q1 FY2027 earnings release on Oct 28, 2026, ADP said it expects FY2027 revenue growth of about 6%, up from 5% to 6% in its Jul 29, 2026 outlook. It also expects adjusted diluted EPS growth of 10% to 12% and interest on client funds of $1.59 billion to $1.61 billion.
Interest on client funds
Working$1,354.8M in FY2026, +14%
Average client funds rose 7% to $40.4 billion and the yield rose to 3.4%. Q1 FY2027 interest was $329.3 million, up 15%.
Status: Working, on track against what the company said.
New business bookings
Working$2.2B in FY2026, +6%
Employer Services bookings, ADP's measure of sales to new clients, grew 6%, inside the 4% to 7% range ADP gave on Apr 29, 2026.
Status: Working, on track against what the company said.
PEO worksite employees
MixedAbout 762,000 in FY2026, +2%
ADP said in its Apr 29, 2026 release that it expected about 2% growth, and it reported 2%. PEO pre-tax earnings fell 2% to $936.1 million; the 10-K cites higher selling and benefit costs.
Status: Mixed, partly on track.
Status compares progress with what the company itself said it would do: Working = on track against what the company said; Mixed = partly on track; Behind = behind the company's own plan; New = recently announced; Early = too early to judge.
17The company's own measures (non-GAAP)
17The company's own measures · FY2026
What do ADP's own measures show?
Official (GAAP): Earnings before income taxes, FY2026
$5.7B
Company's own measure: Adjusted EBIT, FY2026
$5.9B
ADP leaves out about $91 million of business alignment charges, an $18 million net legal settlement charge and some gains, and interest not tied to client funds.
Official (GAAP): Pre-tax margin, FY2026
26.1%
Company's own measure: Adjusted EBIT margin, FY2026
26.8%
Adjusted EBIT as a share of revenue; it was 26.0% in FY2025.
Official (GAAP): Diluted EPS, FY2026
$10.94
Company's own measure: Adjusted diluted EPS, FY2026
$11.12
Adjusted net earnings per diluted share, up from $10.01 in FY2025.
Official (GAAP): Employer Services revenue, FY2026
14,831.4%
Company's own measure: Employer Services client revenue retention, FY2026
92.1%
The share of revenue kept from existing clients; flat on FY2025.
Official (GAAP): Employer Services revenue, FY2026
$14.8B
Company's own measure: Employer Services new business bookings, FY2026
2.2 billion
ADP's measure of sales to new clients; up 6% from $2.1 billion in FY2025.
Official (GAAP): Interest on funds held for clients, FY2026
$1.4B
Company's own measure: Average client funds, FY2026
40.4 billion
Average balance of payroll and tax money held for clients, up 7%; the average yield was 3.4%.
These are the company's own measures, defined by the company. They are not comparable across companies, and they are not added together. Each sits beside the nearest official (GAAP) figure.
Learn: Non-GAAP measures: what a company's "adjusted" numbers leave out
18Financial strength and debt
18Financial strength · Jun 30, 2026
How much debt does ADP have?
- Total debt$5.1B
- Cash and investments$4.2B
- Net debt (debt minus cash)$873M
- Net worth (shareholders' money)$6.0B
- Debt to equity
- 0.85×
- $ of debt for every $1 of shareholders' money
- Debt here is long-term debt of $4,964.1 million plus $139.3 million of reverse repurchase obligations; net debt subtracts ADP's own cash of $4,230.1 million (Cityfort calculation from the FY2026 10-K).
- The $43,957.8 million of funds held for clients is not ADP's cash; it is matched by client fund obligations of $44,415.5 million.
- The long-term debt is five $1.0 billion senior notes due 2028, 2030, 2032, 2034 and 2036; the 5.00% notes due 2036 were issued in May 2026.
- ADP has $11.7 billion of committed credit lines, including a $5.7 billion 364-day facility and a $3.5 billion five-year facility signed in June 2026.
- Stockholders' equity was $5,092.1 million at Sep 30, 2026, after buybacks, dividends and a fall in the value of available-for-sale bonds.
19Who owns it
19Who owns it · ownership as of Aug 15, 2026
Who owns ADP?
- Officers and directors (as a group), shares
- 0.2%
Share classes
Holders of 5% or more
From the company's proxy statement (DEF 14A), later Schedule 13G filings and the share counts on its latest annual or quarterly report. Each holder row shows the date of its own filing.
Learn: How to read a proxy statement (DEF 14A): Nvidia's 2026 proxy · Form 4 insider filings: who files, the codes and the footnotes
20What it does with profit
20What it does with profit
What does ADP do with its profit?
Dividend per share
$6.64FY2026
Dividend paid for each share, by financial year.
$ per share
See the numbers
Buyback · Jun 30, 2024
Paid $1,231.7 million for share buybacks in FY2024.
$1.2B
Buyback · Jun 30, 2025
Paid $1,280.5 million for share buybacks in FY2025.
$1.3B
Buyback · Jun 30, 2026
Paid $2,083.3 million for share buybacks in FY2026, about 8.6 million shares.
$2.1B
Buyback · Sep 30, 2026
Bought back 2.9 million shares for $821.2 million in Q1 FY2027.
$821M
Sources (2)
21Governance signals
21Governance signals
What do ADP's governance filings show?
- Auditor
- Deloitte & Touche LLP, since 1968
- Auditor changes
- None in the period covered
- Audit qualifications
- None reported
- Related-party dealings
- The 2026 proxy describes a written Related Persons Transaction Policy: deals over $120,000 with directors, executive officers, 5% holders or their families go to the nominating/corporate governance committee for review. The proxy says 11 of the 13 director nominees are independent.
- Credit rating
- No public credit rating found in a search of rating agency sites on Nov 20, 2026
22How it got here
22How it got here
How did ADP get here?
1949
Milestone
Founded to run payroll
ADP's founders set it up to take payroll work off clients' hands.
2023
Milestone
Maria Black becomes CEO
Black, at ADP since 1996, took over as chief executive in January 2023.
2024
Milestone
Buys WorkForce Software
Bought in October 2024 for time and absence tools for large global employers; FY2025 cash paid for acquisitions was $1,165.1 million.
2025
Milestone
Launches ADP Lyric HCM
A global HR and payroll platform for large enterprises, launched in FY2025.
2026
Milestone
$6 billion buyback approved
The board approved a $6 billion share repurchase plan with no end date in January 2026.
2026
Milestone
New notes and credit lines
ADP issued $1.0 billion of 5.00% notes due 2036 in May 2026 and signed $5.7 billion and $3.5 billion credit facilities in June.
23Sources and changes
Where every number on this page comes from
Sources (21 documents)
- S1Form 10-Q for Q1 FY2027 · SEC EDGAR · Tier 1: company or exchange filing · Oct 30, 2026
- S2Form 10-K for FY2026 · SEC EDGAR · Tier 1: company or exchange filing · Aug 5, 2026
- S3Form 10-Q for Q3 FY2026 · SEC EDGAR · Tier 1: company or exchange filing · Apr 30, 2026
- S4Form 10-Q for Q2 FY2026 · SEC EDGAR · Tier 1: company or exchange filing · Jan 29, 2026
- S5Form 10-Q for Q1 FY2026 · SEC EDGAR · Tier 1: company or exchange filing · Oct 31, 2025
- S6Form 10-K for FY2025 · SEC EDGAR · Tier 1: company or exchange filing · Aug 6, 2025
- S7Form 10-Q for Q3 FY2025 · SEC EDGAR · Tier 1: company or exchange filing · May 1, 2025
- S8Form 10-Q for Q2 FY2025 · SEC EDGAR · Tier 1: company or exchange filing · Jan 30, 2025
- S9Form 10-Q for Q1 FY2025 · SEC EDGAR · Tier 1: company or exchange filing · Nov 1, 2024
- S10Form 10-K for FY2024 · SEC EDGAR · Tier 1: company or exchange filing · Aug 7, 2024
- S11Form 10-Q for Q3 FY2024 · SEC EDGAR · Tier 1: company or exchange filing · May 2, 2024
- S12Form 10-Q for Q2 FY2024 · SEC EDGAR · Tier 1: company or exchange filing · Feb 1, 2024
- S13Form 10-K for FY2023 · SEC EDGAR · Tier 1: company or exchange filing · Aug 3, 2023
- S14Form 10-K for FY2022 · SEC EDGAR · Tier 1: company or exchange filing · Aug 3, 2022
- S158-K Ex. 99.1: Q1 FY2027 results · SEC EDGAR · Tier 1: company or exchange filing · Oct 28, 2026
- S168-K Ex. 99.1: Q4 and FY2026 results, FY2027 outlook · SEC EDGAR · Tier 1: company or exchange filing · Jul 29, 2026
- S178-K Ex. 99.1: Q3 FY2026 results · SEC EDGAR · Tier 1: company or exchange filing · Apr 29, 2026
- S208-K Ex. 99.1: Q4 and FY2025 results · SEC EDGAR · Tier 1: company or exchange filing · Jul 30, 2025
- S23Definitive proxy statement (DEF 14A) 2026 annual meeting · SEC EDGAR · Tier 1: company or exchange filing · Sep 24, 2026
- S248-K: senior notes issuance (Items 1.01, 8.01) · SEC EDGAR · Tier 1: company or exchange filing · May 7, 2026
- S258-K: new $5.7B 364-day and $3.5B five-year credit facilities (Items 1.01, 2.03) · SEC EDGAR · Tier 1: company or exchange filing · Jun 26, 2026
Changes to this page (v1 · Nov 20, 2026)
- v1 · Nov 20, 2026First version. (first version)
Numbers come only from tier 1 and tier 2 sources. Read how we research.
Disclaimer
For learning only. Cityfort is not a registered investment adviser or broker-dealer and does not recommend buying or selling any security. Prices shown are dated and may be out of date.
Investing in securities involves risk, including loss of capital. Before making any investment decision, do your own research and consider consulting a registered investment adviser or other qualified professional.
Cityfort, its owners and contributors may or may not hold securities of companies covered. Cityfort is not paid by any company it covers. Content is not an offer or solicitation to buy or sell any security, including in any initial public offering.
Read the positions policyRead the full disclaimerHide the full disclaimer
Cityfort publishes general educational content that explains how listed companies work. Cityfort is not registered with the US Securities and Exchange Commission or any state securities regulator as an investment adviser, and is not a broker-dealer or a member of FINRA. Cityfort does not provide investment, tax or legal advice, recommendations, ratings, price targets or any opinion on whether to buy, sell or hold any security. Nothing on the site is tailored to any person's circumstances.
All information is taken from publicly available sources, mainly company filings with the SEC, which are listed on each page with dates. We work to keep it accurate and correct errors publicly, but we do not guarantee that it is complete, accurate or up to date. Any market price or price-based ratio shown is dated, may be out of date by the time you read it, and is included only to explain concepts.
Statements by company management, including forward-looking statements and guidance, are reported as the company's statements, with their date and source; they are not our forecasts. Adjusted (non-GAAP) figures are the company's own measures and are shown next to the official (GAAP) figures.