Industrials · NYSE: WM
Waste Management: how the business works
Waste Management (WM) collects, buries and recycles trash for homes and businesses across the U.S. and Canada, with $25.2 billion of revenue in FY2025.
By Hardik Bhandare · Checked against filings: . Editorial policy. Corrections
Follow Waste Management
Email me when Waste Management's page is updated after earnings.
We'll send a confirmation email first. See our privacy policy.
Waste Management, Inc. · Houston, Texas · Founded 1987
Updated for Q3 FY2026 · checked
- Revenue, FY2025
- $25.2B
- Net income, FY2025
- $2.71B
- Landfills owned or operated, Dec 31, 2025
- 257
- Full-time employees, Dec 31, 2025
- About 60,500
- Incorporated
- 1987
The short version
Waste Management in 5 points
1 · What it sells
WM collects and disposes of waste for homes and businesses in the U.S. and Canada, owns or operates 257 landfills, and also recycles, sells landfill-gas energy and handles medical waste, with $25.2 billion of revenue in FY2025.
2 · Who pays it
In FY2025, collection from businesses, homes and industrial sites brought 61.2% of revenue, landfill and transfer station fees 21.0%, healthcare customers 10.0%, recycled materials 5.9%, energy 1.9% and other services 0.1%.
3 · What it keeps from $100
Of every $100 that came in during FY2025, WM kept $10.73 as net income, after $299 million of restructuring, impairment and other one-off charges; operating profit was $17.07 per $100.
4 · Where the operating profit comes from
In FY2025, Collection and Disposal earned $5,777 million of operating income and Renewable Energy $135 million, while Recycling lost $80 million, Healthcare Solutions lost $88 million and corporate costs were $1,436 million.
5 · The one thing to watch
Healthcare Solutions, bought with Stericycle, had $2,508 million of FY2025 revenue and an $88 million operating loss; in Q3 FY2026 it earned $20 million, against a $21 million loss a year earlier.
Sources: From WM's FY2025 10-K and Q3 FY2026 10-Q · checked
01Where the money goes · FY2025
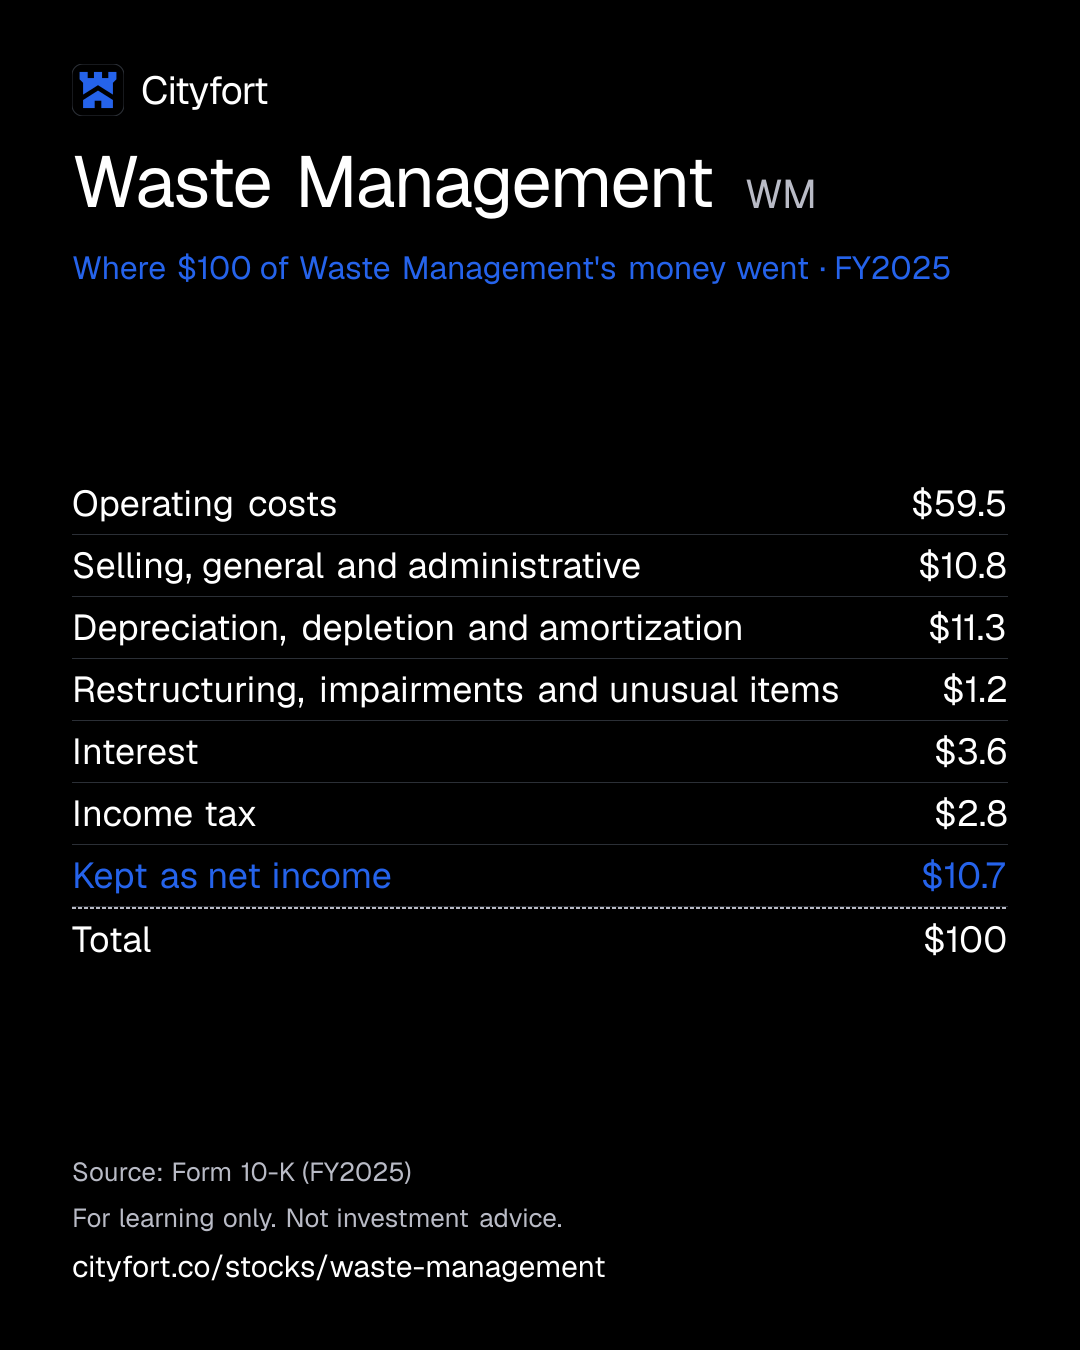
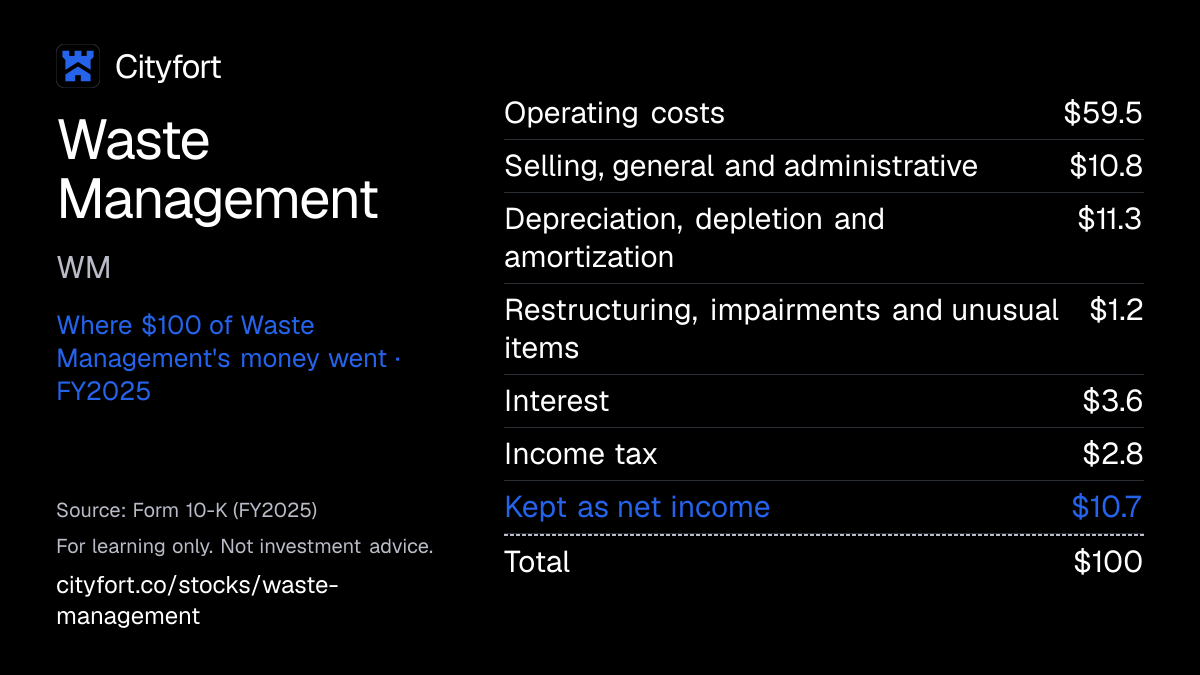
Where does $100 of Waste Management's money go?
Waste Management · FY2025
Receipt for every $100
| Operating costs | $59.5 |
|---|---|
| Selling, general and administrative | $10.8 |
| Depreciation, depletion and amortization | $11.3 |
| Restructuring, impairments and unusual items | $1.2 |
| Interest | $3.6 |
| Income tax | $2.8 |
| Kept as net income | $10.7 |
| Total | $100 |
Each line = amount ÷ total money in × 100. Lines may not add to exactly $100 because of rounding.
How this is worked out
Cityfort calculation from FY2025 10-K. Of every $100 that came in during FY2025: each line = line ÷ $25,234 million × 100 (operating revenues $25,204 million + $30 million of other income). Operating profit was $4,308 million, or $17.07 of each $100. The $1 million share of minority partners rounds to $0.00 and is left out.
Save this receipt as an image
Embed this receipt or the key numbers
Paste this code into a blog or website to show the card you choose, with a link back to this page.
Each week: the next company due to report earnings, explained in 5 points.
No tips. Unsubscribe anytime.
We'll send a confirmation email. See our privacy policy.
02The business in one line
What does Waste Management do?
Homes, businesses and towns pay WM to collect their waste and bury it in its landfills. Most of the money goes on trucks, crews and landfill costs; $10.73 of every $100 that came in during FY2025 was left as net income.
- Waste collection from businesses, homes and industrial sites brought 61.2% of FY2025 revenue, and fees at its landfills and transfer stations brought another 21.0%.
- WM also sorts and sells recyclables, turns landfill gas into electricity and renewable natural gas, and since Nov 2024 handles medical waste and document shredding through the former Stericycle.
03Who pays it
Who pays Waste Management?
Businesses, homes and industrial sites (collection)
61.2%
of revenue
Commercial $5,630 million, residential $3,510 million, industrial $3,106 million and other collection $3,175 million in FY2025. Home collection is paid by the town or authority from taxes or charges, or by residents directly.
Haulers and others using its landfills and transfer stations
21%
of revenue
Landfill $3,781 million and transfer $1,502 million of outside revenue in FY2025. These fees, called tipping fees, depend on the type and weight or volume of waste.
Hospitals, medical practices, pharmacies and labs (Healthcare Solutions)
10%
of revenue
Medical waste and document shredding customers; the segment also lists airports, schools, funeral homes, government and banks.
Buyers of recycled materials
5.9%
of revenue
Recycling Processing and Sales revenue of $1,492 million in FY2025.
Buyers of electricity, gas and renewable fuel credits
1.9%
of revenue
Renewable Energy revenue of $478 million in FY2025.
Other services (Corporate and Other)
0.1%
of revenue
$22 million in FY2025.
- Businesses, homes and industrial sites (collection)61.2%
- Haulers and others using its landfills and transfer stations21%
- Hospitals, medical practices, pharmacies and labs (Healthcare Solutions)10%
- Buyers of recycled materials5.9%
- Buyers of electricity, gas and renewable fuel credits1.9%
- Other services (Corporate and Other)0.1%
How spread out the customers are
WM's FY2025 10-K says its largest customer was under 5% of 2025 revenue. Shares of FY2025 revenue of $25,204 million, after removing sales between WM's own units: collection 61.2%, landfill and transfer fees 21.0%, healthcare 10.0%, recycled materials 5.9%, energy 1.9%, other 0.1%.
Sources (1)
04How it makes money
How does Waste Management make money?
Profit comes from owning the landfill at the end of the truck route and raising prices.
WM's 10-K says sending its own collected waste to its own sites (internalization) gives higher margins; in Q1 FY2026, 71.7% went to WM sites. Collection and Disposal prices (average yield) rose 3.8% in FY2025. Operating profit per $100 of revenue was $16.5 in FY2021 and $17.1 in FY2025.
Operating profit per $100 of revenue
$16.5$17.1
FY2021 to FY2025
- Trucks collect waste from homes and businesses under contracts and subscriptions
- Waste goes to WM's own transfer stations and landfills
- Other haulers pay tipping fees to use the same landfills
- Landfill gas becomes electricity and renewable natural gas
- Recyclables are sorted and sold
- Cash pays for trucks, landfill space, dividends and buybacks
↺ Step 6 feeds back into step 1.
05Business segments · FY2025
Which businesses make up Waste Management?
Collection and Disposal
82.1%Trash collection, landfills and transfer stations: the East Tier ($9,037 million of revenue, $2,904 million of operating income), the West Tier ($8,718 million, $2,889 million) and ancillary services. Together they earned $5,777 million of operating income in FY2025.
Revenue $20.7B ($20,704M) · Operating profit $5.8B ($5,777M)
Healthcare Solutions
10%Medical waste and secure shredding from the former Stericycle, bought in Nov 2024. It lost $88 million at the operating level in FY2025.
Revenue $2.5B ($2,508M) · Operating profit −$88M
Recycling Processing and Sales
5.9%Sorting and selling recyclables. It lost $80 million in FY2025; the 10-K says single-stream recycled commodity prices were about 20% lower than in 2024.
Revenue $1.5B ($1,492M) · Operating profit −$80M
Renewable Energy
1.9%Electricity and renewable natural gas from landfill gas. It earned $135 million in FY2025.
Revenue $478M · Operating profit $135M
Corporate and Other
0.1%Head-office costs and services outside the segments: $1,436 million of operating costs, net, in FY2025.
Revenue $22M · Operating profit −$1.4B (−$1,436M)
How the mix changed
- Collection and Disposal
- Healthcare Solutions
- Recycling Processing and Sales
- Renewable Energy
- Corporate and Other
Revenue by segment, FY2023 to FY2025.
US$
See the numbers
Sources (1)
06The numbers · Consolidated · US$
How has Waste Management done?
Revenue
$25.2BFY2025
Revenue rose every year, from $17.9 billion in FY2021 to $25.2 billion in FY2025, and FY2025 was the first full year with Healthcare Solutions.
US$
See the numbers
Net income
$2.7BFY2025
Net income rose from $1.82 billion in FY2021 to $2.75 billion in FY2024 and was $2.71 billion in FY2025, when depreciation, depletion and amortization rose to $2,863 million from $2,267 million.
US$
See the numbers
Net income for every $100 of revenue
$10.7FY2025
Net income per $100 of revenue was $10.7 in FY2025, down from $12.4 in FY2024; Q3 FY2025's $9.4 included a $137 million operating loss in Recycling.
Net margin: $ of net income per $100 of revenue
See the numbers
Free cash flow
$2.8BFY2025
Free cash flow was $2.8 billion in FY2025: $6.0 billion of operating cash flow minus $3.2 billion of capital spending (Cityfort calculation from FY2025 10-K); WM's own measure, which adds asset-sale proceeds, was $2.9 billion.
US$ · cash from operations minus spending on plants and equipment
See the numbers
See all yearly numbers
EBITDA here = operating income plus depreciation and amortization (from the cash flow statement). Fiscal years are the company's own: Fiscal year ends Dec 31. Net income is the share belonging to the company's owners.
Learn: Fiscal years that don't end in December: Nvidia's FY2027 explained · Stock-based compensation and dilution: pay that becomes shares
Sources (17)
- FY2021 Form 10-K
- FY2022 Form 10-K
- FY2023 Form 10-K
- FY2024 Form 10-K
- FY2025 Form 10-K
- Q4 FY2024 earnings release (8-K Ex. 99.1)
- Q1 FY2024 Form 10-Q
- Q1 FY2025 earnings release (8-K Ex. 99.1)
- Q2 FY2024 Form 10-Q
- Q3 FY2024 Form 10-Q
- Q1 FY2025 Form 10-Q
- Q2 FY2025 Form 10-Q
- Q3 FY2025 Form 10-Q
- Q4 FY2025 earnings release (8-K Ex. 99.1)
- Q1 FY2026 Form 10-Q
- Q2 FY2026 Form 10-Q
- Q3 FY2026 Form 10-Q
07Who runs it
Who runs Waste Management, and did they deliver?
James C. (Jim) Fish, Jr.
Chief Executive Officer and director · since 2016
Also President from 2016 to May 2025; the only director who is not independent.
John J. Morris, Jr.
President and Chief Operating Officer · since 2025
In the role since May 2025.
David L. Reed
Executive Vice President and Chief Financial Officer · since 2025
CFO since Nov 2025, after Devina A. Rankin, CFO from 2020.
Kathleen M. Mazzarella
Non-Executive Chair of the Board · since 2023
WM has kept the chair and CEO roles separate since 2004.
What they said, and what happened
2 delivered · 1 partly delivered · 3 too early to tell
Said on Feb 9, 2026
The FY2025 10-K says that in Dec 2025 the Board expected to raise the quarterly dividend from $0.825 to $0.945 per share for 2026.
DeliveredWhat happened
The Q3 FY2026 10-Q shows a quarterly dividend of $0.945 per share in 2026.
Said on Jul 28, 2025
Jul 28, 2025: WM narrowed its FY2025 adjusted operating EBITDAOperating profit before wear-and-tear charges (depreciation and amortization). As a margin: per $100 of sales. outlook to $7.475 to $7.625 billion.
DeliveredWhat happened
FY2025 adjusted operating EBITDA was $7,582 million, inside the range.
Said on Oct 27, 2025
Oct 27, 2025: WM expected FY2025 revenue of about $25.275 billion, at the low end of its earlier range.
Partly deliveredWhat happened
FY2025 revenue was $25,204 million, $71 million below that figure.
Said on Jan 28, 2026
Jan 28, 2026: WM expected to buy back about $2 billion of its shares in 2026.
Too early to tellWhat happened
It had repurchased $1,583 million by Sep 30, 2026, and its Oct 27, 2026 release kept the $2 billion expectation.
Said on Jan 28, 2026
Jan 28, 2026: WM gave a 2026 revenue outlook of $26.425 to $26.625 billion.
Too early to tellWhat happened
On Jul 28, 2026 WM lowered it to $26.275 to $26.475 billion, citing lower volume expectations; on Oct 27, 2026 it expected the high end of that range.
Said on Jan 30, 2025
Jan 30, 2025: WM expected $250 million a year of benefits from combining with Stericycle, at the full rate in 2027.
Too early to tellWhat happened
The filings on file give no total for these benefits yet; Healthcare Solutions earned $20 million of operating income in Q3 FY2026.
Sources (9)
- 2026 Proxy Statement (DEF 14A)
- FY2025 Form 10-K
- Q3 FY2026 Form 10-Q
- Q2 FY2025 earnings release (8-K Ex. 99.1)
- Q4 FY2025 earnings release (8-K Ex. 99.1)
- Q3 FY2025 earnings release (8-K Ex. 99.1)
- Q3 FY2026 earnings release (8-K Ex. 99.1)
- Q2 FY2026 earnings release (8-K Ex. 99.1)
- Q4 FY2024 earnings release (8-K Ex. 99.1)
08What could go wrong
What could go wrong for Waste Management?
- Raw-material prices
Recycled material prices
Recycling lost $80 million in FY2025. Its revenue from prices (yield) fell $166 million, and the 10-K says single-stream recycled commodity prices were about 20% lower than in 2024. The 10-K also says these revenues can change substantially without notice.
Watch Recycling segment operating income each quarter ($44 million in Q3 FY2026).
- Execution
Stericycle integration
WM's 10-K lists the risk that it may not get the benefits, growth or cost savings it expected from the Stericycle purchase. Healthcare Solutions lost $88 million at the operating level in FY2025.
Watch Healthcare Solutions operating income, and the $250 million yearly benefit WM gave on Jan 30, 2025.
- Debt
Debt and interest cost
Total debt was $23,370 million on Sep 30, 2026, and net interest expense was $912 million in FY2025, against $598 million in FY2024.
Watch Debt against EBITDA, and the 2.5 to 3.0 times target range WM restated in its Q1 FY2026 release (Apr 28, 2026).
- Legal
Environmental clean-up costs
WM had landfill and environmental remediation liabilities of $3,278 million at Dec 31, 2025, and was named at 75 Superfund sites. The 10-K says its San Jacinto liability could be materially different from the amount recorded.
Watch Changes in remediation liabilities and any cost split set for San Jacinto.
- Regulation
Renewable fuel rules
The 10-K says changes to federal and state renewable fuel policies could affect the Renewable Energy segment. In FY2025, lower prices for renewable fuel credits (RINs) partly offset higher gas and electricity prices.
Watch Renewable Energy revenue ($167 million in Q3 FY2026) and policy changes.
- Demand
Lower volumes
Collection and Disposal volume fell 1.5% in Q1 FY2026, 1.8% in Q2 and 0.4% in Q3. On Jul 28, 2026 WM lowered its 2026 revenue outlook, citing lower volume expectations.
Watch Volume in each quarterly release.
- Other
Labor and fuel costs
About 9,200 employees work under union contracts, and fuel cost $521 million in FY2025. The 10-K lists higher labor costs and diesel prices among its risks.
Watch Operating costs per $100 that came in ($59.49 in FY2025).
09Supporters vs. critics
What do supporters and critics point to?
What supporters point to
- WM owned or operated 257 landfills at the end of 2025, with about 38 years of weighted average remaining life.
- Revenue rose every year from FY2021 to FY2025, to $25.2 billion, and operating cash flow rose from $4.3 billion to $6.0 billion.
- Core price rose 5.8% in Q3 FY2026, and adjusted operating EBITDA rose 5.8%, by WM's own measure.
- The 2026 quarterly dividend of $0.945 is the 23rd consecutive yearly increase, by the 10-K's count.
- No single customer was 5% or more of 2025 revenue.
What critics point to
- Net income was $2.71 billion in FY2025, below $2.75 billion in FY2024, though revenue grew 14.2%.
- Total debt was $23.4 billion on Sep 30, 2026, and net interest expense was $912 million in FY2025, up from $598 million.
- Healthcare Solutions lost $88 million at the operating level in FY2025 on $2,508 million of revenue.
- Collection and Disposal volume fell in Q1, Q2 and Q3 FY2026, and WM cut its 2026 revenue outlook in July 2026.
- Recycling lost $80 million in FY2025, the year single-stream recycled commodity prices fell about 20%.
10What to watch next
What should you watch next at Waste Management?
Next event
Q4 FY2026 results
Date not announced yet.
2026 against WM's outlook
On Oct 27, 2026 WM said it expected 2026 revenue at the high end of $26.275 to $26.475 billion and free cash flowCash from operations minus spending on buildings and equipment. Learn more at the high end of $3.75 to $3.85 billion.
Healthcare Solutions profit
$20 million of operating income in Q3 FY2026, against a $21 million loss in Q3 FY2025 and an $88 million loss in FY2025.
Buybacks
$1,583 million bought in the first nine months of 2026; WM said on Oct 27, 2026 that it still expected about $2 billion for the year.
Volume
Collection and Disposal volume fell 0.4% in Q3 FY2026 while core price rose 5.8%.
11Key facts
Key facts about Waste Management
- What does Waste Management do?
- Waste Management (NYSE: WM) collects and disposes of trash for homes and businesses in the U.S. and Canada, and also recycles, sells landfill-gas energy and handles medical waste. It had $25,204 million of revenue in FY2025.
- How does Waste Management make money?
- Waste Management's Collection and Disposal business, which includes its landfills, earned $5,777 million of operating income in FY2025 on $20,704 million of revenue, 82.1% of the total.
- Who are Waste Management's customers?
- In FY2025, collection from businesses, homes and industrial sites brought Waste Management 61.2% of revenue and landfill and transfer fees 21.0%; its largest customer was under 5% of 2025 revenue.
- How many landfills does Waste Management have?
- Waste Management owned or operated 257 landfills (253 for solid waste and four for hazardous waste) at Dec 31, 2025, and 342 transfer stations, not counting sites from Stericycle.
- How much profit did Waste Management make in FY2025?
- Waste Management's net income was $2,708 million in FY2025, or $6.70 per diluted share, against $2,746 million and $6.81 in FY2024.
- Who owns Waste Management?
- Waste Management has one class of common stock with one vote per share. The 2026 proxy lists The Vanguard Group at 9.0%, William H. Gates III and the Gates Foundation Trust at 7.2% and BlackRock at 7.1%.
- What is Healthcare Solutions at Waste Management?
- Healthcare Solutions is Waste Management's medical waste and document shredding business, from the Stericycle purchase completed on Nov 4, 2024. It had $2,508 million of revenue in FY2025.
- How much debt does Waste Management have?
- Waste Management's total debt was $23,370 million on Sep 30, 2026, against $247 million of cash.
- How many people work at Waste Management?
- Waste Management had about 60,500 full-time employees at Dec 31, 2025, of whom 53,600 were in the U.S.
Terms on this page
- Capital expenditures (capex)
- Debt-to-equity
- Dividend payout ratio
- Earnings per share (EPS)
- EBITDA
- Free cash flow
- Interest coverage
- Net debt
- Net margin
- Revenue vs net income
Each explains the term in plain English, with the same number from other companies on Cityfort.
Go deeper
More detail from the same filings. Open any section.
12What it sells
12What it sells
What does Waste Management sell?
Waste collection
Trucks pick up trash from businesses, homes and industrial sites. Many homes are served under municipal contracts or franchises of three to ten years; some households subscribe monthly. $15,421 million of FY2025 revenue.
Landfills and transfer stations
WM owned or operated 257 landfills and 342 transfer stations (sites where waste is moved to bigger trucks) at the end of 2025. Other haulers pay a tipping fee to dump there. $5,283 million of FY2025 outside revenue.
Healthcare Solutions
Medical waste collection and treatment for hospitals, medical practices, pharmacies and labs, plus secure document shredding, from the former Stericycle. $2,508 million of FY2025 revenue.
Recycling
Sorting and selling paper, cardboard, glass, plastic and metal. $1,492 million of FY2025 revenue.
Renewable energy
Gas from rotting waste in landfills is turned into electricity and renewable natural gas, which also fuels part of WM's own truck fleet. $478 million of FY2025 revenue.
What it does
- Does: Owns most of the landfills its trucks use, and charges other haulers to use them
- Does: Serves the U.S. and Canada; Healthcare Solutions also works in Ireland and the U.K. and shreds documents in nine countries
- Does: Sells recycled materials and energy, whose prices move with commodity markets
What it does not do
- Does not: Does not earn most of its money from recycling: Recycling was 5.9% of FY2025 revenue
- Does not: Is not a government agency, though cities and counties hire it and also compete with it
- Does not: Does not rely on one big customer: its largest customer was under 5% of 2025 revenue
Sources (1)
13How the money flows
13How the money flows · FY2025
How does money flow through Waste Management?
Money in
- Operating revenues$25.2B
- Income from part-owned companies and other, net$30M
The company
Waste Management
$25.2B came in
Money out
- Operating costs (labor, disposal, repairs, fuel, recyclables bought)$15.0B
- Selling, general and administrative$2.7B
- Depreciation, depletion and amortization$2.9B
- Restructuring, impairments, divestitures and unusual items$299M
- Interest, net$912M
- Income tax$717M
- Share of minority partners$1M
- Net income attributable to WM$2.7B
- Customers paid WM $25,204 million in FY2025 for collection, disposal, recycling, energy and medical waste services.
- Running the trucks, landfills, crews and plants cost $15,012 million, and office, sales and management costs another $2,722 million.
- Wear on trucks and the use of landfill space (depreciation and depletion) took $2,863 million, and one-off charges $299 million.
- Net interest cost $912 million, on total debt of $22,907 million at year end, and income tax $717 million.
- $2,708 million was left as net income; WM paid $1,334 million of cash dividends in FY2025.
Sources (1)
14What it needs to run
14What it needs to run
What does Waste Management need to run?
Landfill space and permits
257 landfills at the end of 2025, with a weighted average remaining life of about 38 years. Each must meet federal, state or provincial and local rules from design to closure; the 10-K says the capital needed is a barrier to owning a landfill.
Trucks and transfer stations
342 transfer stations, not counting those from Stericycle. Capital spending was $3,227 million in FY2025, $633 million of it on recycling and renewable energy growth projects.
Drivers and crews
About 60,500 full-time employees at Dec 31, 2025, 53,600 of them in the U.S.; about 9,200 work under union contracts.
Diesel fuel
Fuel cost $521 million in FY2025, net of alternative-fuel tax credits; the 10-K lists diesel shortages and price rises as a risk.
Medical waste plants
Healthcare Solutions has about 307 leased and owned facilities and 51 autoclaves or other treatment units.
Sources (1)
15Where it sells
15Where it sells · FY2025
Where does Waste Management sell?
- United States94.9%
- Canada3.8%
- Western Europe1.3%
Sources (1)
16Where growth could come from
16Where growth could come from
Where could Waste Management's growth come from?
In its Q3 FY2026 earnings release of Oct 27, 2026, WM said it expects 2026 revenue at the high end of its $26.275 to $26.475 billion range, adjusted operating EBITDA within $8.15 to $8.25 billion, and free cash flow at the high end of $3.75 to $3.85 billion.
Higher prices in collection and disposal
WorkingCore price 5.8%, Q3 FY2026
WM's Q3 FY2026 release puts the rise in collection and disposal yield at 3.4%, with volume down 0.4%.
Status: Working, on track against what the company said.
Healthcare Solutions (Stericycle)
Mixed$20M operating income, Q3 FY2026
WM said on Jan 30, 2025 that it expected $250 million a year of benefits from combining the businesses, at the full rate in 2027. The segment lost $88 million in FY2025; Q3 FY2026 revenue rose 3.7%.
Status: Mixed, partly on track.
Renewable natural gas plants
Working$167M revenue, Q3 FY2026 (vs $115M)
WM's Q3 FY2026 release says a New York plant was its 18th renewable natural gas facility since 2022; on Apr 28, 2026 it said it expected six more such plants in 2026.
Status: Working, on track against what the company said.
Automated recycling plants
Mixed$44M operating income, Q3 FY2026
Recycling lost $80 million in FY2025 and $137 million in Q3 FY2025. WM said on Apr 28, 2026 that three recycling facilities started in Q1 FY2026 and four more were expected in 2026.
Status: Mixed, partly on track.
Status compares progress with what the company itself said it would do: Working = on track against what the company said; Mixed = partly on track; Behind = behind the company's own plan; New = recently announced; Early = too early to judge.
17The company's own measures (non-GAAP)
17The company's own measures · FY2025 and Q3 FY2026, unless the row says otherwise
What do Waste Management's own measures show?
Official (GAAP): Income from operations, FY2025
$4.3B
Company's own measure: Adjusted operating EBITDA, FY2025
$7.6B
Adds back $2,863 million of depreciation, depletion and amortization and leaves out items WM lists, such as impairments and Healthcare Solutions integration costs. Old basis, before the 2026 change.
Official (GAAP): Diluted EPS, FY2025
$6.70
Company's own measure: Adjusted EPS, FY2025
$7.50
Leaves out the same listed items, after tax.
Official (GAAP): Income from operations, Q3 FY2026
$1.3B
Company's own measure: Adjusted operating EBITDA, Q3 FY2026
$2.1B
New basis from 2026: landfill accretion (the yearly increase in the recorded cost of closing landfills as closing nears) moved into depreciation and amortization, so it is added back too. On that basis Q3 FY2025 was $2,005 million, against $989 million of income from operations.
Official (GAAP): Diluted EPS, Q3 FY2026
$2.05
Company's own measure: Adjusted EPS, Q3 FY2026
$2.15
Q3 FY2025 was $1.98 adjusted and $1.49 reported.
Official (GAAP): Net cash from operating activities, FY2025
$6.0B
Company's own measure: Free cash flow (WM's definition), FY2025
$2.9B
Operating cash flow minus $3,227 million of capital spending plus $121 million of proceeds from selling businesses and assets. The page's own free cash flow leaves out those proceeds.
These are the company's own measures, defined by the company. They are not comparable across companies, and they are not added together. Each sits beside the nearest official (GAAP) figure.
Learn: Non-GAAP measures: what a company's "adjusted" numbers leave out
18Financial strength and debt
18Financial strength · Sep 30, 2026
How much debt does Waste Management have?
- Total debt$23.4B
- Cash and investments$247M
- Net debt (debt minus cash)$23.1B
- Net worth (shareholders' money)$9.9B
- Debt to equity
- 2.4×
- $ of debt for every $1 of shareholders' money
- Interest cover
- 4.7×
- how many times operating profit covers interest
- Net debt of $23,123 million is total debt minus cash (Cityfort calculation from the Q3 FY2026 10-Q). At Dec 31, 2025 it was $22,706 million, 3.17 times FY2025 EBITDA of $7,171 million (Cityfort calculation from FY2025 10-K).
- Net debt to operating cash flow of 3.8 and debt to equity of 2.4 (on WM stockholders' equity of $9,867 million) are Cityfort calculations from the Q3 FY2026 10-Q and FY2025 10-K.
- Interest cover of 4.7 is FY2025 income from operations of $4,308 million ÷ net interest expense of $912 million (Cityfort calculation from FY2025 10-K). Net interest expense was $598 million in FY2024.
- WM's Q1 FY2026 earnings release says its leverage ratio, as its credit facility defines it, returned to its target range of 2.5 to 3.0 times total debt to EBITDA.
- About $3.7 billion of debt was due within 12 months at Dec 31, 2025; $3.0 billion of it is classed as long-term because a $3.5 billion revolving credit facility runs to May 2029.
- WM's FY2025 10-K shows landfill and environmental remediation liabilities, for closing and cleaning up sites, of $3,278 million at Dec 31, 2025.
19Who owns it
19Who owns it · ownership as of Mar 17, 2026
Who owns Waste Management?
- Officers and directors (as a group), shares
- 0.2%
Share classes
Holders of 5% or more
From the company's proxy statement (DEF 14A), later Schedule 13G filings and the share counts on its latest annual or quarterly report. Each holder row shows the date of its own filing.
Learn: How to read a proxy statement (DEF 14A): Nvidia's 2026 proxy · Form 4 insider filings: who files, the codes and the footnotes
20What it does with profit
20What it does with profit
What does Waste Management do with its profit?
Dividend per share
$3.30FY2025
Dividend paid for each share, by financial year.
$ per share
See the numbers
Buyback · Dec 31, 2023
Common stock repurchased in FY2023.
$1.3B
Buyback · Dec 31, 2024
Common stock repurchased in FY2024.
$262M
Buyback · Sep 30, 2026
Common stock repurchased in the first nine months of FY2026; none in FY2025.
$1.6B
21Governance signals
21Governance signals
What do Waste Management's governance filings show?
- Auditor
- Ernst & Young LLP
- Auditor changes
- None in the period covered
- Audit qualifications
- None reported
- Related-party dealings
- WM's 2026 proxy describes a written Related Party Transactions Policy: the Nominating and Governance Committee reviews deals above $120,000 in which a director, executive officer, their family or a 5% holder has a material interest.
- Credit rating
- Not checked for this page
Flags to know about
other
Independent chair and board
Kathleen M. Mazzarella has been Non-Executive Chair since May 2023, and eight of the nine director nominees are independent under NYSE standards; CEO Jim Fish is the ninth.
regulatory
Superfund sites
At Dec 31, 2025, WM had been notified as a potentially responsible party at 75 sites on the EPA's National Priorities List, 14 of which it owns. The 10-K says no environmental matter above its $1 million disclosure threshold required disclosure at year end 2025.
regulatory
San Jacinto River Waste Pits
A WM subsidiary and International Paper signed an EPA order in 2018 for this Texas site, and the EPA approved a revised clean-up design in Sep 2025. The 10-K says the subsidiary's share of the cost is not yet set and its liability could be materially different from the amount recorded.
regulatory
Federal investigation of a former Stericycle business
WM's FY2025 10-K (Feb 9, 2026) says the DEA served Stericycle with an administrative subpoena in Feb 2020 and executed warrants at two of its facilities over its retail controlled-substances collection business, divested in 2020; the U.S. Attorney's Office for the Eastern District of California has since overseen criminal and civil investigations and has asserted that Stericycle and some current or former employees may have civil and criminal liability. The 10-K says Stericycle has cooperated, the outcome remains uncertain, and WM does not currently believe it will have a material adverse effect.
other
Securities class action settled
According to WM's FY2025 10-K, a class action filed in Jun 2022 on behalf of buyers of WM senior notes issued in May 2019 alleged misrepresentations and omissions about the expected timing of the Advanced Disposal acquisition; on Dec 18, 2025 the court granted final approval of a settlement, which the company says will be covered by insurance and will not have a material adverse effect.
22How it got here
22How it got here
How did Waste Management get here?
1987
Milestone
Starts as USA Waste Services
Incorporated in Oklahoma; it moved its incorporation to Delaware in 1995.
1998
Business-model change
Merges with Waste Management
USA Waste merged with the Illinois-based Waste Management, Inc., now the subsidiary WM Holdings.
2004
Milestone
Chair and CEO roles split
WM has kept the two roles separate since 2004.
2016
Milestone
Jim Fish becomes CEO
He was also President until May 2025.
2024
Business-model change
Buys Stericycle
Completed on Nov 4, 2024 at $62.00 a share in cash, an enterprise value of $7.2 billion. It added medical waste and document shredding as Healthcare Solutions.
2025
Milestone
New President and CFO
John J. Morris, Jr. became President and COO in May 2025, and David L. Reed became CFO in Nov 2025.
2026
Milestone
Buybacks restart
After none in 2025, WM resumed buybacks in Feb 2026 under a $3.0 billion authorization and bought $1,583 million in nine months.
2026
Milestone
18th renewable natural gas plant
WM's Q3 FY2026 release says a New York plant was its 18th renewable natural gas facility since 2022.
23Sources and changes
Where every number on this page comes from
Sources (23 documents)
- S1FY2025 Form 10-K · SEC EDGAR · Tier 1: company or exchange filing · Feb 9, 2026
- S2FY2024 Form 10-K · SEC EDGAR · Tier 1: company or exchange filing · Feb 19, 2025
- S3FY2023 Form 10-K · SEC EDGAR · Tier 1: company or exchange filing · Feb 13, 2024
- S4FY2022 Form 10-K · SEC EDGAR · Tier 1: company or exchange filing · Feb 7, 2023
- S5FY2021 Form 10-K · SEC EDGAR · Tier 1: company or exchange filing · Feb 15, 2022
- S6Q3 FY2026 Form 10-Q · SEC EDGAR · Tier 1: company or exchange filing · Oct 28, 2026
- S7Q2 FY2026 Form 10-Q · SEC EDGAR · Tier 1: company or exchange filing · Jul 29, 2026
- S8Q1 FY2026 Form 10-Q · SEC EDGAR · Tier 1: company or exchange filing · Apr 29, 2026
- S9Q3 FY2025 Form 10-Q · SEC EDGAR · Tier 1: company or exchange filing · Oct 28, 2025
- S10Q2 FY2025 Form 10-Q · SEC EDGAR · Tier 1: company or exchange filing · Jul 29, 2025
- S11Q1 FY2025 Form 10-Q · SEC EDGAR · Tier 1: company or exchange filing · Apr 29, 2025
- S12Q3 FY2024 Form 10-Q · SEC EDGAR · Tier 1: company or exchange filing · Oct 28, 2024
- S13Q2 FY2024 Form 10-Q · SEC EDGAR · Tier 1: company or exchange filing · Jul 25, 2024
- S142026 Proxy Statement (DEF 14A) · SEC EDGAR · Tier 1: company or exchange filing · Mar 31, 2026
- S15Q3 FY2026 earnings release (8-K Ex. 99.1) · SEC EDGAR · Tier 1: company or exchange filing · Oct 27, 2026
- S16Q2 FY2026 earnings release (8-K Ex. 99.1) · SEC EDGAR · Tier 1: company or exchange filing · Jul 28, 2026
- S17Q1 FY2026 earnings release (8-K Ex. 99.1) · SEC EDGAR · Tier 1: company or exchange filing · Apr 28, 2026
- S18Q4 FY2025 earnings release (8-K Ex. 99.1) · SEC EDGAR · Tier 1: company or exchange filing · Jan 28, 2026
- S19Q3 FY2025 earnings release (8-K Ex. 99.1) · SEC EDGAR · Tier 1: company or exchange filing · Oct 27, 2025
- S20Q2 FY2025 earnings release (8-K Ex. 99.1) · SEC EDGAR · Tier 1: company or exchange filing · Jul 28, 2025
- S21Q1 FY2025 earnings release (8-K Ex. 99.1) · SEC EDGAR · Tier 1: company or exchange filing · Apr 28, 2025
- S22Q4 FY2024 earnings release (8-K Ex. 99.1) · SEC EDGAR · Tier 1: company or exchange filing · Jan 30, 2025
- S23Q1 FY2024 Form 10-Q · SEC EDGAR · Tier 1: company or exchange filing · Apr 25, 2024
Changes to this page (v1 · Nov 19, 2026)
- v1 · Nov 19, 2026First version. (first version)
Numbers come only from tier 1 and tier 2 sources. Read how we research.
Disclaimer
For learning only. Cityfort is not a registered investment adviser or broker-dealer and does not recommend buying or selling any security. Prices shown are dated and may be out of date.
Investing in securities involves risk, including loss of capital. Before making any investment decision, do your own research and consider consulting a registered investment adviser or other qualified professional.
Cityfort, its owners and contributors may or may not hold securities of companies covered. Cityfort is not paid by any company it covers. Content is not an offer or solicitation to buy or sell any security, including in any initial public offering.
Read the positions policyRead the full disclaimerHide the full disclaimer
Cityfort publishes general educational content that explains how listed companies work. Cityfort is not registered with the US Securities and Exchange Commission or any state securities regulator as an investment adviser, and is not a broker-dealer or a member of FINRA. Cityfort does not provide investment, tax or legal advice, recommendations, ratings, price targets or any opinion on whether to buy, sell or hold any security. Nothing on the site is tailored to any person's circumstances.
All information is taken from publicly available sources, mainly company filings with the SEC, which are listed on each page with dates. We work to keep it accurate and correct errors publicly, but we do not guarantee that it is complete, accurate or up to date. Any market price or price-based ratio shown is dated, may be out of date by the time you read it, and is included only to explain concepts.
Statements by company management, including forward-looking statements and guidance, are reported as the company's statements, with their date and source; they are not our forecasts. Adjusted (non-GAAP) figures are the company's own measures and are shown next to the official (GAAP) figures.