Materials · NYSE: NEM
Newmont: how the business works
Newmont mines gold, plus copper, silver, zinc and lead, in nine countries, with sales of $22.7 billion in FY2025.
By Hardik Bhandare · Checked against filings: . Editorial policy. Corrections
Follow Newmont
Email me when Newmont's page is updated after earnings.
We'll send a confirmation email first. See our privacy policy.
Newmont Corporation · Denver, Colorado · Founded 1921
Updated for Q3 FY2026 · checked
- Sales, FY2025
- $22.7B
- Net income attributable to Newmont, FY2025
- $7.1B
- Attributable gold produced, FY2025
- 5.9 million ounces
- Attributable gold reserves, Dec 31, 2025
- 118.2 million ounces
- Employees, Dec 31, 2025
- About 17,500
The short version
Newmont in 5 points
1 · What it sells
Newmont mines gold, plus copper, silver, zinc and lead, at 12 mines it runs and through its 38.5% share of Nevada Gold Mines, with FY2025 sales of $22,669 million.
2 · Who pays it
Newmont sells to bullion banks, traders and smelters; in FY2025 gold made 85.2% of sales, copper 6.3%, silver 4.8%, zinc 2.9% and lead 0.8%.
3 · What it keeps from $100
Of every $100 that came in during FY2025, Newmont kept $28.6 as net income, including gains on mines it sold and on investments; sales minus operating costs, leaving out that gain and impairments, was $10,737 million, or 47.4% of sales (Cityfort calculation from the FY2025 10-K).
4 · Where the operating profit comes from
Nevada Gold Mines made 16.1% of the $10,534 million pre-tax income of Newmont's 13 segments in FY2025, Peñasquito in Mexico 14.9% and Cadia in Australia 12.9%, before corporate costs.
5 · The one thing to watch
Newmont's average realized gold price was $4,900 an ounce in Q1 FY2026 and $4,317 in Q3 FY2026, and its net income was $3,262 million and $2,475 million.
Sources: From Newmont's FY2025 10-K and Q3 FY2026 earnings release · checked
See the full receipt and the management scorecard below
01Where the money goes · FY2025
Where does $100 of Newmont's money go?
Newmont · FY2025
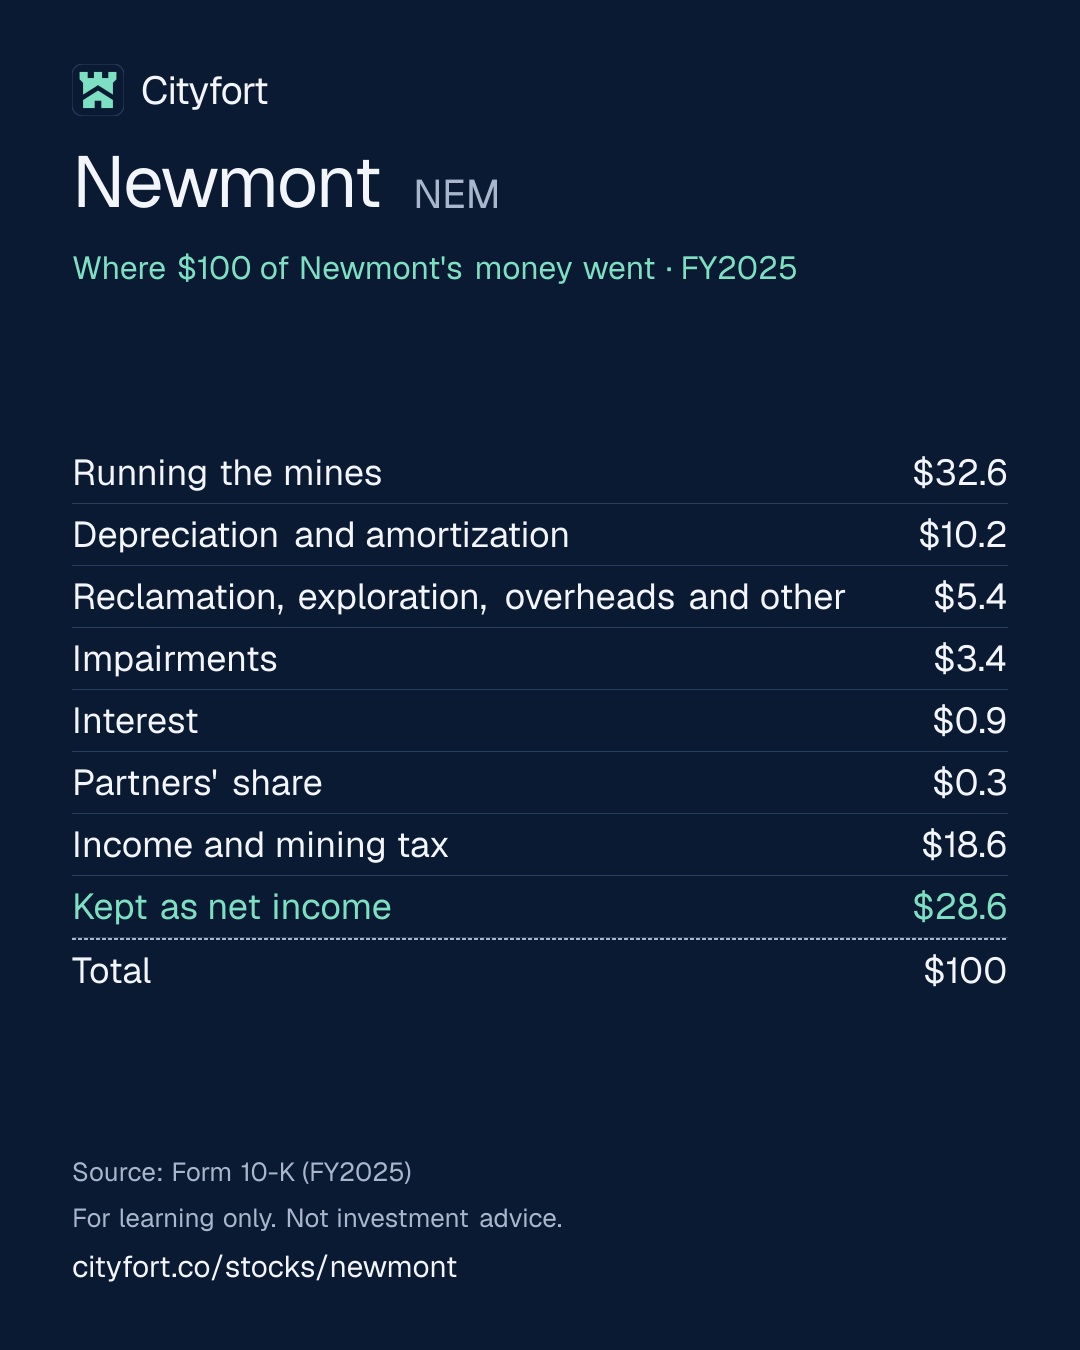
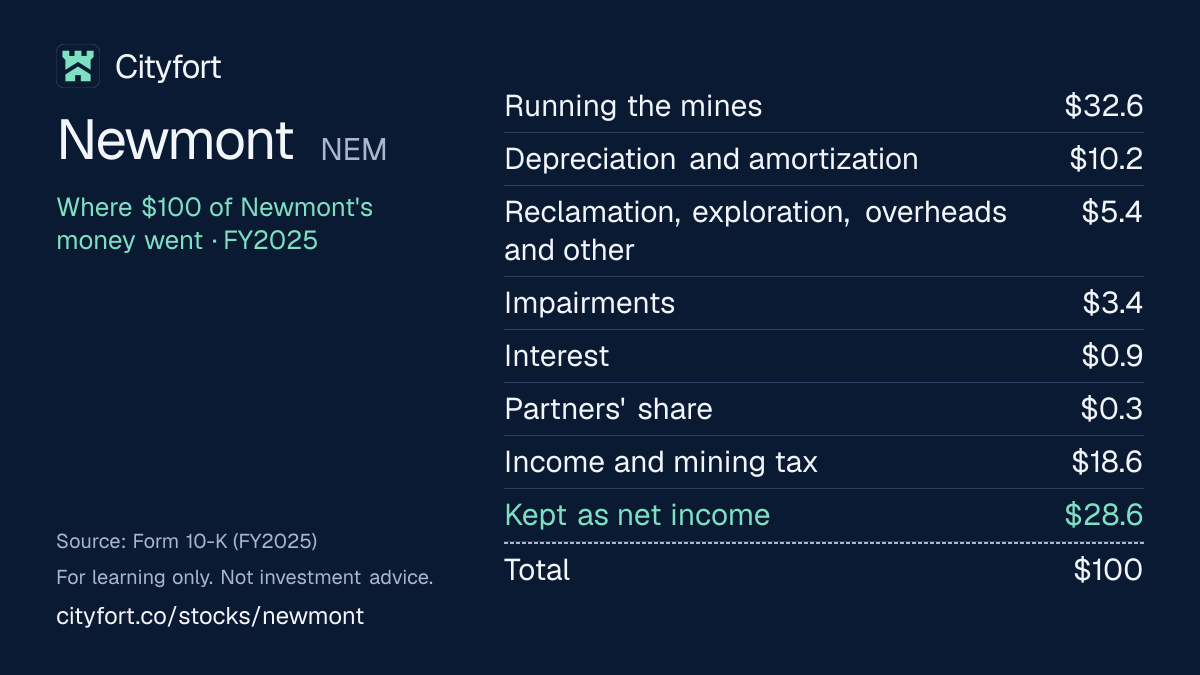
Receipt for every $100
| Running the mines | $32.6 |
|---|---|
| Depreciation and amortization | $10.2 |
| Reclamation, exploration, overheads and other | $5.4 |
| Impairments | $3.4 |
| Interest | $0.9 |
| Partners' share | $0.3 |
| Income and mining tax | $18.6 |
| Kept as net income | $28.6 |
| Total | $100 |
Each line = amount ÷ total money in × 100. Lines may not add to exactly $100 because of rounding.
How this is worked out
Cityfort calculation from the FY2025 10-K. Of every $100 that came in during FY2025: each line ÷ total money in of $24,766 million (sales $22,669 million + $1,066 million gain on mines sold + $604 million gain on investments + $421 million share of profit from partly owned mines + $6 million other income). Net income includes those gains. Newmont has no operating income line: sales minus costs and expenses was $10,961 million, or 48.4% of sales; leaving out the gain on mines sold and $842 million of impairments, it was $10,737 million, or 47.4% of sales.
Save this receipt as an image:
1080 × 1350 PNG for Instagram, LinkedIn1200 × 675 PNG for X
Embed this receipt
Paste this code into a blog or website to show the receipt, with a link back to this page:
Each week: one company explained in 5 points, picked by earnings date.
Free, no tips, unsubscribe anytime.
We'll send a confirmation email. See our privacy policy.
02The business in one line
What does Newmont do?
Banks, traders and smelters pay Newmont for gold and other metals at market prices; most of the money goes on running its mines, wear on them and tax, and what is left moves with the gold price.
- In FY2025, gold made 85.2% of Newmont's sales, copper 6.3%, silver 4.8%, zinc 2.9% and lead 0.8%.
- Of every $100 that came in during FY2025, $32.6 went on running its mines and $28.6 was left as net income.
03Who pays it
Who pays Newmont?
Buyers of gold
85%
of revenue
Bullion banks and traders paid $19,304 million in FY2025.
Buyers of copper
6%
of revenue
Smelters and traders paid $1,438 million for copper concentrate in FY2025.
Buyers of silver
5%
of revenue
Paid $1,080 million in FY2025, including $84 million of non-cash streaming revenue from Wheaton.
Buyers of zinc
3%
of revenue
Paid $664 million in FY2025.
Buyers of lead
1%
of revenue
Paid $183 million in FY2025.
- Buyers of gold85%
- Buyers of copper6%
- Buyers of silver5%
- Buyers of zinc3%
- Buyers of lead1%
Customer concentration
Standard Chartered bought $6,009 million, 27% of FY2025 sales, and JPMorgan Chase $2,499 million, 11%. Newmont says gold can be sold through many traders worldwide, so it is not dependent on a limited number of customers. By customer location, the UK, home of the London gold market, took 57.6% of sales and the US none.
- Largest customer
- 27%
04Why it makes money
Why does Newmont make money?
Newmont's profit moves with the gold price, which it does not set, while its cost per ounce moves more slowly.
Its average realized gold price rose from $1,788 an ounce in FY2021 to $3,498 in FY2025. Gold costs applicable to sales per ounce (co-product basis) rose from $785 to $1,199, so the gap per ounce went from $1,003 to $2,299 (Cityfort calculation from the FY2023 and FY2025 10-Ks).
Net income per $100 of sales
$9.5$31.3
FY2021 to FY2025
- Newmont spends on pits, tunnels, mills and equipment.
- The mines produce gold and other metals, sold at world market prices.
- A higher gold price lifts profit; a lower one cuts it.
- Cash pays for new mine phases, dividends and buybacks.
- Mining uses up reserves, so exploration and new projects have to continue.
↺ Step 5 feeds back into step 1.
05Business segments · FY2025
Which businesses make up Newmont?
Nevada Gold Mines (38.5%, US)
16%Newmont's 38.5% share of a joint venture run by Barrick. Pre-tax income of $1,697 million in FY2025, 16.1% of the 13 segments' $10,534 million (Cityfort calculation from the FY2025 10-K).
Revenue $3.6B
Peñasquito (Mexico)
15%Gold, silver, zinc and lead; all of Newmont's silver, zinc and lead. Pre-tax income of $1,567 million, 14.9% of the segments' total.
Revenue $3.4B
Cadia (Australia)
10%Gold and copper; $885 million of its sales were copper. Pre-tax income of $1,359 million, 12.9%.
Revenue $2.3B
Ahafo South (Ghana)
10%Gold. Pre-tax income of $1,210 million, 11.5%.
Revenue $2.3B
Boddington (Australia)
10%Gold and copper; $258 million of its sales were copper. Pre-tax income of $1,234 million, 11.7%.
Revenue $2.2B
Lihir (Papua New Guinea)
9%Gold from an island mine. Pre-tax income of $999 million, 9.5%.
Revenue $2.0B
Yanacocha (Peru)
8%Gold. Pre-tax income of $497 million, 4.7%. Newmont wrote down $770 million at Yanacocha in FY2025 after dropping its Sulfides project from the mine plan.
Revenue $1.8B
Tanami (Australia)
6%Underground gold mine, where the Tanami Expansion 2 project is being built. Pre-tax income of $761 million, 7.2%.
Revenue $1.4B
Merian (Suriname, 75%)
4%Gold; a partner owns the other 25%. Pre-tax income of $353 million, 3.4%.
Revenue $846M
Brucejack (Canada)
4%Gold. Pre-tax income of $267 million, 2.5%.
Revenue $824M
Cerro Negro (Argentina)
3%Gold. Pre-tax income of $200 million, 1.9%.
Revenue $691M
Red Chris (Canada, 70%)
2%Gold and copper; $295 million of its sales were copper. Pre-tax income of $167 million, 1.6%.
Revenue $513M
Ahafo North (Ghana)
1%New gold mine, in commercial production since Oct 2025. Pre-tax income of $223 million, 2.1%.
Revenue $242M
Mines sold during 2025
3%CC&V, Musselwhite, Porcupine, Éléonore and Akyem, owned for part of the year. Their $1,147 million of pre-tax income includes gains on sale and is outside the 13 segments' total; corporate costs of $339 million are also outside it.
Revenue $628M
06The numbers · Consolidated · US$
How has Newmont done?
Revenue
$22.7BFY2025
Sales rose from $11.8 billion in FY2023 to $18.7 billion in FY2024, the first full year with Newcrest's mines, and $22.7 billion in FY2025 as the gold price rose.
US$
See the numbers
Net profit
$7.1BFY2025
Net income went from a $2.5 billion loss in FY2023, a year with $1.9 billion of impairments, to $7.1 billion in FY2025 and $2.5 billion in Q3 FY2026 alone.
US$
See the numbers
Profit kept per $100 of revenue
$31.3FY2025
Newmont kept $31.3 of net income per $100 of sales in FY2025, against $9.5 in FY2021; EBITDA is blank because its income statement has no operating income line.
$ of profit per $100 of revenue (net margin)
See the numbers
Free cash flow
$7.3BFY2025
Free cash flow, cash from continuing operations minus spending on mines (also the company's own definition), was $7.3 billion in FY2025, up from $88 million in FY2023.
US$ · cash from operations minus spending on plants and equipment
See the numbers
See all yearly numbers
EBITDA here = operating income plus depreciation and amortization (from the cash flow statement). Fiscal years are the company's own (Fiscal year ends on December 31 (the calendar year)). Net profit is the share belonging to the company's owners. Total net income differs from net profit to the company's owners: Total net income was $233 million. Minority partners, mainly the holders of 48.65% of the Yanacocha mine in Peru, took a net $933 million share of losses, so income attributable to Newmont was higher.
Download Newmont's yearly and quarterly numbers (CSV, with source ids)
Learn: Stock-based compensation and dilution: pay that becomes shares
Sources (6)
- Form 10-K, fiscal year 2023 (ended Dec 31, 2023)
- Form 10-K, fiscal year 2022 (ended Dec 31, 2022)
- Form 10-K, fiscal year 2025 (ended Dec 31, 2025)
- Q4 and full-year 2024 earnings release and 2025 guidance (Form 8-K, Exhibit 99.1)
- Q3 2026 earnings release (Form 8-K, Exhibit 99.1)
- Form 10-Q, Q3 FY2026 (quarter ended Sep 30, 2026)
07Who runs it
Who runs Newmont, and did they deliver?
Natascha Viljoen
President and Chief Executive Officer · since 2026
Became CEO and joined the board on Jan 1, 2026; previously President and Chief Operating Officer. She succeeded Tom Palmer, who stayed as an adviser until Mar 31, 2026.
Mark Rodgers
Executive Vice President and Chief Operating Officer · since 2026
Took the role on Jul 1, 2026; previously Managing Director of Newmont's Africa Asia Pacific business unit.
What they said, and what happened
1 delivered · 4 too early to tell
Said on Feb 20, 2025
Newmont said on Feb 20, 2025 that it expected 2025 attributable gold production of 5.9 million ounces, at a gold all-in sustaining cost (co-product) of $1,630 an ounce.
DeliveredWhat happened
FY2025 attributable production was 5,889 thousand ounces, and the cost was $1,609 an ounce.
Said on Feb 19, 2026
Newmont said in its FY2025 10-K that it expected Tanami Expansion 2 to reach commercial production in the second half of 2027.
Too early to tellWhat happened
On Oct 22, 2026 the company moved this to the first half of 2027, after finishing shaft construction.
Said on Feb 19, 2026
Newmont said on Feb 19, 2026 that it expected 2026 attributable gold production of 5,260 thousand ounces.
Too early to tellWhat happened
Production was 3.90 million attributable ounces in the first nine months; the company said on Oct 22, 2026 that it was on track.
Said on Feb 19, 2026
Newmont said on Feb 19, 2026 that it expected a 2026 gold by-product all-in sustaining cost of $1,680 an ounce.
Too early to tellWhat happened
It lowered the guidance to $1,520 on Oct 22, 2026; the first nine months were $1,365.
Said on Feb 19, 2026
Newmont said on Feb 19, 2026 that it planned to pay about $1.1 billion a year in dividends.
Too early to tellWhat happened
It paid $831 million in dividends in the first nine months of 2026.
Sources (6)
- Form 8-K, Exhibit 99.1: CEO Tom Palmer to retire; Natascha Viljoen named successor
- Form 8-K, Item 5.02: executive appointments (Chief Operating Officer Mark Rodgers from Jul 1, 2026)
- Q4 and full-year 2024 earnings release and 2025 guidance (Form 8-K, Exhibit 99.1)
- Form 10-K, fiscal year 2025 (ended Dec 31, 2025)
- Q3 2026 earnings release (Form 8-K, Exhibit 99.1)
- Q4 and full-year 2025 earnings release and 2026 guidance (Form 8-K, Exhibit 99.1)
08What could go wrong
What could go wrong for Newmont?
- Raw-material prices
The gold price drives results
Newmont's average realized gold price was $4,900 an ounce in Q1 FY2026 and $4,317 in Q3 FY2026; net income was $3,262 million and $2,475 million. The 10-K names lower metal prices as its first risk.
Watch The realized gold price and net income in each earnings release.
- Execution
Production and reserves must be replaced
Attributable gold production fell from 6,849 thousand ounces in FY2024 to 5,889 thousand in FY2025, partly because mines were sold. The company guided 5,260 thousand for 2026 on Feb 19, 2026.
Watch Attributable reserves in the FY2026 10-K (118.2 million ounces at Dec 31, 2025).
- Other
Mine closure costs
Reclamation and remediation liabilities were $7,190 million at Dec 31, 2025, $3,906 million of it for Yanacocha in Peru. Reclamation and remediation costs of $1,533 million in FY2023, including a $1,101 million increase at Yanacocha, helped turn that year into a loss.
Watch Reclamation charges in each 10-Q; Q3 FY2026 was $199 million.
- Governance
A partner runs Nevada Gold Mines
Barrick runs Nevada Gold Mines, 16.1% of Newmont's FY2025 segment pre-tax income. Newmont alleged mismanagement there in Jan 2026; a settlement in Aug 2026 commits Newmont to pay Barrick $1.95 billion.
Watch The payment and Nevada Gold Mines' segment income in each 10-Q.
- Regulation
Taxes and rules in host countries
Ghana's tax stability agreement expired at the end of 2025: the gold royalty became a 5% to 12% sliding scale in March 2026 and the top income tax rate rose to 35%. The 10-K also names political and tax risk in Peru, Suriname, Argentina, Papua New Guinea, Mexico and Canada.
Watch Income and mining tax in each quarter: $839 million in Q3 FY2026.
- Execution
Accidents and disruptions at mines
Seismic events at Cadia in April 2026 cut Q2 FY2026 copper output 43% from Q1, and gold by-product all-in sustaining cost rose to $1,621 an ounce in that quarter.
Watch Cadia's segment income: $171 million in Q3 FY2026.
- Legal
Lawsuits
Cadia faces a landholder class action filed in Feb 2026 alleging contamination, and shareholder derivative suits were pending in US federal courts; a related securities class action was dismissed in Sep 2026.
Watch The contingencies note in each 10-Q.
Sources (6)
- Q3 2026 earnings release (Form 8-K, Exhibit 99.1)
- Form 10-K, fiscal year 2025 (ended Dec 31, 2025)
- Q4 and full-year 2025 earnings release and 2026 guidance (Form 8-K, Exhibit 99.1)
- Form 8-K, Item 1.01: amended Nevada Gold Mines joint venture agreement with Barrick
- Form 10-Q, Q3 FY2026 (quarter ended Sep 30, 2026)
- Q2 2026 earnings release (Form 8-K, Exhibit 99.1)
09Both sides
What do supporters and critics point to?
What supporters point to
- Net income rose from $3,348 million in FY2024 to $7,085 million in FY2025, as the average realized gold price rose from $2,408 to $3,498 an ounce.
- Net debt of $5,353 million at end-2024 became net cash of $3.2 billion on Sep 30, 2026, as the company states it.
- Moody's upgraded Newmont to A3 in Aug 2025, as announced by the company.
- The company says its share count fell by over 115 million shares, about 10%, since Feb 2024.
- Ahafo North in Ghana began commercial production in Oct 2025 and made $179 million of pre-tax income in Q3 FY2026.
What critics point to
- Attributable gold production fell from 6,849 thousand ounces in FY2024 to 5,889 thousand in FY2025; the company guided 5,260 thousand for 2026 on Feb 19, 2026.
- Gold all-in sustaining cost (co-product, the company's measure) rose from $1,062 an ounce in FY2021 to $1,609 in FY2025.
- Mine closure liabilities were $7,190 million at end-2025, $3,906 million of it for Yanacocha in Peru.
- Newmont booked $1,891 million of impairments in FY2023 and $842 million in FY2025.
- Newmont does not run Nevada Gold Mines, 16.1% of its FY2025 segment pre-tax income, and alleged mismanagement there in Jan 2026.
10What to watch next
What should you watch next at Newmont?
Next event
Q4 FY2026 results
Date not announced yet.
Gold price and profit
Newmont's average realized gold price was $4,900 an ounce in Q1 FY2026 and $4,317 in Q3 FY2026, and its net income was $3,262 million and $2,475 million.
Full-year 2026 production
Newmont produced 3.90 million attributable ounces in the first nine months of 2026. It said on Oct 22, 2026 that it was on track for its 5,260 thousand ounce guidance.
The $1.95 billion Nevada payment
Newmont pays Barrick $1.95 billion within 30 days of Fourmile's contribution to Nevada Gold Mines, which it expected in Q4 2026. Net cash was $3.2 billion on Sep 30, 2026.
11Key dates
What are the key dates for Newmont?
| Event | Date | Source |
|---|---|---|
| Payment of the $0.26 quarterly dividendTo holders of record on Nov 25, 2026. | Q3 2026 earnings release (Form 8-K, Exhibit 99.1) | |
| Payment of $1.95 billion to Barrick for Nevada Gold MinesDue within 30 days of Barrick contributing Fourmile, which Newmont expected in Q4 2026. | Not yet stated | Form 8-K, Item 1.01: amended Nevada Gold Mines joint venture agreement with Barrick; Q3 2026 earnings release (Form 8-K, Exhibit 99.1) |
12Key facts
Key facts about Newmont
- What does Newmont do?
- Newmont mines gold, and also copper, silver, zinc and lead. At the end of 2025 Newmont ran 12 mines in Papua New Guinea, Australia, Ghana, Suriname, Argentina, Peru, Mexico and Canada, and owned 38.5% of Nevada Gold Mines in the US, which Barrick runs. Newmont's FY2025 sales were $22,669 million.
- How does Newmont make money, and what is its business model?
- Newmont's business model is digging up ore, turning it into gold bars or metal concentrate, and selling the metal at market prices. In FY2025 gold made $19,304 million, or 85.2%, of Newmont's $22,669 million of sales, at an average realized price of $3,498 an ounce.
- Is Newmont profitable?
- Newmont's net income was $7,085 million in FY2025 and $3,348 million in FY2024, after net losses of $429 million in FY2022 and $2,494 million in FY2023, years with large write-downs. Newmont's net income in the first nine months of FY2026 was $7,939 million.
- What is Newmont's revenue by segment?
- Newmont reports 13 segments: 12 mines it runs plus its share of Nevada Gold Mines. Of Newmont's FY2025 sales of $22,669 million, Nevada Gold Mines made $3,560 million (15.7%), Peñasquito in Mexico $3,419 million (15.1%) and Cadia in Australia $2,294 million (10.1%). Mines sold during 2025 made $628 million.
- Who are Newmont's customers?
- Newmont sells gold through bullion banks and traders and says it is not dependent on a limited number of customers. In FY2025 Standard Chartered bought $6,009 million, 27% of Newmont's sales, and JPMorgan Chase $2,499 million, 11%. Buyers located in the UK paid 57.6% of Newmont's FY2025 sales.
- Who owns Newmont?
- Newmont is widely held, with one class of common stock. Vanguard Capital Management reported 7.70% of Newmont at Mar 31, 2026 (Schedule 13GA filing by anyone who owns more than 5% of a company's shares and does not seek control. Learn more filed Apr 29, 2026), and the 2026 proxy lists BlackRock at 8.70%. Newmont's directors and executive officers as a group held less than 1% on Mar 16, 2026.
- How much gold does Newmont produce?
- Newmont produced 5,889 thousand attributable ounces of gold in FY2025, down from 6,849 thousand in FY2024, when it still owned mines it sold in 2024 and 2025. Newmont produced 1.30 million attributable ounces in Q3 FY2026. Its attributable proven and probable gold reserves were 118.2 million ounces at Dec 31, 2025.
- How much of Newmont's sales come from copper, silver, zinc and lead?
- In FY2025 Newmont sold $1,438 million of copper (6.3% of sales), $1,080 million of silver (4.8%), $664 million of zinc (2.9%) and $183 million of lead (0.8%). All of Newmont's FY2025 silver, zinc and lead sales came from Peñasquito in Mexico, and its copper from Cadia, Boddington and Red Chris.
- How much does Newmont pay in dividends and buybacks?
- Newmont declared dividends of $1.01 a share for FY2025 and paid $1,106 million in dividends. Newmont bought back $2,303 million of its shares in FY2025 and $5,241 million in the first nine months of FY2026.
- How much debt does Newmont have?
- On Sep 30, 2026 Newmont had $5,087 million of debt and $497 million of leases and other financing, against $8,827 million of cash. Newmont's Q3 FY2026 earnings release states net cash of $3.2 billion.
Terms on this page
- Capital expenditures (capex)
- Customer concentration
- Debt-to-equity
- Earnings per share (EPS)
- Free cash flow
- Market cap
- Net debt
- Net margin
- P/E ratio
- Revenue vs net income
Each explains the term in plain English, with the same number from other companies on Cityfort.
Go deeper
More detail from the same filings. Open any section.
13What it sells
13What it sells
What does Newmont sell?
Gold
Its main product: $19,304 million of FY2025 sales, or 85.2%. It produced 5,889 thousand attributable ounces in FY2025, at an average realized price of $3,498 an ounce.
Copper
Sold in concentrate from Cadia, Boddington and Red Chris: $1,438 million of FY2025 sales, or 6.3%, from 296 million pounds produced.
Silver
All from Peñasquito in Mexico: $1,080 million of FY2025 sales, or 4.8%. A quarter of Peñasquito's silver goes to Wheaton under a streaming deal, an advance payment for future metal.
Zinc and lead
Also from Peñasquito: $664 million of zinc (2.9%) and $183 million of lead (0.8%) in FY2025.
Stakes in other mines
It owns 40% of Pueblo Viejo in the Dominican Republic and 32% of Lundin Gold in Ecuador. Its share of their profit, $421 million in FY2025, is not in sales.
Think of it like this
It works like a farm selling its harvest at the market price: it controls how much it digs and what that costs, but not the price.
What it does
- Does: Sells most gold as refined bullion: doré bars made $14,330 million of FY2025 sales, concentrate and other $8,339 million.
- Does: Holds 38.5% of Nevada Gold Mines, a joint venture with Barrick, which runs it.
- Does: Pays a quarterly dividend: $0.26 a share declared for Q3 2026.
What it does not do
- Does not: Does not make jewelry or sell to shoppers: it sells gold through bullion banks and traders, and concentrate to smelters and traders.
- Does not: Does not run Nevada Gold Mines; Barrick operates it.
- Does not: Does not report an operating income line.
14How the money flows
14How the money flows · FY2025
How does money flow through Newmont?
Money in
- Sales of gold and other metals$22.7B
- Gain on mines sold, investment gains, venture profits and other income$2.1B
The company
Newmont
$24.8B came in
Money out
- Running the mines (costs applicable to sales)$8.1B
- Depreciation and amortization$2.5B
- Reclamation, exploration, projects, overheads and other$1.3B
- Impairments (write-downs of mines)$842M
- Interest$229M
- Income and mining tax$4.6B
- Partners' share (Merian)$82M
- Net income attributable to Newmont$7.1B
- Buyers paid Newmont $22.7 billion for metals in FY2025; mine sales, investments and partly owned mines added $2.1 billion.
- Running the mines took $8.1 billion, the largest cost.
- Wear on mines and equipment took $2.5 billion; closing old mines, exploring, overheads and other costs took $1.3 billion.
- Write-downs took $842 million, mostly at Yanacocha in Peru, and income and mining taxes took $4.6 billion.
- After $229 million of interest and $82 million for a partner, $7.1 billion was left as net income.
15What it needs to run
15What it needs to run
What does Newmont need to run?
Gold reserves
Attributable proven and probable gold reserves were 118.2 million ounces at Dec 31, 2025, against 5,889 thousand ounces produced in FY2025. Mining uses them up, so they must be replaced.
Spending on mines
Additions to property, plant and mine development were $3,035 million in FY2025, up from $1,653 million in FY2021.
Energy, labor and equipment
The 10-K says its costs are driven by the location, grade and nature of its ore and by input costs such as energy, labor and equipment.
Permits and host governments
Its mines sit in nine countries, each with its own royalties and taxes. Ghana moved to a sliding-scale gold royalty of 5% to 12% in March 2026.
People
About 17,500 employees and 26,600 contractors at Dec 31, 2025; about 27% of the workforce were union members or covered by collective bargaining.
16Where it sells
16Where it sells · FY2025
Where does Newmont sell?
- United Kingdom (where the buyer is located)58%
- South Korea14%
- Japan9%
- China6%
- Australia4%
- Mexico3%
- Switzerland0%
- Philippines0%
- Other6%
17Competitors and what protects it
17Competitors and what protects it
Who does Newmont compete with?
Barrick Mining
NYSE: B
In Newmont's peer group. Barrick owns 61.5% of Nevada Gold Mines and runs it; Newmont owns the other 38.5%.
Agnico Eagle Mines
NYSE: AEM
In the peer group Newmont's 2026 proxy uses for shareholder-return comparisons.
Freeport-McMoRan
NYSE: FCX
In the compensation peer group Newmont's 2026 proxy uses for executive pay decisions; a copper and gold miner.
Kinross Gold
NYSE: KGC
In the shareholder-return peer group Newmont's 2026 proxy uses.
Gold Fields
NYSE: GFI
In the shareholder-return peer group Newmont's 2026 proxy uses.
What protects the business
Each strength is scored 1 (weak) to 5 (strong) for the business, with the reason. It is not a rating of the share.
- Size of production4 of 5
The FY2025 10-K says Newmont is the top gold producer, with about 5% of world mined gold; it produced 5,889 thousand attributable ounces in FY2025.
- Reserves4 of 5
Attributable proven and probable gold reserves were 118.2 million ounces at Dec 31, 2025, plus 88.1 million ounces of measured and indicated resources.
- Spread of mines3 of 5
No single segment made more than 16.1% of the 13 segments' FY2025 pre-tax income; the mines are in nine countries.
- Borrowing strength3 of 5
Newmont states net cash of $3.2 billion on Sep 30, 2026, and its $4.0 billion credit facility was undrawn. Moody's rating is A3, as announced by the company on Aug 27, 2025.
Weak spot
No control over the gold price, and rising costs
Gold all-in sustaining cost (co-product, the company's measure) rose from $1,062 an ounce in FY2021 to $1,609 in FY2025. Profit then depends on the gold price staying above that level.
18Where growth could come from
18Where growth could come from
Where could Newmont's growth come from?
Newmont said in its Q3 FY2026 earnings release (Oct 22, 2026) that it was on track for 2026 attributable gold production of 5,260 thousand ounces. It lowered its 2026 gold by-product all-in sustaining cost guidance to $1,520 an ounce, from $1,680 stated on Feb 19, 2026. Both assume gold at $4,500 an ounce.
Ahafo North in Ghana
Working$305 million of sales, Q3 FY2026
Commercial production began in Oct 2025. Pre-tax segment income was $179 million in Q3 FY2026.
Status: Working, on track against what the company said.
Tanami Expansion 2
WorkingCommercial production expected in the first half of 2027, the company said Oct 22, 2026
The FY2025 10-K expected the second half of 2027, at a capital cost of $1.7–1.8 billion. Shaft construction was completed in Q3 2026.
Status: Working, on track against what the company said.
Cadia panel caves
EarlyAbout 5 million ounces of gold reserves and 1.1 million tonnes of copper
Capital of $2.0–2.4 billion, with the last drawbell expected in 2029, the 10-K says. Seismic events at Cadia in April 2026 cut Q2 FY2026 copper output 43% from Q1.
Status: Early, too early to judge.
Red Chris block cave in Canada
EarlyFull-funds decision expected early 2027, the company said Oct 22, 2026
The Q3 2026 presentation gives development capital of $4.2–4.8 billion on a 100% basis, construction from 2027 and commercial production in 2033.
Status: Early, too early to judge.
Nevada Gold Mines expansion
New$1.95 billion payment to Barrick
Under an agreement signed Aug 10, 2026, Barrick's Fourmile and Newmont's Fiberline and Mike projects go into Nevada Gold Mines. Newmont pays Barrick $1.95 billion within 30 days of Fourmile's contribution.
Status: New, recently announced.
Fewer shares
WorkingOver 115 million shares retired since Feb 2024
The company says that is about 10% of its shares. It bought back $5,241 million of shares in the first nine months of FY2026.
Status: Working, on track against what the company said.
Status compares progress with what the company itself said it would do: Working = on track against what the company said; Mixed = partly on track; Behind = behind the company's own plan; New = recently announced; Early = too early to judge.
Sources (7)
- Q3 2026 earnings release (Form 8-K, Exhibit 99.1)
- Q4 and full-year 2025 earnings release and 2026 guidance (Form 8-K, Exhibit 99.1)
- Form 10-K, fiscal year 2025 (ended Dec 31, 2025)
- Form 10-Q, Q3 FY2026 (quarter ended Sep 30, 2026)
- Q2 2026 earnings release (Form 8-K, Exhibit 99.1)
- Q3 2026 earnings presentation
- Form 8-K, Item 1.01: amended Nevada Gold Mines joint venture agreement with Barrick
19The company's own measures (non-GAAP)
19The company's own measures · FY2025 to Q3 FY2026
What do Newmont's own measures show?
Official (GAAP): Net income attributable to Newmont, FY2025
$7.1B
Company's own measure: Adjusted net income, FY2025
$7.6B
The company leaves out the $1,066 million gain on mines sold, $841 million of impairments, the $604 million investment gain, restructuring, a debt-repayment loss and some tax items.
Official (GAAP): Diluted earnings per share, FY2025
$6.39
Company's own measure: Adjusted net income per diluted share, FY2025
$6.89
Same adjustments as adjusted net income, per diluted share.
Official (GAAP): Net income attributable to Newmont, FY2025
$7.1B
Company's own measure: Adjusted EBITDA, FY2025
$13.5B
The company adds back tax, interest, depreciation and the partner's share, takes out profit from partly owned mines, then removes the same one-off items as in adjusted net income. Its unadjusted EBITDAOperating profit before wear-and-tear charges (depreciation and amortization). As a margin: per $100 of sales. was $14,092 million.
Official (GAAP): Net income attributable to Newmont, Q3 FY2026
$2.5B
Company's own measure: Adjusted net income, Q3 FY2026
$2.3B
The company's adjustments for the quarter; $2.20 per diluted share, against GAAP diluted earnings of $2.35.
Official (GAAP): Costs applicable to sales, FY2025
$8.1B
Company's own measure: Gold all-in sustaining cost (co-product), FY2025
1,609 dollars an ounce
Cost per ounce of gold sold, adding sustaining capital, overheads, exploration and reclamation to mine running costs. From 2026 the company reports it on a by-product basis (other metals' sales subtracted), which is not comparable: the FY2025 by-product figure was $1,358.
Official (GAAP)
No official figure measures this; it is the company's own operating measure.
Company's own measure: Gold all-in sustaining cost (by-product), Q3 FY2026
1,454 dollars an ounce
The company's 2026 basis. Gold by-product costs applicable to sales were $832 an ounce in the quarter.
These are the company's own measures, defined by the company. They are not comparable across companies, and they are not added together. Each sits beside the nearest official (GAAP) figure.
Learn: Non-GAAP measures: what a company's "adjusted" numbers leave out
20Financial strength and debt
20Financial strength · Sep 30, 2026
How much debt does Newmont have?
- Total debt$5.6B
- Cash and investments$8.8B
- Net cash (cash minus debt)$3.2B
- Net worth (shareholders' money)$35.7B
- Debt to equity
- 0.16×
- $ of debt for every $1 of shareholders' money
- Net cash of $3,243 million at Sep 30, 2026, as stated in the Q3 FY2026 earnings release's net debt reconciliation: debt of $5,087 million plus $497 million of leases and other financing, minus $8,827 million of cash.
- Debt to equity of 0.16 is debt and leases ÷ Newmont stockholders' equity of $35,675 million (Cityfort calculation from the Q3 FY2026 earnings release). Interest coverage is left out because Newmont has no operating income line.
- Debt was $8,874 million at Dec 31, 2023, after the Newcrest deal, and $5,115 million at Dec 31, 2025, after $3,448 million of notes were redeemed in FY2025. All senior notes are unsecured, and none mature in 2026–2028.
- A $4.0 billion revolving credit facility running to Feb 2029 was undrawn on Sep 30, 2026.
- Not counted as debt here: mine closure (reclamation and remediation) liabilities of $7,190 million at Dec 31, 2025, of which $3,906 million is for Yanacocha in Peru.
21Who owns it
21Who owns it · ownership as of Mar 16, 2026
Who owns Newmont?
- Officers and directors (as a group), shares
- 0.1%
Share classes
Holders of 5% or more
From the company's proxy statement (DEF 14A), later Schedule 13G filings and the share counts on its latest annual or quarterly report. Each holder row shows the date of its own filing.
Insider trades · Form 4 data as of Nov 6, 2026
What did Newmont's insiders report trading?
Newmont's insiders made 67 Form 4A filing an insider must make within two business days of buying or selling the company's shares. Learn more filings in the 12 months to Nov 6, 2026.
They reported no purchases and 25 sales (119,891 shares) in the open market or privately (codes P and S).
23 of the 25 sales were on forms with the Rule 10b5-1 plan box checked.
The same filings report 68 other share transactions (A: 35, F: 31, G: 2).
Insiders are a company's officers, directors and owners of more than 10% of a class of its shares. Most changes in their holdings must be reported to the SEC on a Form 4 within two business days. Source: SEC Form 4 filings on EDGAR.
- P
- a purchase in the open market or privately
- S
- a sale in the open market or privately
- A
- a grant, award or other acquisition from the company under Rule 16b-3
- F
- shares withheld or handed over to pay an exercise price or tax when an award is received, exercised or vests
- G
- a bona fide gift
Code meanings: General Instruction 8 of Form 4 (SEC).
The latest 25 of 93 transactions
Shares: A = acquired, D = disposed of. A price the filing gives only in a footnote shows as “See filing”. The 10b5-1 box is checked when at least one trade on the form was made under a Rule 10b5-1 plan. A Form 4/A replaces the form it amends. See all of Newmont's Form 4 filings on EDGAR.
Learn: How to read a proxy statement (DEF 14A): Nvidia's 2026 proxy · Form 4 insider filings: who files, the codes and the footnotes · Rule 10b5-1 trading plans: how insiders pre-schedule their trades
Sources (5)
- Form 10-Q, Q3 FY2026 (quarter ended Sep 30, 2026)
- Form 10-K, fiscal year 2025 (ended Dec 31, 2025)
- 2026 proxy statement (DEF 14A), annual meeting May 12, 2026
- Schedule 13G filed by Vanguard Capital Management (event date Mar 31, 2026)
- Schedule 13G/A (Amendment No. 14) filed by The Vanguard Group (event date Mar 13, 2026)
22What it does with profit
22What it does with profit
What does Newmont do with its profit?
Dividend per share
$1.01FY2025
Dividend paid for each share, by financial year.
$ per share
See the numbers
Buyback · Dec 31, 2021
Shares repurchased in FY2021
$525M
Buyback · Dec 31, 2024
Shares repurchased in FY2024
$1.2B
Buyback · Dec 31, 2025
Shares repurchased in FY2025
$2.3B
Buyback · Sep 30, 2026
Shares repurchased in the first nine months of FY2026
$5.2B
23Governance signals
23Governance signals
What do Newmont's governance filings show?
- Auditor
- Ernst & Young LLP, since 2014
- Auditor changes
- None in the period covered
- Audit qualifications
- None reported
- Related-party dealings
- The 2026 proxy's related person transactions section describes only the approval policy: deals with a related person of $120,000 or more need approval by the Audit Committee, the pay committee or disinterested directors. It lists no transactions.
- Credit rating
- Moody's, Fitch and S&P Global Ratings (as announced in Newmont's own news releases) A3 (Moody's, Aug 27, 2025) / A- (Fitch, Oct 3, 2023) / BBB+ (S&P, Mar 31, 2022) (Stable at each announcement), Aug 27, 2025
A credit rating describes the company's ability to repay debt. It is not a rating of the share.
Flags to know about
other
Nevada Gold Mines dispute, settled
On Jan 26, 2026 Newmont told Barrick and the joint venture's board that it had identified evidence of mismanagement at Nevada Gold Mines, including diversion of resources to Barrick's Fourmile property. On Aug 10, 2026 the two signed a confidential settlement resolving all outstanding disputes over the venture, with an amended agreement.
other
Shareholder lawsuits
A securities class action alleged misleading statements about operations, production and costs between Jul 24 and Oct 23, 2024. The court dismissed it and entered final judgment for the defendants on Sep 17, 2026. Related derivative suits against officers and directors at the time were pending in federal courts in Colorado and Delaware.
other
Cadia landholder class action
A class action filed on Feb 2, 2026 in New South Wales, Australia, alleges loss to nearby land from alleged contamination by dust and fluid emissions from the Cadia mine. Newmont says it intends to vigorously defend the matter.
disclosure
Cost per ounce changed basis in 2026
From 2026 Newmont guides and reports gold cost per ounce on a by-product basis instead of co-product, so 2026 figures are not comparable with earlier years. It has no operating income line.
disclosure
Credit ratings from company releases
The FY2025 10-K names S&P, Moody's and Fitch but not the ratings. The ratings shown come from Newmont's own news releases; the Fitch and S&P announcements date from 2023 and 2022.
Sources (9)
- Form 10-K, fiscal year 2025 (ended Dec 31, 2025)
- 2026 proxy statement (DEF 14A), annual meeting May 12, 2026
- Newmont Upgraded to A3 Rating by Moody's (company news release)
- Newmont Assigned Stable A- Rating from Fitch (company news release)
- Newmont Upgraded to BBB+ by S&P (company news release)
- Form 8-K, Item 1.01: amended Nevada Gold Mines joint venture agreement with Barrick
- Form 10-Q, Q3 FY2026 (quarter ended Sep 30, 2026)
- Q4 and full-year 2025 earnings release and 2026 guidance (Form 8-K, Exhibit 99.1)
- Q3 2026 earnings release (Form 8-K, Exhibit 99.1)
24What the market paid
24What the market paid · price as of Nov 5, 2026
What did the market pay for Newmont on Nov 5, 2026?
Price as of Nov 5, 2026 (shown for education; prices change daily).
Closing price of $119.71 on Nov 5, 2026, from Nasdaq's historical price table for NEM; Newmont's shares trade on the NYSE. Market value of about $124.4 billion (Cityfort calculation from the Nov 5, 2026 closing price and the Q3 FY2026 10-Q) = $119.71 × 1,039.2 million shares on Oct 15, 2026. P/E is price ÷ earnings per share: 13.9 on $8.60, the sum of diluted EPS for the four quarters to Sep 30, 2026 (Cityfort calculation from the Q3 FY2026 earnings release), and 18.7 on FY2025's $6.39 (Cityfort calculation from the FY2025 10-K). P/B = market value ÷ Newmont stockholders' equity of $35,675 million on Sep 30, 2026 (Cityfort calculation from the Q3 FY2026 earnings release). EV/EBITDA is blank because this page leaves EBITDA blank.
- Share price
- $119.71
- Market value (market cap)
- $124.4B
- P/E
- 13.9×
- P/B
- 3.5×
More price-based ratios · as of Nov 5, 2026
Each ratio divides a number from the company's filings by the market value or share price on Nov 5, 2026. Prices change daily, so these ratios do too.
Price to sales (P/S)
4.7×
$124.4B market value ÷ $26.6B revenue (four quarters to Sep 30, 2026) = 4.7×
Cityfort calculation from the Nov 5, 2026 closing price and the Q4 FY2025 to Q3 FY2026 10-Qs and earnings releases. Source: NEM historical prices, Oct 15 to Nov 5, 2026 (close Nov 5, 2026: $119.71); Form 10-Q, Q3 FY2026 (quarter ended Sep 30, 2026); Q3 2026 earnings release (Form 8-K, Exhibit 99.1) and 1 more
How price ratios workDividend yield
0.84%
$1.01 dividends per share (FY2025) ÷ $119.71 share price = 0.84%
Cityfort calculation from the FY2025 10-K and the Nov 5, 2026 closing price. Source: NEM historical prices, Oct 15 to Nov 5, 2026 (close Nov 5, 2026: $119.71); Form 10-Q, Q3 FY2026 (quarter ended Sep 30, 2026); Q3 2026 earnings release (Form 8-K, Exhibit 99.1) and 1 more
What dividend yield meansFree cash flow yield
5.9%
$7.3B free cash flow (FY2025) ÷ $124.4B market value = 5.9%
Cityfort calculation from the FY2025 10-K and the Nov 5, 2026 closing price. Source: NEM historical prices, Oct 15 to Nov 5, 2026 (close Nov 5, 2026: $119.71); Form 10-Q, Q3 FY2026 (quarter ended Sep 30, 2026); Q3 2026 earnings release (Form 8-K, Exhibit 99.1) and 1 more
What free cash flow means
Shares used for the market value: 1,039.19 million ($119.71 × 1,039.19 million shares ≈ $124.4B). Source: Form 10-Q, Q3 FY2026 (quarter ended Sep 30, 2026); Form 10-K, fiscal year 2025 (ended Dec 31, 2025)
Source: NEM historical prices, Oct 15 to Nov 5, 2026 (close Nov 5, 2026: $119.71); Form 10-Q, Q3 FY2026 (quarter ended Sep 30, 2026); Q3 2026 earnings release (Form 8-K, Exhibit 99.1) and 1 more
25How it got here
25How it got here
How did Newmont get here?
1921
Milestone
Incorporated
Newmont was incorporated in Delaware in 1921.
2019
Business-model change
Goldcorp bought, Nevada joint venture formed
Newmont bought Goldcorp in April 2019, gaining Peñasquito, and combined its Nevada mines with Barrick's into Nevada Gold Mines on Jul 1, 2019.
2022
Milestone
Full control of Yanacocha
It bought the 48.65% of Yanacocha in Peru held by Buenaventura and Sumitomo.
2023
Business-model change
Newcrest acquired
The all-stock purchase of Australia's Newcrest closed on Nov 6, 2023, adding Lihir, Cadia, Red Chris and other mines.
2023
Crisis
Loss after write-downs
FY2023 brought a net loss of $2,494 million after $1,891 million of impairments, mainly Peñasquito, and a $1,533 million reclamation charge.
2025
Business-model change
Six mines sold
It sold six non-core mines and a project from late 2024 to 2025, booking a $1,066 million gain in FY2025. Ahafo North started commercial production in Oct 2025.
2026
Milestone
New CEO
Natascha Viljoen became President and CEO on Jan 1, 2026, succeeding Tom Palmer.
2026
Crisis
Cadia seismic events
Seismic events at Cadia in April 2026 disrupted output; copper production fell 43% in Q2 FY2026 from Q1.
2026
Milestone
Nevada Gold Mines agreement amended
On Aug 10, 2026 Newmont and Barrick settled their disputes over the venture and agreed to add three projects to it.
Sources (5)
- Form 10-K, fiscal year 2025 (ended Dec 31, 2025)
- Form 10-K, fiscal year 2022 (ended Dec 31, 2022)
- Form 8-K, Exhibit 99.1: CEO Tom Palmer to retire; Natascha Viljoen named successor
- Q2 2026 earnings release (Form 8-K, Exhibit 99.1)
- Form 8-K, Item 1.01: amended Nevada Gold Mines joint venture agreement with Barrick
26Sources and changes
Where every number on this page comes from
Sources (19 documents)
- S1Form 10-K, fiscal year 2025 (ended Dec 31, 2025) · Newmont Corporation (SEC EDGAR) · Tier 1: company or exchange filing · Feb 19, 2026
- S3Form 10-K, fiscal year 2023 (ended Dec 31, 2023) · Newmont Corporation (SEC EDGAR) · Tier 1: company or exchange filing · Feb 29, 2024
- S4Form 10-K, fiscal year 2022 (ended Dec 31, 2022) · Newmont Corporation (SEC EDGAR) · Tier 1: company or exchange filing · Feb 23, 2023
- S5Form 10-Q, Q3 FY2026 (quarter ended Sep 30, 2026) · Newmont Corporation (SEC EDGAR) · Tier 1: company or exchange filing · Oct 22, 2026
- S8Q3 2026 earnings release (Form 8-K, Exhibit 99.1) · Newmont Corporation (SEC EDGAR) · Tier 1: company or exchange filing · Oct 22, 2026
- S9Q2 2026 earnings release (Form 8-K, Exhibit 99.1) · Newmont Corporation (SEC EDGAR) · Tier 1: company or exchange filing · Jul 23, 2026
- S11Q4 and full-year 2025 earnings release and 2026 guidance (Form 8-K, Exhibit 99.1) · Newmont Corporation (SEC EDGAR) · Tier 1: company or exchange filing · Feb 19, 2026
- S15Q4 and full-year 2024 earnings release and 2025 guidance (Form 8-K, Exhibit 99.1) · Newmont Corporation (SEC EDGAR) · Tier 1: company or exchange filing · Feb 20, 2025
- S162026 proxy statement (DEF 14A), annual meeting May 12, 2026 · Newmont Corporation (SEC EDGAR) · Tier 1: company or exchange filing · Mar 26, 2026
- S17Schedule 13G filed by Vanguard Capital Management (event date Mar 31, 2026) · SEC EDGAR · Tier 1: company or exchange filing · Apr 29, 2026
- S18Schedule 13G/A (Amendment No. 14) filed by The Vanguard Group (event date Mar 13, 2026) · SEC EDGAR · Tier 1: company or exchange filing · Mar 26, 2026
- S19Form 8-K, Item 1.01: amended Nevada Gold Mines joint venture agreement with Barrick · Newmont Corporation (SEC EDGAR) · Tier 1: company or exchange filing · Aug 13, 2026
- S20Form 8-K, Item 5.02: executive appointments (Chief Operating Officer Mark Rodgers from Jul 1, 2026) · Newmont Corporation (SEC EDGAR) · Tier 1: company or exchange filing · Jun 15, 2026
- S21Form 8-K, Exhibit 99.1: CEO Tom Palmer to retire; Natascha Viljoen named successor · Newmont Corporation (SEC EDGAR) · Tier 1: company or exchange filing · Sep 29, 2025
- S24Q3 2026 earnings presentation · Newmont Corporation · Tier 1: company or exchange filing · Oct 22, 2026
- S26NEM historical prices, Oct 15 to Nov 5, 2026 (close Nov 5, 2026: $119.71) · Nasdaq · Tier 1: company or exchange filing · Nov 5, 2026
- S27Newmont Upgraded to A3 Rating by Moody's (company news release) · Newmont Corporation · Tier 3: context only · Aug 27, 2025
- S28Newmont Assigned Stable A- Rating from Fitch (company news release) · Newmont Corporation · Tier 3: context only · Oct 3, 2023
- S29Newmont Upgraded to BBB+ by S&P (company news release) · Newmont Corporation · Tier 3: context only · Mar 31, 2022
Changes to this page (v1 · Nov 6, 2026)
- v1 · Nov 6, 2026First version, through Q3 FY2026 (quarter ended Sep 30, 2026), from the 10-Q and earnings release filed Oct 22, 2026. (first version)
Numbers come only from tier 1 and tier 2 sources. Read how we research.
Disclaimer
For learning only. Cityfort is not a registered investment adviser or broker-dealer and does not recommend buying or selling any security. Prices shown are dated and may be out of date.
Investing in securities involves risk, including loss of capital. Before making any investment decision, do your own research and consider consulting a registered investment adviser or other qualified professional.
Cityfort, its owners and contributors may or may not hold securities of companies covered. Cityfort is not paid by any company it covers. Content is not an offer or solicitation to buy or sell any security, including in any initial public offering.
Read the positions policyRead the full disclaimerHide the full disclaimer
Cityfort publishes general educational content that explains how listed companies work. Cityfort is not registered with the US Securities and Exchange Commission or any state securities regulator as an investment adviser, and is not a broker-dealer or a member of FINRA. Cityfort does not provide investment, tax or legal advice, recommendations, ratings, price targets or any opinion on whether to buy, sell or hold any security. Nothing on the site is tailored to any person's circumstances.
All information is taken from publicly available sources, mainly company filings with the SEC, which are listed on each page with dates. We work to keep it accurate and correct errors publicly, but we do not guarantee that it is complete, accurate or up to date. Any market price or price-based ratio shown is dated, may be out of date by the time you read it, and is included only to explain concepts.
Statements by company management, including forward-looking statements and guidance, are reported as the company's statements, with their date and source; they are not our forecasts. Adjusted (non-GAAP) figures are the company's own measures and are shown next to the official (GAAP) figures.