Materials · NYSE: FCX
Freeport-McMoRan: how the business works
Freeport-McMoRan mines copper, gold and molybdenum in Indonesia, Peru, Chile and the US, and had revenue of $25.9 billion in FY2025.
By Hardik Bhandare · Checked against filings: . Editorial policy. Corrections
Follow Freeport-McMoRan
Email me when Freeport-McMoRan's page is updated after earnings.
We'll send a confirmation email first. See our privacy policy.
Freeport-McMoRan Inc. · Phoenix, Arizona
Updated for Q3 FY2026 · checked
- Revenue, FY2025
- $25.9B
- Net income to common stockholders, FY2025
- $2.2B
- Copper produced, FY2025
- 3,383 million pounds
- Copper reserves, end of 2025
- 112.3 billion pounds
- Employees, Dec 31, 2025
- About 29,000
The short version
Freeport-McMoRan in 5 points
1 · What it sells
Freeport-McMoRan mines copper, gold and molybdenum in Indonesia, Peru, Chile and the US, and had revenue of $25.9 billion in FY2025.
2 · Who pays it
Buyers of copper paid 74.5% of FY2025 product sales before deductions, gold 15.0%, molybdenum 7.6% and silver and other by-products 2.9%.
3 · What it keeps from $100
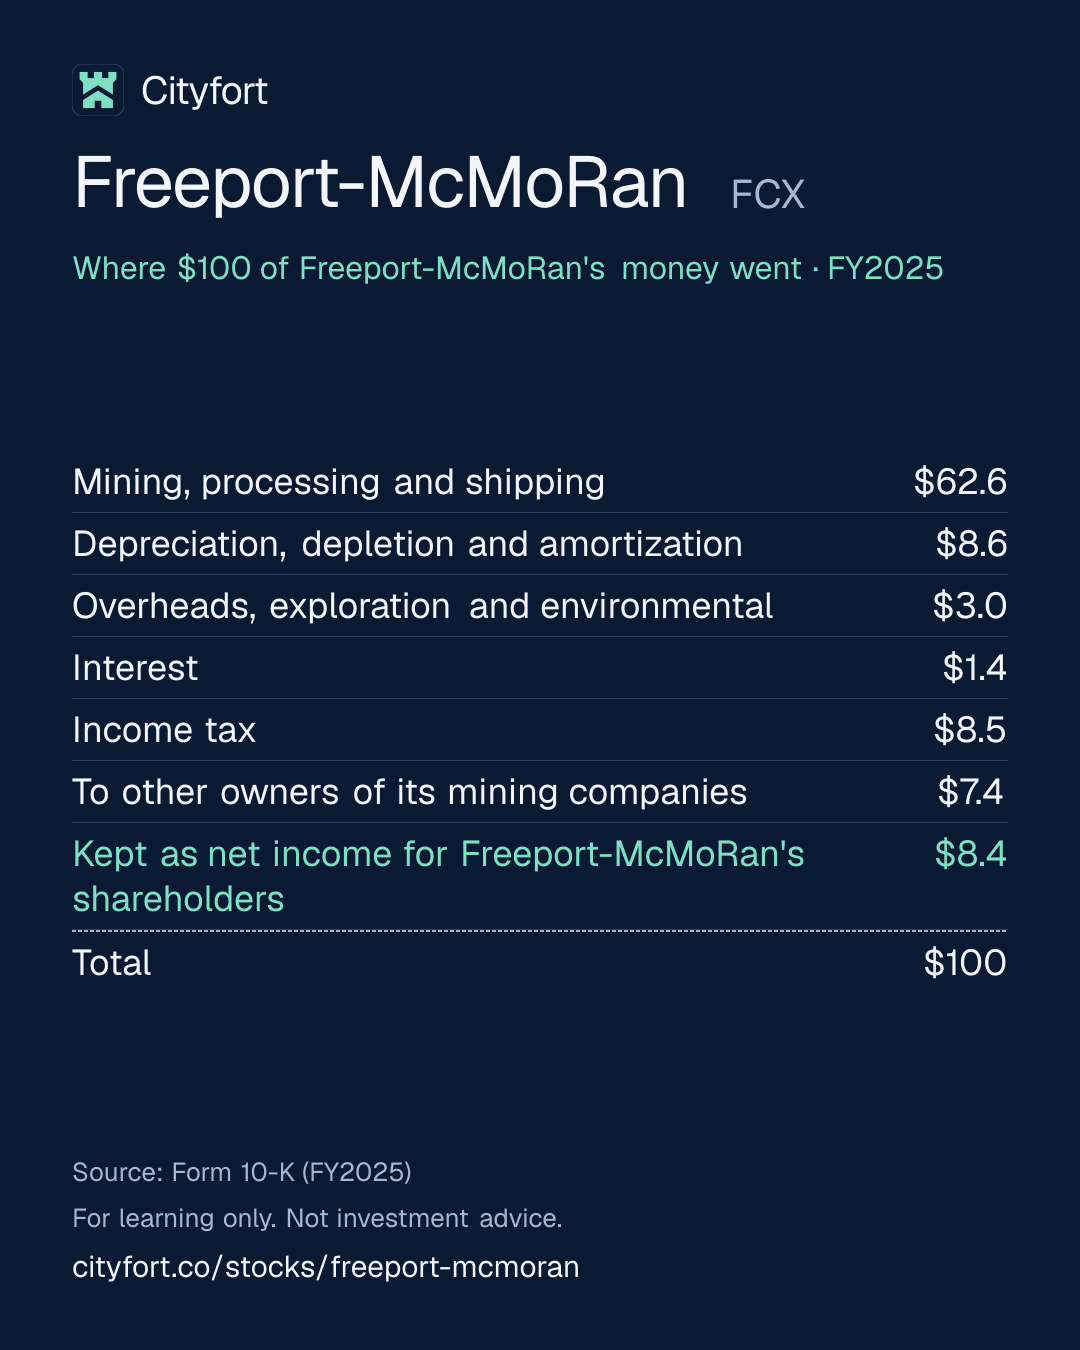
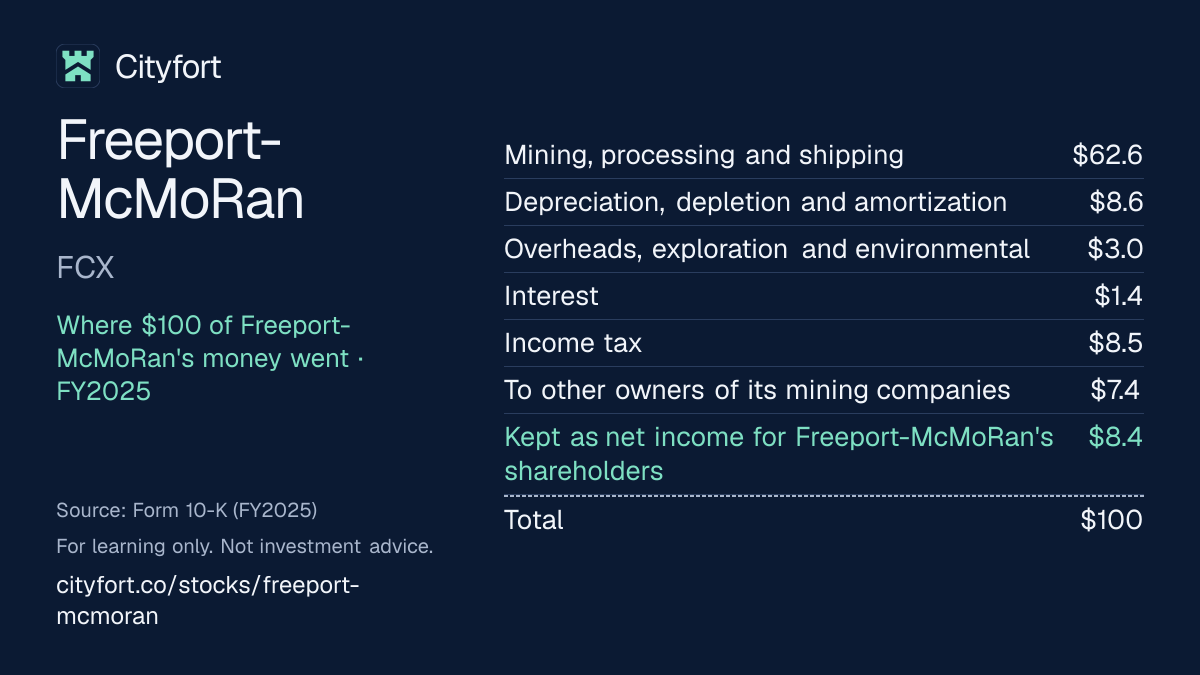
Of every $100 that came in during FY2025, $8.4 was left as net income for Freeport-McMoRan's shareholders after $7.4 went to partners in its mines; operating income was $25.2 per $100 of revenue.
4 · Where the operating profit comes from
Indonesia operations made 54.8% of FY2025 segment operating income before corporate costs, Cerro Verde in Peru 26.0% and Morenci in Arizona 8.7%.
5 · The one thing to watch
The Indonesia mill ran at 67% of capacity in Q3 2026 after the Sep 2025 mud rush; the company said on Oct 27, 2026 it expects 80% by mid-2027.
Sources: From Freeport-McMoRan's FY2025 10-K and Q3 FY2026 earnings release · checked
See the full receipt and the management scorecard below
01Where the money goes · FY2025
Where does $100 of Freeport-McMoRan's money go?
Freeport-McMoRan · FY2025
Receipt for every $100
| Mining, processing and shipping | $62.6 |
|---|---|
| Depreciation, depletion and amortization | $8.6 |
| Overheads, exploration and environmental | $3.0 |
| Interest | $1.4 |
| Income tax | $8.5 |
| To other owners of its mining companies | $7.4 |
| Kept as net income for Freeport-McMoRan's shareholders | $8.4 |
| Total | $100 |
Each line = amount ÷ total money in × 100. Lines may not add to exactly $100 because of rounding.
How this is worked out
Cityfort calculation from FY2025 10-K. Of every $100 that came in during FY2025: each line ÷ revenue of $25,915 million plus $240 million of other income, asset-sale gains and venture earnings ($26,155 million). The other owners' share is the noncontrolling interests in PT Freeport Indonesia, Cerro Verde and El Abra. Operating income was $6,518 million, $25.2 per $100 of revenue; that figure counts all of each mine, including the parts other owners hold.
Save this receipt as an image:
1080 × 1350 PNG for Instagram, LinkedIn1200 × 675 PNG for X
Embed this receipt
Paste this code into a blog or website to show the receipt, with a link back to this page:
Each week: one company explained in 5 points, picked by earnings date.
Free, no tips, unsubscribe anytime.
We'll send a confirmation email. See our privacy policy.
02The business in one line
What does Freeport-McMoRan do?
Metal buyers pay Freeport-McMoRan for copper, gold and molybdenum; most of the money goes on running its mines, and nearly half of the profit belongs to partners who co-own them.
- In FY2025 copper made up 74.5% of product sales before deductions, gold 15.0%, molybdenum 7.6% and silver and other 2.9%.
- Of every $100 that came in during FY2025, $62.6 went on mining, processing and shipping, $7.4 went to the partners in its mining companies and $8.4 was left for Freeport-McMoRan's shareholders.
03Who pays it
Who pays Freeport-McMoRan?
Buyers of copper
75%
of revenue
Smelters, refiners and fabricators buying concentrate, cathode and rod paid $19,325 million in FY2025, before deductions.
Buyers of gold
15%
of revenue
Paid $3,900 million in FY2025, before deductions.
Buyers of molybdenum
8%
of revenue
Paid $1,966 million in FY2025.
Buyers of silver and other by-products
3%
of revenue
Paid $749 million in FY2025.
- Buyers of copper75%
- Buyers of gold15%
- Buyers of molybdenum8%
- Buyers of silver and other by-products3%
How spread out the customers are
Shares are of product sales of $25,940 million before royalties, export duties, treatment charges and price adjustments (Cityfort calculation from the FY2025 10-K). The largest customer, Mitsubishi Materials Corporation, PTFI's partner in PT Smelting, bought $1.7 billion in FY2025 (6.6% of revenue, Cityfort calculation from the FY2025 10-K) and $4.4 billion, or 17%, in FY2024. Sales to the other owners of its South American mines and Morenci's partners were $1.5 billion in FY2025.
- Largest customer
- 7%
04Why it makes money
Why does Freeport-McMoRan make money?
Freeport-McMoRan earns the gap between world metal prices, which it does not set, and the cost of digging and processing ore.
For PT Freeport Indonesia (PTFI), its Indonesian mining company, the FY2025 10-K says "a significant portion of PTFI's costs are fixed and unit costs vary depending on volumes." In Q3 FY2026 its realized copper price was $6.54 a pound, against a unit net cash cost of $2.07 (a company measure). When Grasberg stopped after the Sep 2025 mud rush, FY2025 copper production fell 19.7% and operating income per $100 of revenue fell to $25.2.
Operating income per $100 of revenue
$36.6$25.2
FY2021 to FY2025
- It spends billions on mines, mills and smelters.
- Those dig and process ore into copper, gold and molybdenum.
- It sells the metal at world market prices.
- Higher prices or more output lift profit; mine outages or lower prices cut it.
- Cash pays partners, taxes, dividends and the next mine expansion.
↺ Step 5 feeds back into step 1.
05Business segments · FY2025
Which businesses make up Freeport-McMoRan?
Indonesia operations
33%PT Freeport Indonesia's Grasberg district in Central Papua: copper and almost all of the company's gold. Freeport-McMoRan owns 48.76%. It made 54.8% of FY2025 segment operating income before corporate costs (Cityfort calculation from FY2025 10-K), after $743 million of mud rush idle and recovery costs.
Revenue $8.6B · Operating profit $3.8B
U.S. Rod & Refining
26%A refinery and rod mills in Texas and Arizona that turn copper from its US mines and bought copper into cathode and rod. Large sales, thin operating income.
Revenue $6.9B · Operating profit $31M
Cerro Verde
15%A copper and molybdenum mine in Peru, 55.08% owned. Its operating income of $1,818 million was 26.0% of FY2025 segment operating income before corporate costs.
Revenue $3.8B · Operating profit $1.8B
Atlantic Copper
12%Its wholly owned smelter and refinery in Huelva, Spain, which processes copper concentrate.
Revenue $3.2B · Operating profit $11M
Morenci
1%A copper mine in Arizona in which it has a 72% undivided interest. Its operating income of $607 million was 8.7% of the FY2025 segment total before corporate costs. Revenue here counts only sales to outside customers; the company's own Rod & Refining unit processes copper from its US mines.
Revenue $303M · Operating profit $607M
Other segments
12%Six other US copper mines including Bagdad, El Abra in Chile, the molybdenum mines and other operations. Corporate costs and eliminations of $484 million are not in any segment.
Revenue $3.2B · Operating profit $695M
How the mix changed
- Indonesia operations
- U.S. Rod & Refining
- Cerro Verde
- Atlantic Copper
- Morenci
- Other segments
Revenue by segment, FY2023 to FY2025.
US$
See the numbers
06The numbers · Consolidated · US$
How has Freeport-McMoRan done?
Revenue
$25.9BFY2025
Revenue stayed near $22.8 billion from FY2021 to FY2023 and reached $25.9 billion in FY2025 with higher realized copper and gold prices; Q3 FY2026 revenue was $7.5 billion, up 8.2% from a year earlier.
US$
See the numbers
Net profit
$2.2BFY2025
Net income to common stockholders fell from $4.3 billion in FY2021 to $1.8 billion in FY2023, the year its share of PT Freeport Indonesia fell to 48.76%, and was $2.2 billion in FY2025; Q1 FY2026 includes a $699 million insurance gain.
US$
See the numbers
Profit kept per $100 of revenue
$8.5FY2025
Freeport-McMoRan kept $8.5 of net income to common stockholders per $100 of revenue in FY2025, against $18.8 in FY2021; EBITDA counts all of each mine, including the parts other owners hold.
$ of profit per $100 of revenue (net margin)
See the numbers
Free cash flow
$1.1BFY2025
Free cash flow fell from $5.6 billion in FY2021 to $1.1 billion in FY2025 as capital spending, more than half of it in Indonesia, rose from $2.1 billion to $4.5 billion.
US$ · cash from operations minus spending on plants and equipment
See the numbers
See all yearly numbers
EBITDA here = operating income plus depreciation and amortization (from the cash flow statement). Fiscal years are the company's own (Fiscal year ends on December 31 (the calendar year)). Net profit is the share belonging to the company's owners. Total net income differs from net profit to the company's owners: Net income to common stockholders is total net income less the share of the other owners of PT Freeport Indonesia, Cerro Verde and El Abra (46.9% of total net income).
Download Freeport-McMoRan's yearly and quarterly numbers (CSV, with source ids)
Learn: Stock-based compensation and dilution: pay that becomes shares
Sources (12)
- Form 10-K, fiscal year 2023 (ended Dec 31, 2023)
- Form 10-K, fiscal year 2022 (ended Dec 31, 2022)
- Form 10-K, fiscal year 2025 (ended Dec 31, 2025)
- Q4 FY2024 earnings release (8-K Exhibit 99.1), Jan 23, 2025
- Q4 FY2025 earnings release (8-K Exhibit 99.1), Jan 22, 2026
- Q1 FY2025 earnings release (8-K Exhibit 99.1), Apr 24, 2025
- Q1 FY2026 earnings release (8-K Exhibit 99.1), Apr 23, 2026
- Q2 FY2025 earnings release (8-K Exhibit 99.1), Jul 23, 2025
- Q2 FY2026 earnings release (8-K Exhibit 99.1), Jul 23, 2026
- Q3 FY2025 earnings release (8-K Exhibit 99.1), Oct 23, 2025
- Q3 FY2026 earnings release (8-K Exhibit 99.1), Oct 27, 2026
- Form 10-Q, Q3 FY2026 (quarter ended Sep 30, 2026)
07Who runs it
Who runs Freeport-McMoRan, and did they deliver?
Kathleen L. Quirk
President and Chief Executive Officer · since 2024
CEO since 2024 and President since 2021. Her 2025 total pay in the proxy's summary compensation table was $14,808,126.
Richard C. Adkerson
Chairman of the Board · since 2021
CEO from 2003 to 2024. His 2025 total pay in the proxy's summary compensation table was $18,143,529.
What they said, and what happened
3 delivered · 2 too early to tell
Said on Feb 13, 2026
Freeport-McMoRan said in its FY2025 10-K (Feb 13, 2026) that it planned to restart Grasberg Block Cave Production Blocks 2 and 3 in Q2 2026.
DeliveredWhat happened
The ramp-up of Production Blocks 2 and 3 began at the end of March 2026, the Q3 FY2026 release says.
Said on Feb 13, 2026
Freeport-McMoRan said in its FY2025 10-K that it expected about 85% of normal PT Freeport Indonesia production to be restored in the second half of 2026.
Too early to tellWhat happened
In Q3 2026 the Indonesia mill ran at 141,000 metric tons of ore a day, 67% of capacity. The company said on Oct 27, 2026 that it expects 80% of capacity by mid-2027.
Said on Feb 13, 2026
Freeport-McMoRan said in its FY2025 10-K that it expected a decision on the Bagdad expansion during 2026, at an estimated capital cost of about $3.5 billion.
DeliveredWhat happened
The board approved the expansion on Nov 4, 2026, at $4.5 billion.
Said on Feb 13, 2026
Freeport-McMoRan said in its FY2025 10-K that shipments to its new Indonesian smelter would restart in the second half of 2026.
DeliveredWhat happened
Smelter operations restarted in late August 2026.
Said on Jan 22, 2026
Freeport-McMoRan said on Jan 22, 2026 that it expected 2026 copper sales of 3.4 billion pounds and gold sales of 0.8 million ounces.
Too early to tellWhat happened
The company lowered the estimates to 3.1 billion pounds and 650 thousand ounces on Apr 23, 2026, and to 3.0 billion pounds and 649 thousand ounces on Oct 27, 2026.
Sources (7)
- 2026 proxy statement (DEF 14A), annual meeting Jun 10, 2026, record date Apr 13, 2026
- Form 10-K, fiscal year 2025 (ended Dec 31, 2025)
- Q3 FY2026 earnings release (8-K Exhibit 99.1), Oct 27, 2026
- 8-K filed Nov 4, 2026 (Item 8.01, Ex. 99.1): Board approves $4.5 billion Bagdad expansion
- 8-K filed Oct 2, 2026 (Items 2.02, 7.01, Ex. 99.1): Q3 2026 operational update
- Q4 FY2025 earnings release (8-K Exhibit 99.1), Jan 22, 2026
- Q1 FY2026 earnings release (8-K Exhibit 99.1), Apr 23, 2026
08What could go wrong
What could go wrong for Freeport-McMoRan?
- Raw-material prices
Copper and gold prices drive results
The 10-K names metal price swings as a main risk. Its realized copper price rose from $4.15 a pound in Q4 FY2024 to $6.54 in Q3 FY2026, and quarterly net income to common stockholders went from $274 million to $1,174 million.
Watch Realized copper and gold prices and net income in each earnings release.
- Execution
Grasberg's slow return
A mud rush on Sep 8, 2025 killed seven workers and stopped the Grasberg Block Cave mine. The 10-K expected about 85% of normal production in the second half of 2026; the Indonesia mill ran at 67% of capacity in Q3 2026. The company said on Oct 27, 2026 that it expects 80% by mid-2027.
Watch Indonesia mill throughput and copper production each quarter.
- Regulation
Indonesian license and rules
PT Freeport Indonesia's license runs to 2041; an extension needs an amended license. Under the Feb 2026 agreement, Freeport-McMoRan's share would fall from 48.76% to about 37% from 2042. Current rules set a 10% export duty on refined gold, which the company said on Oct 27, 2026 conflicts with its license.
Watch The amended license and any ruling on gold export duties.
- Other
Partners take a large share of profit
The other owners of its Indonesian, Peruvian and Chilean mining companies took $1,948 million of FY2025 net income of $4,152 million, or 46.9%, and 57.1% in FY2024. Distributions to them were $1,274 million in FY2025.
Watch Net income attributable to noncontrolling interests in each release.
- Debt
Heavy spending ahead
Capital spending was $4,494 million in FY2025; the company said on Oct 27, 2026 it expects about $4.4 billion in 2026. The $4.5 billion Bagdad expansion adds to it from 2027. Free cash flowCash from operations minus spending on buildings and equipment. Learn more was $1,116 million in FY2025, and environmental and mine closure obligations were $5,983 million on Sep 30, 2026.
Watch Free cash flow and debt minus cash each quarter.
- Regulation
US tariffs on copper
A 50% tariff on semi-finished copper products applies from Aug 2025, while refined copper is exempt. The government is to reassess a refined copper tariff of 15% from Jan 2027, rising to 30% in 2028, the 10-Q says.
Watch Any decision on a refined copper tariff.
- Execution
Mine safety
Nine workers died in work-related accidents in 2025, seven of them in the mud rush, against two in 2024. Underground mining, tailings and waste rock are named risks in the 10-K.
Watch Fatalities and safety orders reported in filings.
Sources (7)
- Form 10-K, fiscal year 2025 (ended Dec 31, 2025)
- Q4 FY2025 earnings release (8-K Exhibit 99.1), Jan 22, 2026
- Q3 FY2026 earnings release (8-K Exhibit 99.1), Oct 27, 2026
- 8-K filed Feb 24, 2026 (Item 8.01, Ex. 99.1): MOU with Indonesia government on life-of-resource extension of PTFI operating rights
- 8-K filed Nov 4, 2026 (Item 8.01, Ex. 99.1): Board approves $4.5 billion Bagdad expansion
- Form 10-Q, Q3 FY2026 (quarter ended Sep 30, 2026)
- 8-K filed Jan 16, 2026 (Item 1.04): MSHA imminent danger order at Morenci, terminated same day
09Both sides
What do supporters and critics point to?
What supporters point to
- Its realized copper price was $6.54 a pound in Q3 FY2026, against a unit net cash cost of $2.07, a company measure.
- Q3 FY2026 net income to common stockholders was $1,174 million, up 74.2% from $674 million a year earlier.
- Consolidated reserves were 112.3 billion pounds of copper at the end of 2025.
- A Feb 2026 agreement in principle covers extending its Indonesian mining rights beyond 2041.
- The company states senior unsecured debt ratings of Baa2, BBB and BBB-, all stable, as of Jan 31, 2026.
What critics point to
- The other owners of its mining companies took $1,948 million of $4,152 million FY2025 net income, or 46.9%.
- Copper production fell from 4,214 million pounds in FY2024 to 3,383 million in FY2025, and the 2026 copper sales estimate went from 3.4 billion pounds in January to 3.0 billion in October.
- Free cash flow fell from $5,600 million in FY2021 to $1,116 million in FY2025.
- Net debt was $5,063 million on Sep 30, 2026; the $1,826 million measure its financial policy uses leaves out $3,237 million of Indonesian smelter debt.
- Under the Feb 2026 agreement, its share of PT Freeport Indonesia would fall to about 37% from 2042.
10What to watch next
What should you watch next at Freeport-McMoRan?
Next event
Q4 FY2026 results
Date not announced yet.
Grasberg's ramp-up
The Indonesia mill ran at 67% of capacity in Q3 2026. The company said on Oct 27, 2026 that it expects 80% by mid-2027.
Copper price against unit cost
The realized copper price was $6.54 a pound in Q3 FY2026 and the unit net cash cost (a company measure) $2.07; the company said on Oct 27, 2026 that it expects $1.90 for 2026.
Spending on Bagdad
The company expects to fund about 20% of the $4.5 billion cost in 2027, 30–35% in 2028 and the rest in 2029–2030, it said on Nov 4, 2026.
11Key facts
Key facts about Freeport-McMoRan
- What does Freeport-McMoRan do?
- Freeport-McMoRan mines copper, gold and molybdenum in Indonesia, Peru, Chile and the US. In FY2025 Freeport-McMoRan produced 3,383 million pounds of copper, 956 thousand ounces of gold and 92 million pounds of molybdenum, and had revenue of $25,915 million.
- How does Freeport-McMoRan make money, and what is its business model?
- Freeport-McMoRan's business model is mining metal and selling it at market prices. In FY2025 copper was 74.5% of Freeport-McMoRan's product sales before deductions, gold 15.0%, molybdenum 7.6% and silver and other 2.9% (Cityfort calculation from the FY2025 10-K). Its average realized copper price was $4.75 a pound in FY2025 and $6.54 in Q3 FY2026.
- Is Freeport-McMoRan profitable?
- Freeport-McMoRan was profitable in each year from FY2021 to FY2025. Net income attributable to common stockholders was $2,204 million in FY2025, down from $4,306 million in FY2021. Total FY2025 net income was $4,152 million, of which $1,948 million belonged to the other owners of its mining companies. Q3 FY2026 net income to common stockholders was $1,174 million.
- What is Freeport-McMoRan's revenue by segment?
- Of Freeport-McMoRan's FY2025 revenue of $25,915 million from outside customers, Indonesia operations made $8,618 million (33.3%), U.S. Rod & Refining $6,850 million (26.4%), Cerro Verde in Peru $3,776 million (14.6%), Atlantic Copper in Spain $3,155 million (12.2%), Morenci in Arizona $303 million (1.2%) and other segments $3,213 million (12.4%).
- Who are Freeport-McMoRan's customers?
- Freeport-McMoRan's only customer above 10% of revenue in FY2023 to FY2025 was Mitsubishi Materials Corporation, its partner in the PT Smelting plant in Indonesia: $4.4 billion, or 17% of revenue, in FY2024 and $1.7 billion in FY2025. By customer location, buyers in the US paid 34.9% of Freeport-McMoRan's FY2025 revenue, Switzerland 20.6% and Japan 11.0%.
- Who owns Freeport-McMoRan?
- Freeport-McMoRan has one class of common stock and no controlling holder. Vanguard Capital Management reported 7.49% at Mar 31, 2026 (13G filed Apr 29, 2026), and the 2026 proxy lists BlackRock at 6.2%. Directors and executive officers as a group held less than 1% on Apr 13, 2026.
- How much of its mines does Freeport-McMoRan own?
- Freeport-McMoRan owned 48.76% of PT Freeport Indonesia (PTFI) at the end of 2025, down from about 81% before Jan 1, 2023. It owned 55.08% of Cerro Verde in Peru, 51% of El Abra in Chile and a 72% undivided interest in Morenci in Arizona. Net of other owners' shares, Freeport-McMoRan's FY2025 copper production was 2,376 million pounds, against 3,383 million consolidated.
- How much copper does Freeport-McMoRan produce?
- Freeport-McMoRan produced 3,383 million pounds of copper in FY2025, down from 4,214 million in FY2024 after the Sep 2025 mud rush at Grasberg in Indonesia, and 832 million pounds in Q3 FY2026. Freeport-McMoRan's consolidated copper reserves were 112.3 billion pounds at the end of 2025.
- How much gold does Freeport-McMoRan sell?
- Freeport-McMoRan sold 1,066 thousand ounces of gold in FY2025 at an average realized price of $3,423 an ounce, down from 1,837 thousand ounces in FY2024. Grasberg in Indonesia produced 98% of Freeport-McMoRan's FY2025 gold.
- How much does Freeport-McMoRan pay in dividends and buybacks?
- Freeport-McMoRan declared dividends of $0.60 a share in FY2025, a $0.30 base and a $0.30 variable dividend. In FY2025 Freeport-McMoRan paid $865 million in common dividends and $107 million for buybacks, and paid $1,274 million in distributions to the other owners of its mining companies.
Sources (5)
- Form 10-K, fiscal year 2025 (ended Dec 31, 2025)
- Q3 FY2026 earnings release (8-K Exhibit 99.1), Oct 27, 2026
- Form 10-K, fiscal year 2023 (ended Dec 31, 2023)
- Schedule 13G, Vanguard Capital Management, 7.49% (event date Mar 31, 2026)
- 2026 proxy statement (DEF 14A), annual meeting Jun 10, 2026, record date Apr 13, 2026
Terms on this page
- Capital expenditures (capex)
- Customer concentration
- Debt-to-equity
- Earnings per share (EPS)
- EBITDA
- Free cash flow
- Interest coverage
- Market cap
- Net debt
- Net margin
Each explains the term in plain English, with the same number from other companies on Cityfort.
Go deeper
More detail from the same filings. Open any section.
12What it sells
12What it sells
What does Freeport-McMoRan sell?
Copper
Sold as concentrate (ground, upgraded ore for smelters), cathode (pure copper plates) and rod (for wire). Copper sales were $19,325 million in FY2025, 74.5% of product sales before deductions.
Gold
Mostly a by-product of Grasberg's copper ore: $3,900 million in FY2025, or 15.0%. It sold 1,066 thousand ounces at $3,423 an ounce.
Molybdenum
A metal used in steel alloys, from its own molybdenum mines and from its US copper mines and Cerro Verde: $1,966 million in FY2025, or 7.6%.
Silver and other
Silver and other by-products: $749 million in FY2025, or 2.9%.
Think of it like this
It works like a farm selling its harvest at the market price: it controls how much it digs and what that costs, but not the price.
What it does
- Does: Processes metal in its own plants: the Atlantic Copper smelter and refinery in Spain, a smelter in Miami, Arizona, a refinery and rod mills in Texas and Arizona, and a new smelter in Indonesia.
- Does: Buys some copper from others to process and resell: $449 million of purchased copper sales in FY2025.
- Does: Holds 112.3 billion pounds of copper and 20.6 million ounces of gold in consolidated reserves at the end of 2025.
What it does not do
- Does not: Does not own all of its largest mines: at the end of 2025 it owned 48.76% of PT Freeport Indonesia, 55.08% of Cerro Verde and 51% of El Abra.
- Does not: Does not book revenue gross: FY2025 revenue is after $354 million of royalties, $337 million of Indonesian export duties and $63 million of treatment charges.
- Does not: Does not set the prices of copper, gold or molybdenum; its realized copper price went from $3.85 a pound in FY2023 to $4.75 in FY2025.
13How the money flows
13How the money flows · FY2025
How does money flow through Freeport-McMoRan?
Money in
- Revenues$25.9B
- Other income, asset-sale gains and venture earnings$240M
The company
Freeport-McMoRan
$26.2B came in
Money out
- Mining, processing and shipping (production and delivery)$16.4B
- Depreciation, depletion and amortization$2.2B
- Overheads, exploration and environmental costs$795M
- Interest$369M
- Income tax$2.2B
- Share of the other owners of its mining companies$1.9B
- Net income to common stockholders$2.2B
- Buyers paid Freeport-McMoRan $25.9 billion in FY2025; other income added $240 million.
- Mining, processing and shipping took $16.4 billion, the largest cost.
- Wear and depletion of mines took $2.2 billion; overheads, exploration and environmental costs took $795 million.
- Income tax took $2.2 billion and interest $369 million, leaving total net income of $4.2 billion.
- Of that, $1.9 billion belonged to the partners in its Indonesian, Peruvian and Chilean mining companies, and $2.2 billion to Freeport-McMoRan's shareholders.
14What it needs to run
14What it needs to run
What does Freeport-McMoRan need to run?
Ore reserves
Consolidated reserves at the end of 2025 were 112.3 billion pounds of copper (78.6 billion net of other owners), 20.6 million ounces of gold and 3.5 billion pounds of molybdenum. Indonesia reserves are counted only to 2041, when its mining license ends.
A few large mines
Grasberg in Indonesia made 30% of FY2025 consolidated copper production, Cerro Verde in Peru 26% and Morenci in Arizona 15%. Grasberg made 98% of its gold.
Mining rights in Indonesia
PT Freeport Indonesia mines under a special license (IUPK) that runs to 2041. A Feb 18, 2026 agreement in principle with the government covers an extension beyond 2041.
Capital spending
Capital expenditures were $4,494 million in FY2025, of which $2,358 million was in Indonesia, including its new smelter. They were $2,115 million in FY2021.
People
About 29,000 employees at Dec 31, 2025, plus about 27,700 contractors in Indonesia. About 28% of the workforce is under collective labor agreements.
15Where it sells
15Where it sells · FY2025
Where does Freeport-McMoRan sell?
- United States35%
- Switzerland21%
- Japan11%
- Indonesia8%
- Singapore5%
- United Kingdom4%
- Spain3%
- China3%
- All other countries11%
16Competitors and what protects it
16Competitors and what protects it
Who does Freeport-McMoRan compete with?
Southern Copper
NYSE: SCCO
A US-listed copper miner. Its FY2025 10-K reports revenue from contracts with customers of $13,420 million and net income of $4,348 million, including a small share for noncontrolling holders.
Newmont
NYSE: NEM
Mainly a gold producer; gold was 15.0% of Freeport-McMoRan's FY2025 product sales. Its FY2025 10-K reports revenue from contracts with customers of $22,669 million and net income attributable to Newmont of $7,085 million.
What protects the business
Each strength is scored 1 (weak) to 5 (strong) for the business, with the reason. It is not a rating of the share.
- Size of reserves4 of 5
Consolidated reserves were 112.3 billion pounds of copper and 20.6 million ounces of gold at the end of 2025.
- Grasberg ore body4 of 5
At normal rates its Indonesian underground mines produce about 1.7 billion pounds of copper and 1.3 million ounces of gold a year through 2041, the 10-K says.
- Own processing plants3 of 5
It refines and makes rod in the US, runs the Atlantic Copper smelter in Spain, and started a new smelter in Indonesia in 2025.
- Borrowing strength3 of 5
The company states senior unsecured debt ratings of Baa2 (Moody's), BBB (Fitch) and BBB- (S&P), all stable, as of Jan 31, 2026.
Weak spot
One Indonesian district
Indonesia operations made 54.8% of FY2025 segment operating income before corporate costs, and Freeport-McMoRan owns 48.76% of them. The Sep 2025 mud rush cut Indonesia copper production from 1,800 million pounds in FY2024 to 1,015 million in FY2025.
Sources (3)
- Southern Copper FY2025 10-K, XBRL facts RevenueFromContractWithCustomerExcludingAssessedTax and ProfitLoss (accession 0001104659-26-021492)
- Newmont FY2025 10-K, XBRL facts RevenueFromContractWithCustomerExcludingAssessedTax and NetIncomeLoss (accession 0001164727-26-000010)
- Form 10-K, fiscal year 2025 (ended Dec 31, 2025)
17Where growth could come from
17Where growth could come from
Where could Freeport-McMoRan's growth come from?
Freeport-McMoRan said in its Q3 FY2026 earnings release (Oct 27, 2026) that it expects 2026 copper sales of 3.0 billion pounds, gold sales of 649 thousand ounces, unit net cash costs of $1.90 a pound and capital spending of about $4.4 billion. Its call slides that day projected copper sales volume growth of 23% in 2027 and 11% in 2028.
Grasberg Block Cave restart
BehindIndonesia mill at 67% of capacity, Q3 2026
The FY2025 10-K expected about 85% of normal PTFI production in the second half of 2026. The company said on Oct 27, 2026 that it expects 80% of capacity by mid-2027 and close to full capacity by the end of 2027.
Status: Behind, behind the company's own plan.
Bagdad expansion in Arizona
New$4.5 billion approved Nov 4, 2026
The company said on Nov 4, 2026 that it expects Bagdad to produce more than 400 million pounds of copper a year in the long term, about 225 million more. The 10-K had estimated about $3.5 billion.
Status: New, recently announced.
Leaching more copper out of ore
WorkingAbout 220 million pounds a year run rate
The company targets 300 million pounds in 2027 from these leach initiatives, it said on Oct 27, 2026.
Status: Working, on track against what the company said.
Indonesian smelter
WorkingRestarted late August 2026
The new smelter made its first cathode in July 2025 and was suspended after the mud rush. The 10-K expected it to restart in the second half of 2026.
Status: Working, on track against what the company said.
Indonesia mining rights beyond 2041
EarlyApplication filed June 2026
An agreement in principle signed Feb 18, 2026 covers a life-of-resource extension, subject to an amended license. Freeport-McMoRan's share would fall to about 37% from 2042.
Status: Early, too early to judge.
Status compares progress with what the company itself said it would do: Working = on track against what the company said; Mixed = partly on track; Behind = behind the company's own plan; New = recently announced; Early = too early to judge.
Sources (6)
- Q3 FY2026 earnings release (8-K Exhibit 99.1), Oct 27, 2026
- Q3 FY2026 conference call slides (8-K Exhibit 99.2), Oct 27, 2026
- Form 10-K, fiscal year 2025 (ended Dec 31, 2025)
- 8-K filed Nov 4, 2026 (Item 8.01, Ex. 99.1): Board approves $4.5 billion Bagdad expansion
- 8-K filed Oct 2, 2026 (Items 2.02, 7.01, Ex. 99.1): Q3 2026 operational update
- 8-K filed Feb 24, 2026 (Item 8.01, Ex. 99.1): MOU with Indonesia government on life-of-resource extension of PTFI operating rights
18The company's own measures (non-GAAP)
18The company's own measures · FY2025 to Q3 FY2026
What do Freeport-McMoRan's own measures show?
Official (GAAP): Production and delivery costs, FY2025
$16.4B
Company's own measure: Unit net cash cost per pound of copper, FY2025
165 cents per pound
Site costs per pound of copper after subtracting gold and molybdenum sales as by-product credits. From Q4 FY2025 it leaves out mud rush idle and recovery costs, 17 cents a pound in FY2025.
Official (GAAP): Production and delivery costs, Q3 FY2026
$4.5B
Company's own measure: Unit net cash cost per pound of copper, Q3 FY2026
207 cents per pound
Same definition, excluding mud rush idle facility and restoration costs. The company's 2026 estimate was $1.75 a pound in January and $1.90 in October.
Official (GAAP): Net income to common stockholders, Q3 FY2026
$1.2B
Company's own measure: Adjusted net income to common stock, Q3 FY2026
$1.3B
The company adds back $101 million of after-tax net charges, mainly mud rush idle and restoration costs. The release rounds it to $1.3 billion.
Official (GAAP): Diluted earnings per share, Q3 FY2026
$0.81
Company's own measure: Adjusted earnings per diluted share, Q3 FY2026
$0.88
Same adjustments, per diluted share.
Official (GAAP): Diluted earnings per share, Q1 FY2026
$0.61
Company's own measure: Adjusted earnings per diluted share, Q1 FY2026
$0.57
Below GAAP because the company leaves out the $699 million pre-tax mud rush insurance settlement gain.
Official (GAAP): Total debt, Sep 30, 2026
$9.4B
Company's own measure: Net debt excluding debt for PT Freeport Indonesia's downstream processing facilities, Sep 30, 2026
$1.8B
Debt minus cash of $4,335 million is the company's net debt of $5,063 million; this measure also leaves out $3,237 million of debt for PT Freeport Indonesia's smelter and refinery. Its financial policy keeps this measure at no more than a $3–4 billion target.
These are the company's own measures, defined by the company. They are not comparable across companies, and they are not added together. Each sits beside the nearest official (GAAP) figure.
Learn: Non-GAAP measures: what a company's "adjusted" numbers leave out
19Financial strength and debt
19Financial strength · Sep 30, 2026
How much debt does Freeport-McMoRan have?
- Total debt$9.4B
- Cash and investments$4.3B
- Net debt (debt minus cash)$5.1B
- Net worth (shareholders' money)$21.0B
- Debt to equity
- 0.45×
- $ of debt for every $1 of shareholders' money
- Interest cover
- 17.7×
- how many times operating profit covers interest
- Net debt of $5,063 million on Sep 30, 2026 is stated in the Q3 FY2026 earnings release. Debt to equity (0.45) is a Cityfort calculation from the Q3 FY2026 10-Q; the 0.9 times is a Cityfort calculation from the Q3 FY2026 earnings release and the FY2025 10-K. Equity here is stockholders' equity of $20,981 million; noncontrolling interests of a further $12,632 million are left out.
- The company's financial policy uses net debt excluding $3,237 million of debt for PT Freeport Indonesia's smelter and refinery: $1,826 million on Sep 30, 2026 (Q3 FY2026 earnings release). The policy keeps that measure at no more than a $3–4 billion target.
- Interest coverage is FY2025 operating income of $6,518 million ÷ net interest expense of $369 million (Cityfort calculation from FY2025 10-K).
- Environmental and mine closure obligations were $5,983 million on Sep 30, 2026, outside debt. A $3.0 billion revolving credit facility running to May 2031 replaced the Oct 2027 facility on May 14, 2026. PT Freeport Indonesia's $1.75 billion revolver was extended to Sep 2031, with $250 million drawn.
Sources (5)
- Form 10-Q, Q3 FY2026 (quarter ended Sep 30, 2026)
- Q3 FY2026 earnings release (8-K Exhibit 99.1), Oct 27, 2026
- Form 10-K, fiscal year 2025 (ended Dec 31, 2025)
- 8-K filed May 20, 2026 (Items 1.01, 1.02, 2.03): new $3.0 billion revolving credit facility maturing May 2031
- 8-K filed Sep 8, 2026 (Item 8.01): PTFI $1.75 billion revolver extended to September 2031
20Who owns it
20Who owns it · ownership as of Apr 13, 2026
Who owns Freeport-McMoRan?
- Officers and directors (as a group), shares
- 0.7%
Share classes
Holders of 5% or more
From the company's proxy statement (DEF 14A), later Schedule 13G filings and the share counts on its latest annual or quarterly report. Each holder row shows the date of its own filing.
Insider trades · Form 4 data as of Nov 6, 2026
What did Freeport-McMoRan's insiders report trading?
Freeport-McMoRan's insiders made 39 Form 4A filing an insider must make within two business days of buying or selling the company's shares. Learn more filings in the 12 months to Nov 6, 2026.
They reported no purchases and 14 sales (713,538 shares) in the open market or privately (codes P and S).
None of the sales were on forms with the Rule 10b5-1 plan box checked.
The same filings report 45 other share transactions (A: 28, F: 11, M: 4, G: 2).
They also report 4 transactions in options, stock units or other derivatives.
Insiders are a company's officers, directors and owners of more than 10% of a class of its shares. Most changes in their holdings must be reported to the SEC on a Form 4 within two business days. Source: SEC Form 4 filings on EDGAR.
- P
- a purchase in the open market or privately
- S
- a sale in the open market or privately
- A
- a grant, award or other acquisition from the company under Rule 16b-3
- F
- shares withheld or handed over to pay an exercise price or tax when an award is received, exercised or vests
- M
- exercise or conversion of an option or other derivative, exempt under Rule 16b-3
- G
- a bona fide gift
Code meanings: General Instruction 8 of Form 4 (SEC).
The latest 25 of 59 transactions
Shares: A = acquired, D = disposed of. A price the filing gives only in a footnote shows as “See filing”. The 10b5-1 box is checked when at least one trade on the form was made under a Rule 10b5-1 plan. A Form 4/A replaces the form it amends. See all of Freeport-McMoRan's Form 4 filings on EDGAR.
Learn: How to read a proxy statement (DEF 14A): Nvidia's 2026 proxy · Form 4 insider filings: who files, the codes and the footnotes · Rule 10b5-1 trading plans: how insiders pre-schedule their trades
21What it does with profit
21What it does with profit
What does Freeport-McMoRan do with its profit?
Dividend per share
$0.60FY2025
Dividend paid for each share, by financial year.
$ per share
See the numbers
Buyback · Dec 31, 2021
Shares repurchased in FY2021
$488M
Buyback · Dec 31, 2022
Shares repurchased in FY2022
$1.3B
Buyback · Dec 31, 2024
Shares repurchased in FY2024
$59M
Buyback · Dec 31, 2025
Shares repurchased in FY2025
$107M
Buyback · Sep 30, 2026
Shares repurchased in the first nine months of FY2026 (4.9 million shares)
$305M
22Governance signals
22Governance signals
What do Freeport-McMoRan's governance filings show?
- Auditor
- Ernst & Young LLP
- Auditor changes
- None in the period covered
- Audit qualifications
- None reported
- Related-party dealings
- Freeport-McMoRan sells copper to partners in its mines: sales to the other owners of its South American mines and to Morenci's joint venture partners were $1.5 billion in FY2025. Mitsubishi Materials Corporation, PTFI's partner in the PT Smelting plant, bought $1.7 billion.
- Credit rating
- Moody's, Fitch and S&P (as stated in Freeport-McMoRan's FY2025 10-K) Baa2 (Moody's) / BBB (Fitch) / BBB- (S&P), senior unsecured debt (Stable at all three), Jan 31, 2026
A credit rating describes the company's ability to repay debt. It is not a rating of the share.
Flags to know about
regulatory
Mine safety order at Morenci
On Jan 14, 2026 the Mine Safety and Health Administration issued an imminent danger order at Morenci over fall protection on a conveyor. No one was injured, and the order was terminated the same day.
other
Nine deaths at work in 2025
The FY2025 10-K reports nine work-related fatalities in 2025, seven of them in the Grasberg mud rush, against two in 2024.
23What the market paid
23What the market paid · price as of Nov 5, 2026
What did the market pay for Freeport-McMoRan on Nov 5, 2026?
Price as of Nov 5, 2026 (shown for education; prices change daily).
Closing price of $57.90 on Nov 5, 2026, from Nasdaq's historical price table for FCX; Freeport-McMoRan's shares trade on the NYSE. Market value of about $83.1 billion (Cityfort calculation from the Nov 5, 2026 closing price and Q3 FY2026 10-Q) = $57.90 × 1,434.9 million shares on Oct 31, 2026. P/E is price ÷ earnings per share: 24.3 on $2.38, the sum of diluted EPS for the four quarters to Sep 30, 2026 (Cityfort calculation from the Q4 FY2025 to Q3 FY2026 earnings releases), which includes the Q1 FY2026 insurance gain. P/B = market value ÷ stockholders' equity of $20,981 million on Sep 30, 2026 (Cityfort calculation from Q3 FY2026 10-Q). EV/EBITDA is left out because EBITDA counts the parts of its mines that other owners hold.
- Share price
- $57.90
- Market value (market cap)
- $83.1B
- P/E
- 24.3×
- P/B
- 4×
More price-based ratios · as of Nov 5, 2026
Each ratio divides a number from the company's filings by the market value or share price on Nov 5, 2026. Prices change daily, so these ratios do too.
Price to sales (P/S)
3.1×
$83.1B market value ÷ $26.4B revenue (four quarters to Sep 30, 2026) = 3.1×
Cityfort calculation from the Nov 5, 2026 closing price and the Q4 FY2025 to Q3 FY2026 10-Qs and earnings releases. Source: FCX historical daily prices, Nasdaq table for an NYSE-listed share (close of Nov 5, 2026: $57.90); Form 10-Q, Q3 FY2026 (quarter ended Sep 30, 2026); Q4 FY2025 earnings release (8-K Exhibit 99.1), Jan 22, 2026 and 3 more
How price ratios workDividend yield
1.04%
$0.60 dividends per share (FY2025) ÷ $57.90 share price = 1.04%
Cityfort calculation from the FY2025 10-K and the Nov 5, 2026 closing price. Source: FCX historical daily prices, Nasdaq table for an NYSE-listed share (close of Nov 5, 2026: $57.90); Form 10-Q, Q3 FY2026 (quarter ended Sep 30, 2026); Q4 FY2025 earnings release (8-K Exhibit 99.1), Jan 22, 2026 and 4 more
What dividend yield meansFree cash flow yield
1.3%
$1.1B free cash flow (FY2025) ÷ $83.1B market value = 1.3%
Cityfort calculation from the FY2025 10-K and the Nov 5, 2026 closing price. Source: FCX historical daily prices, Nasdaq table for an NYSE-listed share (close of Nov 5, 2026: $57.90); Form 10-Q, Q3 FY2026 (quarter ended Sep 30, 2026); Q4 FY2025 earnings release (8-K Exhibit 99.1), Jan 22, 2026 and 4 more
What free cash flow means
Shares used for the market value: 1,434.94 million ($57.90 × 1,434.94 million shares ≈ $83.1B). Source: Form 10-Q, Q3 FY2026 (quarter ended Sep 30, 2026)
Source: FCX historical daily prices, Nasdaq table for an NYSE-listed share (close of Nov 5, 2026: $57.90); Form 10-Q, Q3 FY2026 (quarter ended Sep 30, 2026); Q4 FY2025 earnings release (8-K Exhibit 99.1), Jan 22, 2026 and 3 more
Sources (7)
- FCX historical daily prices, Nasdaq table for an NYSE-listed share (close of Nov 5, 2026: $57.90)
- Form 10-Q, Q3 FY2026 (quarter ended Sep 30, 2026)
- Q4 FY2025 earnings release (8-K Exhibit 99.1), Jan 22, 2026
- Q1 FY2026 earnings release (8-K Exhibit 99.1), Apr 23, 2026
- Q2 FY2026 earnings release (8-K Exhibit 99.1), Jul 23, 2026
- Q3 FY2026 earnings release (8-K Exhibit 99.1), Oct 27, 2026
- Form 10-K, fiscal year 2025 (ended Dec 31, 2025)
24How it got here
24How it got here
How did Freeport-McMoRan get here?
2023
Business-model change
Smaller share of the Indonesian mines
Freeport-McMoRan's economic interest in PT Freeport Indonesia fell from about 81% to 48.76% on Jan 1, 2023. The other owners' share of net income rose from 22.6% in FY2022 to 50.7% in FY2023.
2024
Milestone
New CEO
Kathleen L. Quirk became CEO in 2024; Richard C. Adkerson, CEO since 2003, stayed on as Chairman.
2024
Crisis
Indonesian smelter built, then a fire
A new smelter in Eastern Java, sized for 1.7 million metric tons of concentrate a year, was completed in 2024. A fire in Oct 2024 delayed it; it made its first cathode in July 2025.
2024
Milestone
More of Cerro Verde
It paid $210 million to raise its stake in Cerro Verde from 53.56% to 55.08%.
2025
Crisis
Grasberg mud rush
On Sep 8, 2025 a mud rush at the Grasberg Block Cave mine killed seven workers and stopped mining. Indonesia copper production fell from 1,800 million pounds in FY2024 to 1,015 million in FY2025.
2026
Milestone
Path to extend Indonesian rights
On Feb 18, 2026 it signed an agreement in principle with Indonesia for mining rights beyond 2041, and applied for the extension in June 2026.
2026
Milestone
Insurance settlement
A $699 million pre-tax gain from the mud rush insurance settlement was booked in Q1 FY2026, and $0.7 billion was collected in April 2026.
2026
Business-model change
Bagdad expansion approved
On Nov 4, 2026 the board approved a $4.5 billion expansion of the Bagdad mine in Arizona.
Sources (8)
- Form 10-K, fiscal year 2023 (ended Dec 31, 2023)
- 2026 proxy statement (DEF 14A), annual meeting Jun 10, 2026, record date Apr 13, 2026
- Form 10-K, fiscal year 2025 (ended Dec 31, 2025)
- 8-K filed Feb 24, 2026 (Item 8.01, Ex. 99.1): MOU with Indonesia government on life-of-resource extension of PTFI operating rights
- Q3 FY2026 earnings release (8-K Exhibit 99.1), Oct 27, 2026
- Q1 FY2026 earnings release (8-K Exhibit 99.1), Apr 23, 2026
- Form 10-Q, Q3 FY2026 (quarter ended Sep 30, 2026)
- 8-K filed Nov 4, 2026 (Item 8.01, Ex. 99.1): Board approves $4.5 billion Bagdad expansion
25Sources and changes
Where every number on this page comes from
Sources (24 documents)
- S1Form 10-K, fiscal year 2025 (ended Dec 31, 2025) · Freeport-McMoRan (SEC EDGAR) · Tier 1: company or exchange filing · Feb 13, 2026
- S2Form 10-K, fiscal year 2023 (ended Dec 31, 2023) · Freeport-McMoRan (SEC EDGAR) · Tier 1: company or exchange filing · Feb 16, 2024
- S3Form 10-K, fiscal year 2022 (ended Dec 31, 2022) · Freeport-McMoRan (SEC EDGAR) · Tier 1: company or exchange filing · Feb 15, 2023
- S4Form 10-Q, Q3 FY2026 (quarter ended Sep 30, 2026) · Freeport-McMoRan (SEC EDGAR) · Tier 1: company or exchange filing · Nov 6, 2026
- S5Q3 FY2026 earnings release (8-K Exhibit 99.1), Oct 27, 2026 · Freeport-McMoRan (SEC EDGAR) · Tier 1: company or exchange filing · Oct 27, 2026
- S6Q2 FY2026 earnings release (8-K Exhibit 99.1), Jul 23, 2026 · Freeport-McMoRan (SEC EDGAR) · Tier 1: company or exchange filing · Jul 23, 2026
- S7Q1 FY2026 earnings release (8-K Exhibit 99.1), Apr 23, 2026 · Freeport-McMoRan (SEC EDGAR) · Tier 1: company or exchange filing · Apr 23, 2026
- S8Q4 FY2025 earnings release (8-K Exhibit 99.1), Jan 22, 2026 · Freeport-McMoRan (SEC EDGAR) · Tier 1: company or exchange filing · Jan 22, 2026
- S9Q3 FY2025 earnings release (8-K Exhibit 99.1), Oct 23, 2025 · Freeport-McMoRan (SEC EDGAR) · Tier 1: company or exchange filing · Oct 23, 2025
- S10Q2 FY2025 earnings release (8-K Exhibit 99.1), Jul 23, 2025 · Freeport-McMoRan (SEC EDGAR) · Tier 1: company or exchange filing · Jul 23, 2025
- S11Q1 FY2025 earnings release (8-K Exhibit 99.1), Apr 24, 2025 · Freeport-McMoRan (SEC EDGAR) · Tier 1: company or exchange filing · Apr 24, 2025
- S12Q4 FY2024 earnings release (8-K Exhibit 99.1), Jan 23, 2025 · Freeport-McMoRan (SEC EDGAR) · Tier 1: company or exchange filing · Jan 23, 2025
- S13Q3 FY2026 conference call slides (8-K Exhibit 99.2), Oct 27, 2026 · Freeport-McMoRan (SEC EDGAR) · Tier 1: company or exchange filing · Oct 27, 2026
- S142026 proxy statement (DEF 14A), annual meeting Jun 10, 2026, record date Apr 13, 2026 · Freeport-McMoRan (SEC EDGAR) · Tier 1: company or exchange filing · Apr 23, 2026
- S15Schedule 13G, Vanguard Capital Management, 7.49% (event date Mar 31, 2026) · Vanguard Capital Management (SEC EDGAR) · Tier 1: company or exchange filing · Apr 29, 2026
- S168-K filed Nov 4, 2026 (Item 8.01, Ex. 99.1): Board approves $4.5 billion Bagdad expansion · Freeport-McMoRan (SEC EDGAR) · Tier 1: company or exchange filing · Nov 4, 2026
- S178-K filed Feb 24, 2026 (Item 8.01, Ex. 99.1): MOU with Indonesia government on life-of-resource extension of PTFI operating rights · Freeport-McMoRan (SEC EDGAR) · Tier 1: company or exchange filing · Feb 24, 2026
- S188-K filed Oct 2, 2026 (Items 2.02, 7.01, Ex. 99.1): Q3 2026 operational update · Freeport-McMoRan (SEC EDGAR) · Tier 1: company or exchange filing · Oct 2, 2026
- S198-K filed May 20, 2026 (Items 1.01, 1.02, 2.03): new $3.0 billion revolving credit facility maturing May 2031 · Freeport-McMoRan (SEC EDGAR) · Tier 1: company or exchange filing · May 20, 2026
- S218-K filed Jan 16, 2026 (Item 1.04): MSHA imminent danger order at Morenci, terminated same day · Freeport-McMoRan (SEC EDGAR) · Tier 1: company or exchange filing · Jan 16, 2026
- S228-K filed Sep 8, 2026 (Item 8.01): PTFI $1.75 billion revolver extended to September 2031 · Freeport-McMoRan (SEC EDGAR) · Tier 1: company or exchange filing · Sep 8, 2026
- S23FCX historical daily prices, Nasdaq table for an NYSE-listed share (close of Nov 5, 2026: $57.90) · Nasdaq, Inc. · Tier 1: company or exchange filing · Nov 5, 2026
- S24Southern Copper FY2025 10-K, XBRL facts RevenueFromContractWithCustomerExcludingAssessedTax and ProfitLoss (accession 0001104659-26-021492) · Southern Copper (SEC EDGAR) · Tier 1: company or exchange filing · Feb 27, 2026
- S25Newmont FY2025 10-K, XBRL facts RevenueFromContractWithCustomerExcludingAssessedTax and NetIncomeLoss (accession 0001164727-26-000010) · Newmont (SEC EDGAR) · Tier 1: company or exchange filing · Feb 19, 2026
Changes to this page (v1 · Nov 6, 2026)
- v1 · Nov 6, 2026First version, through Q3 FY2026 (quarter ended Sep 30, 2026), from the earnings release filed Oct 27, 2026 and the 10-Q filed Nov 6, 2026. (first version)
Numbers come only from tier 1 and tier 2 sources. Read how we research.
Disclaimer
For learning only. Cityfort is not a registered investment adviser or broker-dealer and does not recommend buying or selling any security. Prices shown are dated and may be out of date.
Investing in securities involves risk, including loss of capital. Before making any investment decision, do your own research and consider consulting a registered investment adviser or other qualified professional.
Cityfort, its owners and contributors may or may not hold securities of companies covered. Cityfort is not paid by any company it covers. Content is not an offer or solicitation to buy or sell any security, including in any initial public offering.
Read the positions policyRead the full disclaimerHide the full disclaimer
Cityfort publishes general educational content that explains how listed companies work. Cityfort is not registered with the US Securities and Exchange Commission or any state securities regulator as an investment adviser, and is not a broker-dealer or a member of FINRA. Cityfort does not provide investment, tax or legal advice, recommendations, ratings, price targets or any opinion on whether to buy, sell or hold any security. Nothing on the site is tailored to any person's circumstances.
All information is taken from publicly available sources, mainly company filings with the SEC, which are listed on each page with dates. We work to keep it accurate and correct errors publicly, but we do not guarantee that it is complete, accurate or up to date. Any market price or price-based ratio shown is dated, may be out of date by the time you read it, and is included only to explain concepts.
Statements by company management, including forward-looking statements and guidance, are reported as the company's statements, with their date and source; they are not our forecasts. Adjusted (non-GAAP) figures are the company's own measures and are shown next to the official (GAAP) figures.