Technology · NASDAQ: MCHP
Microchip: how the business works
Microchip Technology designs and makes the small control chips inside cars, factory machines and data center servers. Net sales were $4.71 billion in FY2026, down from $8.44 billion in FY2023.
By Hardik Bhandare · Checked against filings: . Editorial policy. Corrections
Follow Microchip
Email me when Microchip's page is updated after earnings.
We'll send a confirmation email first. See our privacy policy.
Microchip Technology Incorporated · Chandler, Arizona · Founded 1989
Updated for Q2 FY2027 · checked
- Net sales, FY2026
- $4.71B
- Net income, FY2026 ($118.8M left for common holders)
- $230M
- Net sales, Q2 FY2027 (up 42.2% from a year earlier)
- $1.62B
- Employees, FY2026 10-K
- About 17,900
- Largest holder, BlackRock (2026 proxy)
- 10.00%
The short version
Microchip in 5 points
1 · What it sells
Microchip sells small control chips: microcontrollers brought in $2,355.4 million, 50.0% of FY2026 net sales of $4.71 billion, and analog chips $1,329.0 million, 28.2%.
2 · Who pays it
In FY2026, direct customers paid 49.6% of Microchip's net sales, distributors such as Arrow Electronics 46.9% and technology licensees 3.5%.
3 · What it keeps from $100
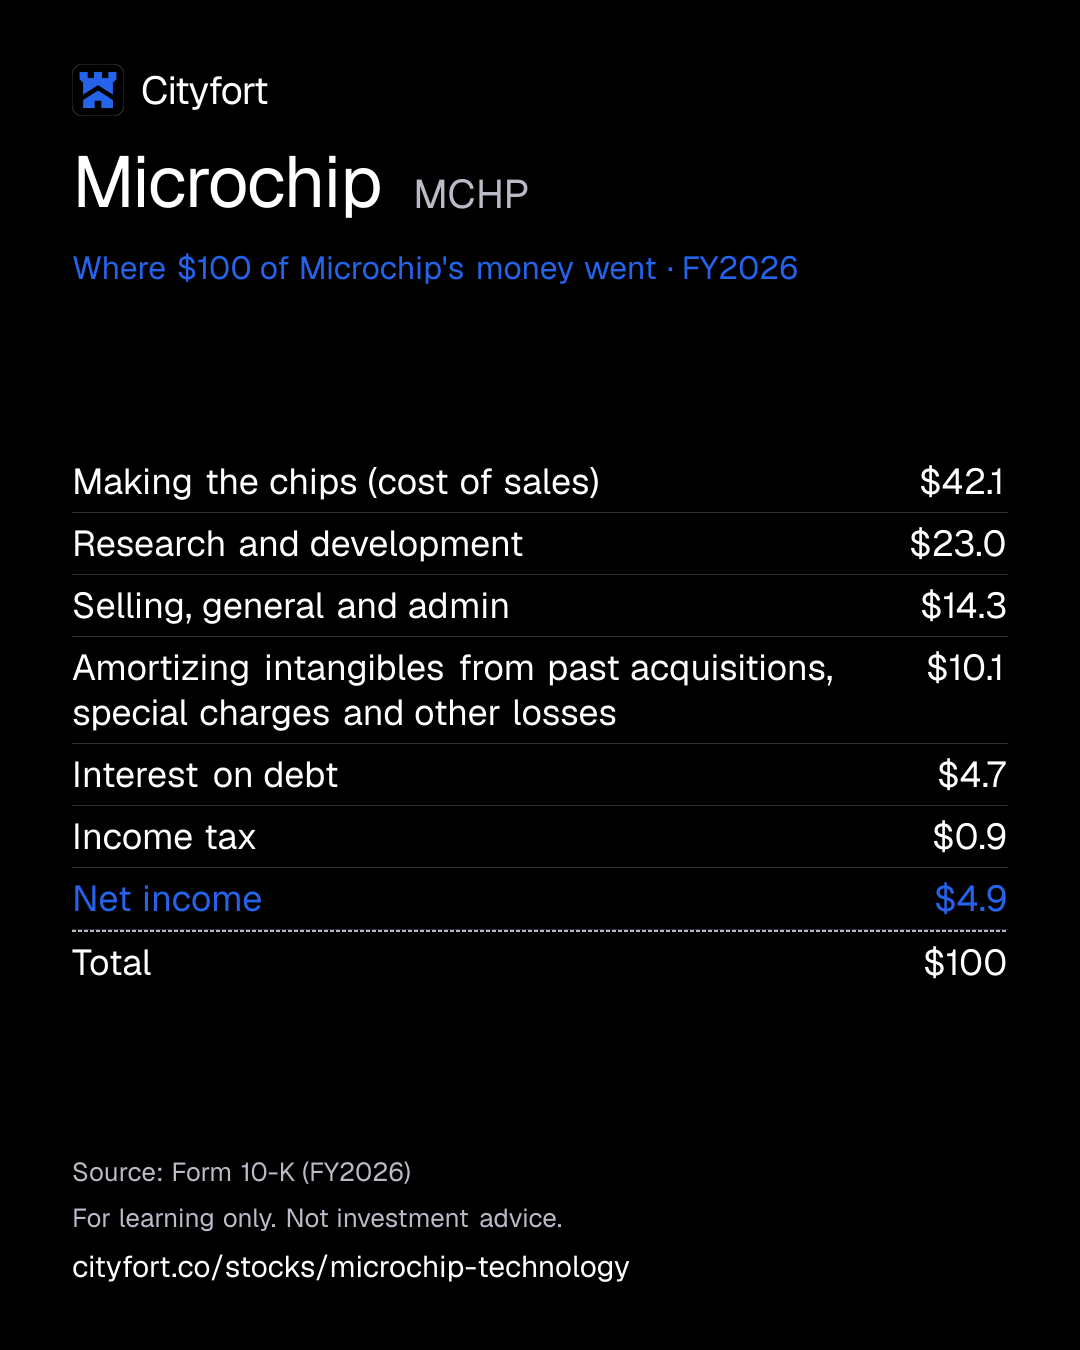
Of every $100 that came in during FY2026, Microchip kept $4.9 as net income; the only non-operating income was $11.4 million of interest, while $10.1 went on amortizing intangibles from past acquisitions, special charges and other losses.
4 · Where the operating profit comes from
Microchip does not report operating profit by segment: semiconductor products made $2,557.3 million of FY2026 gross profit, and technology licensing, which has no cost of sales, $163.8 million.
5 · The one thing to watch
Microchip guided on Nov 5, 2026 for December 2026 quarter net sales of $1.573 billion to $1.638 billion, after $1,621.5 million in the September 2026 quarter.
Sources: From Microchip's FY2026 10-K and its Nov 5, 2026 earnings release · checked
01Where the money goes · FY2026
Where does $100 of Microchip's money go?
Microchip · FY2026
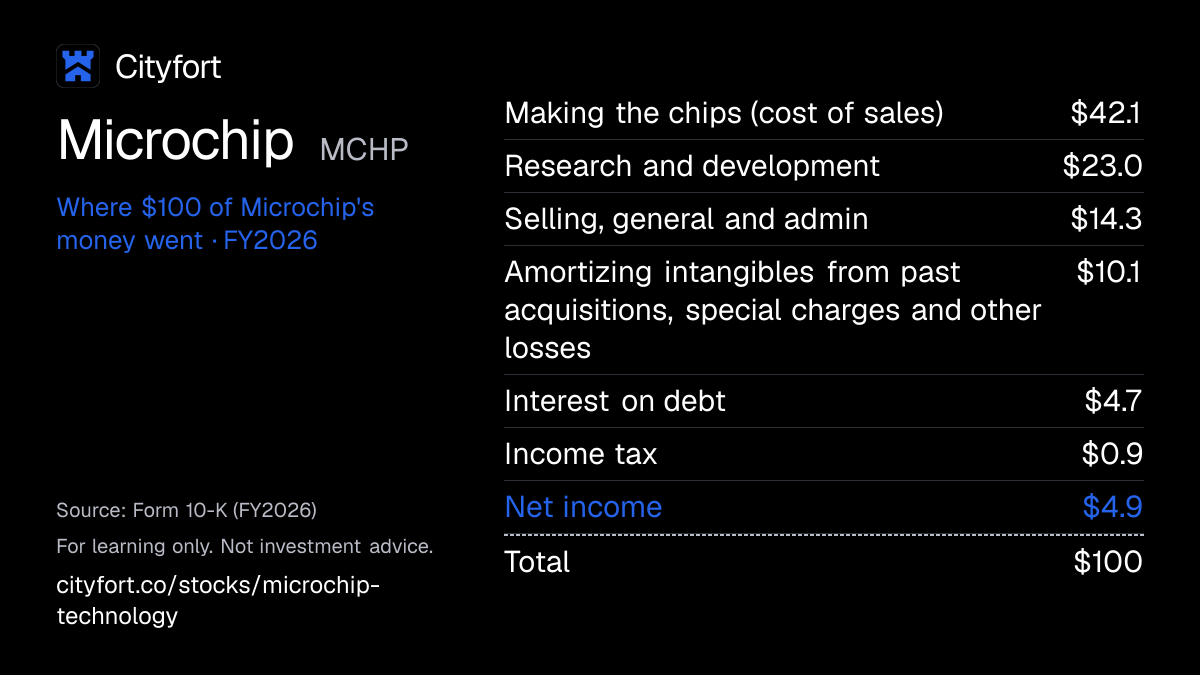
Receipt for every $100
| Making the chips (cost of sales) | $42.1 |
|---|---|
| Research and development | $23.0 |
| Selling, general and admin | $14.3 |
| Amortizing intangibles from past acquisitions, special charges and other losses | $10.1 |
| Interest on debt | $4.7 |
| Income tax | $0.9 |
| Net income | $4.9 |
| Total | $100 |
Each line = amount ÷ total money in × 100. Lines may not add to exactly $100 because of rounding.
How this is worked out
Cityfort calculation from the FY2026 10-K. Money in for FY2026 was $4,724.5 million: net sales plus $11.4 million of interest income. Each line = line ÷ $4,724.5 million × 100. About $2.4 of the $4.9 of net income went to preferred dividends.
Save this receipt as an image
Embed this receipt or the key numbers
Paste this code into a blog or website to show the card you choose, with a link back to this page.
Each week: the next company due to report earnings, explained in 5 points.
No tips. Unsubscribe anytime.
We'll send a confirmation email. See our privacy policy.
02The business in one line
What does Microchip do?
Manufacturers and electronics distributors pay Microchip for chips it designs and partly makes in its own wafer factories. In FY2026, making the chips took $42.1 of every $100 that came in, research took $23.0, and $4.9 was left as net income.
- Microcontrollers, small computers on one chip that run one job inside a product, were 50.0% of FY2026 net sales. Analog chips were 28.2%, and FPGAs, licensing and other products 21.8%.
- Net sales fell 42.3% in FY2025, to $4,401.6 million. In the Sep 2026 quarter they were $1,621.5 million, up 42.2% from a year earlier.
03Who pays it
Who pays Microchip?
Distributors
46.9%
of revenue
Electronics wholesalers such as Arrow Electronics that resell Microchip chips to many smaller manufacturers. $2,209.6 million in FY2026.
Direct customers
49.6%
of revenue
Larger manufacturers served by Microchip's own sales force in the Americas, Europe and Asia. $2,339.7 million in FY2026.
Licensees
3.5%
of revenue
Chipmakers and foundries that pay license fees and royalties to use SuperFlash and other technology. $163.8 million in FY2026.
- Distributors46.9%
- Direct customers49.6%
- Licensees3.5%
Customer concentration
Arrow Electronics, the largest distributor, was 12% of FY2026 net sales (10% in FY2025); no other distributor or direct customer was above 10%. Shares by payer type are a Cityfort calculation from the FY2026 10-K.
- Largest customer
- 12%
Sources (1)
04How it makes money
How does Microchip make money?
High fixed factory and research costs make profit swing much more than sales.
Fabs and research cost about the same whether orders are high or low. When FY2025 net sales fell 42.3%, net income fell to a small loss. The Q2 FY2027 10-Q credits a price increase, product mix and lower idle-capacity charges for the higher gross margin since.
Gross profit per $100 of net sales
$67.5$57.7
FY2023 to FY2026
- An engineer designs a Microchip chip into a new product (a design win).
- The product goes into production, and orders arrive through distributors or direct.
- Chips are made in Microchip's fabs or at outside foundries.
- More volume spreads the fixed cost of fabs and research over more chips.
- Profit pays for research, dividends and debt.
↺ Step 5 feeds back into step 1.
05Business segments · FY2026
Which businesses make up Microchip?
Semiconductor products
96.5%Selling chips: microcontrollers, analog, FPGAs, memory and more. Segment gross profit was $2,557.3 million in FY2026.
Revenue $4.5B ($4,549M)
Technology licensing
3.5%Fees and royalties for SuperFlash and other technology; it has no cost of sales, so all of it is gross profit.
Revenue $164M
How the mix changed
- Semiconductor products
- Technology licensing
Revenue by segment, FY2022 to FY2026.
US$
See the numbers
06The numbers · Consolidated · US$
How has Microchip done?
Revenue
$4.7BFY2026
Net sales peaked at $8.44 billion in FY2023, fell 42.3% in FY2025 alone to $4.40 billion and rose to $4.71 billion in FY2026.
US$
See the numbers
Net income
$119MFY2026
Net income for common stockholders fell from $2.24 billion in FY2023 to a $2.7 million loss in FY2025 and was $118.8 million in FY2026 ($230.0 million before preferred dividends).
US$
See the numbers
Net income for every $100 of revenue
$2.5FY2026
Microchip kept $26.5 of net income per $100 of net sales in FY2023, almost nothing in FY2025 and $2.5 in FY2026 for common holders ($4.9 before preferred dividends).
Net margin: $ of net income per $100 of revenue
See the numbers
Free cash flow
$871MFY2026
Free cash flow fell from $3.13 billion in FY2023 to $871.0 million in FY2026, a year with $255.4 million of stock-based pay.
US$ · cash from operations minus spending on plants and equipment
See the numbers
See all yearly numbers
EBITDA here = operating income plus depreciation and amortization (from the cash flow statement). Fiscal years are the company's own: Fiscal year ends on Mar 31 (FY2026 = year ended Mar 31, 2026). Net income is the share belonging to the company's owners. Total net income differs from net profit to the company's owners: Total net income is before $111.2 million of dividends on the 7.50% Series A mandatory convertible preferred stock; net income and EPS above are for common stockholders.
Learn: Fiscal years that don't end in December: Nvidia's FY2027 explained · Stock-based compensation and dilution: pay that becomes shares
Sources (21)
- Form 10-K for FY2022
- Form 10-K for FY2023
- Form 10-K for FY2024
- Form 10-K for FY2025
- Form 10-K for FY2026
- Form 10-Q for Q3 FY2024
- Q4 FY2025 earnings release (8-K Ex. 99.1)
- Form 10-Q for Q1 FY2025
- Form 10-Q for Q2 FY2025
- Form 10-Q for Q3 FY2025
- Form 10-Q for Q1 FY2026
- Q1 FY2026 earnings release (8-K Ex. 99.1)
- Form 10-Q for Q2 FY2026
- Q2 FY2026 earnings release (8-K Ex. 99.1)
- Form 10-Q for Q3 FY2026
- Q3 FY2026 earnings release (8-K Ex. 99.1)
- Q4 FY2026 earnings release (8-K Ex. 99.1)
- Form 10-Q for Q1 FY2027
- Q1 FY2027 earnings release (8-K Ex. 99.1)
- Form 10-Q for Q2 FY2027
- Q2 FY2027 earnings release (8-K Ex. 99.1)
07Who runs it
Who runs Microchip, and did they deliver?
Steve Sanghi
Chair, CEO and President · since 2024
CEO from Oct 1991 to Mar 2021 and chair since Oct 1993. Returned as interim CEO on Nov 18, 2024; made permanent CEO on Jul 2, 2025.
Richard J. Simoncic
Chief Operating Officer · since 2024
COO since Apr 1, 2024; joined Microchip in 1990.
J. Eric Bjornholt
Senior Corporate VP and Chief Financial Officer · since 2009
CFO since Jan 2009; joined Microchip in 1995.
Mathew B. Bunker
Senior Corporate VP, Operations · since 1993
Joined Microchip in Feb 1993.
Joseph R. Krawczyk II
Senior Corporate VP, Worldwide Client Engagement · since 1995
Joined Microchip in Sep 1995.
Matthew W. Chapman
Lead independent director · since 2024
Lead independent director since Nov 2024; on the board since May 1997.
What they said, and what happened
4 delivered · 1 too early to tell
Said on Aug 7, 2025
Guided September 2025 quarter net sales of $1.130 billion, plus or minus $20.0 million.
DeliveredWhat happened
Net sales were $1,140.4 million, inside the range.
Said on Mar 3, 2025
Said in a Mar 3, 2025 8-K that it expected to shut down manufacturing at Fab 2 in Tempe, Arizona in May 2025.
DeliveredWhat happened
The FY2026 10-K says the closure was completed in May 2025.
Said on Feb 5, 2026
Guided March 2026 quarter net sales of $1.260 billion, plus or minus $20.0 million.
DeliveredWhat happened
Net sales were $1,311.2 million, above the top of the range.
Said on Aug 6, 2026
Guided September 2026 quarter net sales of $1.589 billion to $1.618 billion.
DeliveredWhat happened
Net sales were $1,621.5 million, just above the top of the range.
Said on Nov 5, 2026
Guided December 2026 quarter net sales of $1.573 billion to $1.638 billion.
Too early to tellWhat happened
Due with the Q3 FY2027 results.
Sources (9)
- Form 10-K for FY2026
- 2026 proxy statement (DEF 14A)
- Q1 FY2026 earnings release (8-K Ex. 99.1)
- Form 10-Q for Q2 FY2026
- 8-K filed Mar 3, 2025: Fab 2 timing and headcount reductions
- Q3 FY2026 earnings release (8-K Ex. 99.1)
- Q4 FY2026 earnings release (8-K Ex. 99.1)
- Q1 FY2027 earnings release (8-K Ex. 99.1)
- Q2 FY2027 earnings release (8-K Ex. 99.1)
08What could go wrong
What could go wrong for Microchip?
- Demand
Sharp swings in chip orders
Customers can push out or cancel orders when they hold too much stock. Net sales fell 42.3% in FY2025, to $4,401.6 million, and the company booked a small net loss.
Watch Distributor inventory days and net sales against guidance each quarter.
- Concentration
Reliance on distributors and Arrow
Distributors handled 47% of FY2026 net sales, and Arrow Electronics alone 12%. Most distributor relationships can end with little notice.
Watch Arrow's share of net sales in the next 10-K.
- Regulation
China competition and trade rules
China was 18% and Taiwan 15% of FY2026 net sales. The 10-K says competition in China is intense, and lists tariffs, export controls and rare earth limits as risks.
Watch China share of net sales and any new US or Chinese trade measures.
- Debt
Debt and the preferred dividend
Debt was $5,551.9 million before discounts at Sep 30, 2026, with $1,000 million due in FY2028. One agency cut its rating in March 2025, and the preferred stock costs $27.8 million a quarter.
Watch Net debt each quarter and any rating action.
- Execution
Dependence on outside wafer makers
Outside foundries made the products behind about 65% of FY2026 sales. Sanghi said on Nov 5, 2026 that lead times are lengthening and Microchip is working to secure more wafer supply.
Watch Lead times and gross margin in the next earnings releases.
- Legal
Malaysia tax assessment
A disputed fiscal 2020 assessment could mean taxes and penalties of up to MYR 1.9 billion ($473.2 million at Sep 30, 2026 rates). That applies only if the highest court upholds it.
Watch The appeal before the Special Commissioners of Income Tax.
- Other
More shares from conversions
Each of the 1,485,000 preferred shares converts on Mar 15, 2028 into 16.0060 to 19.6080 common shares. That is about 23.8 to 29.1 million shares (Cityfort calculation from the Q2 FY2027 10-Q). Convertible notes can also turn into shares.
Watch Diluted share count each quarter.
09Supporters vs. critics
What do supporters and critics point to?
What supporters point to
- Net sales rose from $970.5 million in Q4 FY2025 to $1,621.5 million in Q2 FY2027, and net income for common stockholders went from a $156.8 million loss to $373.6 million.
- GAAP gross margin was 65.9% in the Sep 2026 quarter, up from 55.9% a year earlier.
- Net sales came in inside or above Microchip's guided range for the Sep 2025, Mar 2026 and Sep 2026 quarters.
- Distributors held 25 days of Microchip inventory at Sep 30, 2026, down from 33 days at Mar 31, 2025.
- Sanghi said on Nov 5, 2026 that design wins for its PCIe Gen6 data center switches and retimers had reached 24, up from 12 at the end of June.
What critics point to
- Net sales fell 42.3% in FY2025, and FY2026's $4,713.1 million was still below FY2023's $8,438.7 million.
- Common dividends of $984.0 million in FY2026 were more than the $118.8 million of net income left for common holders and more than free cash flow of $871.0 million.
- Net debt was $5,060.2 million at Sep 30, 2026, about 5.3 times FY2026 operating cash flow (Cityfort calculation from the Q2 FY2027 10-Q and FY2026 10-K), and one rating agency cut its rating in March 2025.
- Only 45.65% of votes cast at the Aug 19, 2025 annual meeting supported executive pay.
- A disputed Malaysian tax assessment for fiscal 2020 could mean taxes and penalties of up to MYR 1.9 billion ($473.2 million at Sep 30, 2026 rates) if upheld; payment is stayed while an appeal is heard.
10What to watch next
What should you watch next at Microchip?
Next event
Q3 FY2027 results
Date not announced yet.
December 2026 quarter against the range
Microchip guided on Nov 5, 2026 for net sales of $1.573 billion to $1.638 billion in the quarter to Dec 31, 2026. September 2026 quarter net sales were $1,621.5 million.
Distributor inventory and gross margin
Distributors held 25 days of Microchip inventory at Sep 30, 2026, and GAAP gross margin was 65.9% in that quarter.
Debt and the 2028 preferred conversion
$1,000 million of debt is due in FY2028. On Mar 15, 2028 the preferred stock converts into about 23.8 to 29.1 million common shares (Cityfort calculation from the Q2 FY2027 10-Q), against 544.2 million common shares at Oct 28, 2026.
Hailo and Vorago
Microchip bought Hailo, a maker of edge AI processors, on Sep 17, 2026 and Vorago Technologies, a maker of radiation-hardened chips, on Oct 8, 2026.
11Key dates
What are the key dates for Microchip?
| Event | Date | Source |
|---|---|---|
| 2017 convertible notes mature$37.9 million of 1.625% notes. | Form 10-Q for Q2 FY2027 | |
| Fiscal 2027 endsMicrochip's fiscal year ends on Mar 31. | Form 10-K for FY2026 | |
| Series A preferred stock converts into common stockEach of the 1,485,000 preferred shares converts into 16.0060 to 19.6080 common shares. | Form 10-Q for Q2 FY2027 | |
| 2026 convertible notes mature$900 million of 0.000% notes. | 8-K filed Feb 11, 2026: 0.000% convertible senior notes due 2030; Form 10-Q for Q2 FY2027 |
Learn: Fiscal years that don't end in December: Nvidia's FY2027 explained
12Key facts
Key facts about Microchip
- What does Microchip Technology do?
- Microchip Technology, based in Chandler, Arizona, designs and makes microcontrollers, analog chips and FPGAs that go inside cars, factory machines and data center equipment. Its net sales were $4,713.1 million in FY2026, the year ended Mar 31, 2026.
- How does Microchip Technology make money?
- Microchip Technology earns almost all its money by selling chips: semiconductor products were $4,549.3 million, or 96.5%, of FY2026 net sales. Licensing its SuperFlash memory technology to other chipmakers brought in $163.8 million, or 3.5%.
- Who are Microchip Technology's customers?
- Distributors handled 47% of Microchip Technology's FY2026 net sales, according to its FY2026 10-K; the rest went to direct customers and licensees. The distributor Arrow Electronics was 12% of FY2026 net sales, and no other customer was above 10%.
- How big is Microchip Technology?
- Microchip Technology had net sales of $4,713.1 million and net income of $230.0 million in FY2026. Net income attributable to common stockholders, after preferred dividends, was $118.8 million. Net sales were $8,438.7 million in FY2023.
- How did Microchip Technology do in its latest quarter?
- In the quarter ended Sep 30, 2026 (Q2 FY2027), Microchip Technology's net sales were $1,621.5 million, up 42.2% from $1,140.4 million a year earlier. Net income attributable to common stockholders was $373.6 million, or $0.68 per diluted share.
- Where does Microchip Technology sell its chips?
- Asia was 49.9% of Microchip Technology's FY2026 net sales, the Americas 29.5% and Europe 20.6%.
- Who owns Microchip Technology?
- No single holder controls Microchip Technology. Its 2026 proxy statementThe yearly filing about shareholder votes, the board and executive pay. Learn more, with a record date of Jun 22, 2026, lists BlackRock with 10.00% of common shares, and directors and officers as a group with 1.79%, including Chair and CEO Steve Sanghi's 1.74%.
- Who runs Microchip Technology?
- Steve Sanghi is Microchip Technology's chair, CEO and president. He was CEO from Oct 1991 to Mar 2021, returned as interim CEO on Nov 18, 2024 and was made permanent CEO on Jul 2, 2025.
- How much debt does Microchip Technology have?
- At Sep 30, 2026 Microchip Technology had $5,517.2 million of debt at book value and $457.0 million of cash and short-term investments, so net debt was $5,060.2 million (Cityfort calculation from the Q2 FY2027 10-Q).
- Does Microchip Technology pay a dividend?
- Microchip Technology has paid a quarterly cash dividend since October 2002. In FY2026 it paid $984.0 million of common dividends and bought back no shares.
Terms on this page
- Capital expenditures (capex)
- Customer concentration
- Debt-to-equity
- Earnings per share (EPS)
- EBITDA
- Free cash flow
- Gross margin
- Net debt
- Net margin
- Revenue vs net income
Each explains the term in plain English, with the same number from other companies on Cityfort.
Go deeper
More detail from the same filings. Open any section.
13What it sells
13What it sells
What does Microchip sell?
Mixed-signal microcontrollers
Small computers on one chip, 8- to 32-bit, plus microprocessors, that run one job inside a product. They brought in $2,355.4 million in FY2026, 50.0% of net sales.
Analog chips
Chips that handle real-world signals such as power, sensing and interface. They brought in $1,329.0 million in FY2026, 28.2% of net sales.
Other: FPGAs, licensing, memory and more
Programmable FPGA chips, royalties for its SuperFlash memory technology, memory, timing and aerospace products, and engineering services. Together $1,028.7 million in FY2026, 21.8% of net sales.
Data center connectivity
The FY2026 10-K lists storage controllers, memory controllers and switches for AI data centers among its products; it does not report their sales separately.
Think of it like this
A microcontroller is like a tiny brain built for one task, such as running a power tool or a car's keyless entry.
What it does
- Does: Designs chips and makes part of them in its own wafer factories in Oregon and Colorado.
- Does: Sells low-cost development tools that help engineers program its chips.
- Does: Licenses its SuperFlash memory technology to other chipmakers for fees and royalties.
What it does not do
- Does not: It does not make all its own wafers: products made at outside foundries were about 65% of FY2026 sales.
- Does not: It does not depend on one end customer: apart from the distributor Arrow Electronics (12%), no customer was above 10% of FY2026 net sales.
- Does not: It has no long-term agreements with most distributors; either side can end the relationship with little notice.
Sources (1)
14How the money flows
14How the money flows · FY2026
How does money flow through Microchip?
Money in
- Net sales$4.7B
- Interest income$11.4M
The company
Microchip
$4.7B came in
Money out
- Making the chips (cost of sales)$2.0B
- Research and development$1.1B
- Selling, general and admin$674M
- Amortizing intangibles from past acquisitions, special charges and other losses$478M
- Interest on debt$221M
- Income tax$43.5M
- Net income$230M
- Manufacturers and distributors paid Microchip $4,713.1 million for chips and licenses in FY2026, plus $11.4 million of interest income.
- Making the chips took $1,992.0 million, and research on new chips took $1,085.9 million.
- Sales staff and head office took $674.3 million. Another $431.1 million was the yearly write-off of past acquisitions, plus $46.4 million of special charges and other losses.
- Interest on about $5.5 billion of debt took $221.3 million and tax $43.5 million, leaving $230.0 million of net income.
- Preferred shareholders were owed $111.2 million of dividends, so $118.8 million was left for common shareholders.
Sources (1)
15What it needs to run
15What it needs to run
What does Microchip need to run?
Its own wafer factories
Fab 4 in Gresham, Oregon and Fab 5 in Colorado Springs. Products from its own US fabs were about 35% of FY2026 sales. Fab 2 in Tempe, Arizona closed in May 2025.
Outside foundries
Contract chip factories made the products behind about 65% of FY2026 sales, including all of Microchip's 300mm wafers.
Assembly and test plants
Microchip packages and tests chips in Thailand and the Philippines; its own plants did about 70% of assembly in the Sep 2026 quarter.
Engineers and research
Microchip had about 17,900 employees at the end of FY2026, down from 22,600 at the end of FY2023. It spent $1,085.9 million on research in FY2026.
Materials
The Q2 FY2027 10-Q notes that China expanded export limits on some rare earth elements in 2025. Some chip materials come from only a few countries.
16Where it sells
16Where it sells · FY2026
Where does Microchip sell?
- Asia49.9%
- Americas29.5%
- Europe20.6%
Sources (1)
17Where growth could come from
17Where growth could come from
Where could Microchip's growth come from?
In its Nov 5, 2026 earnings release, Microchip guided December 2026 quarter net sales of $1.573 billion to $1.638 billion. That is 3% lower to 1% higher than the September quarter. CEO Steve Sanghi said normal December seasonality is a 3% to 5% fall.
Sales recovery after the inventory cut
WorkingNet sales +42.2%, Q2 FY2027 vs Q2 FY2026
Net sales were $1,621.5 million in the Sep 2026 quarter, up from $1,140.4 million a year earlier. Distributors held 25 days of Microchip inventory at Sep 30, 2026, down from 33 days at Mar 31, 2025.
Status: Working, on track against what the company said.
Margins rebuilding
WorkingGAAP gross margin 65.9% vs 55.9%
Gross profit per $100 of net sales rose from $55.9 in the Sep 2025 quarter to $65.9 in the Sep 2026 quarter. The 10-Q credits a price increase, product mix and lower idle-capacity charges.
Status: Working, on track against what the company said.
Data center chips
Early24 PCIe Gen6 design wins (Nov 5, 2026)
Sanghi said in the Nov 5, 2026 release that its PCIe Gen6 switches and retimers had 24 design wins, up from 12 at the end of June. Microchip does not report data center sales separately.
Status: Early, too early to judge.
Acquisitions in edge AI and space
NewTwo deals closed, Sep and Oct 2026
Microchip bought Hailo, a maker of edge AI processors, on Sep 17, 2026. It bought Vorago Technologies, a maker of radiation-hardened chips, on Oct 8, 2026 for about $93.1 million in cash.
Status: New, recently announced.
Status compares progress with what the company itself said it would do: Working = on track against what the company said; Mixed = partly on track; Behind = behind the company's own plan; New = recently announced; Early = too early to judge.
18The company's own measures (non-GAAP)
18The company's own measures · Q2 FY2027
What do Microchip's own measures show?
Official (GAAP): GAAP diluted EPS, Q2 FY2027
$0.68
Company's own measure: Non-GAAP diluted EPS, Q2 FY2027
$0.97
Microchip leaves out stock-based payPay given as shares instead of cash, which spreads ownership more thinly. Learn more, restructuring and acquisition costs, including amortization of acquired intangibles and Microsemi litigation costs. It also leaves out investment gains or losses and the preferred dividend.
Official (GAAP): GAAP net income attributable to common stockholders, Q2 FY2027
$374M
Company's own measure: Non-GAAP net income, Q2 FY2027
$559M
Microchip said in its Nov 5, 2026 release that its non-GAAPThe company's own "adjusted" numbers, not the official (GAAP) ones. Always read them next to the official figure. Learn more tax line uses cash taxes for the year, not the GAAP tax charge.
Official (GAAP): GAAP operating income, Q2 FY2027
$465M
Company's own measure: Non-GAAP operating income, Q2 FY2027
$640M
The gap is mostly $90.2 million of amortization of acquired intangibles plus stock-based pay and special charges.
Official (GAAP): GAAP gross margin, Q2 FY2027
65.9%
Company's own measure: Non-GAAP gross margin, Q2 FY2027
66.5%
Gross margin is gross profit as a share of net sales.
These are the company's own measures, defined by the company. They are not comparable across companies, and they are not added together. Each sits beside the nearest official (GAAP) figure.
Learn: Non-GAAP measures: what a company's "adjusted" numbers leave out · Stock-based compensation and dilution: pay that becomes shares
Sources (1)
19Financial strength and debt
19Financial strength · Sep 30, 2026
How much debt does Microchip have?
- Total debt$5.5B
- Cash and investments$457M
- Net debt (debt minus cash)$5.1B
- Net worth (shareholders' money)$6.6B
- Debt to equity
- 0.83×
- $ of debt for every $1 of shareholders' money
- Net debt is a Cityfort calculation from the Q2 FY2027 10-Q: $5,517.2 million of debt at book value minus $457.0 million of cash and short-term investments.
- Before discounts and costs, debt was $5,551.9 million. That is $3,000 million of senior notes due 2028 to 2030, $364.0 million of commercial paper (short-term IOUs) and $2,187.9 million of convertible notes.
- The Q2 FY2027 10-Q says all of this debt carries fixed rates. Nothing was drawn on the $2.25 billion bank credit line.
- Principal due by fiscal year, per the FY2026 10-K: $386.9 million in FY2027, $1,000 million each in FY2028 and FY2029, $1,900 million in FY2030 and $1,250 million in FY2031.
- Microchip also has 1,485,000 shares of 7.50% Series A preferred stock at $1,000 each. They convert into common stock on Mar 15, 2028, and their dividend is $27.8 million a quarter.
20Who owns it
20Who owns it · ownership as of Jun 22, 2026
Who owns Microchip?
- Officers and directors (as a group), shares
- 1.8%
Share classes
Holders of 5% or more
From the company's proxy statement (DEF 14A), later Schedule 13G filings and the share counts on its latest annual or quarterly report. Each holder row shows the date of its own filing.
Learn: How to read a proxy statement (DEF 14A): Nvidia's 2026 proxy · Form 4 insider filings: who files, the codes and the footnotes
21What it does with profit
21What it does with profit
What does Microchip do with its profit?
Dividend per share
$1.82FY2026
Dividend paid for each share, by financial year.
$ per share
See the numbers
Buyback · Mar 31, 2022
Bought back $425.6 million of shares in FY2022.
$426M
Buyback · Mar 31, 2023
Bought back $945.8 million of shares in FY2023.
$946M
Buyback · Mar 31, 2024
Bought back $982.1 million of shares in FY2024.
$982M
Buyback · Mar 31, 2025
Bought back $96.5 million of shares in FY2025, and none in FY2026.
$96.5M
Money raised · Dec 16, 2024
Sold $1,000 million of 4.900% notes due 2028 and $1,000 million of 5.050% notes due 2030.
$2.0B
Money raised · Mar 25, 2025
Sold 7.50% Series A mandatory convertible preferred stock, raising $1,449.5 million.
$1.4B
Money raised · Feb 11, 2026
Sold $900 million of 0.000% convertible notes due 2030, including a $100 million option the buyers exercised.
$900M
Sources (8)
- Form 10-K for FY2024
- Form 10-K for FY2026
- Form 10-K for FY2022
- Form 10-K for FY2023
- 8-K filed Dec 16, 2024: 4.900% notes due 2028 and 5.050% notes due 2030
- 8-K filed Mar 25, 2025: 7.50% Series A mandatory convertible preferred stock
- 8-K filed Feb 11, 2026: 0.000% convertible senior notes due 2030
- Form 10-Q for Q2 FY2027
22Governance signals
22Governance signals
What do Microchip's governance filings show?
- Auditor
- Ernst & Young LLP, since 2001
- Auditor changes
- None in the period covered
- Audit qualifications
- None reported
- Related-party dealings
- The 2026 proxy statement says Microchip had no related-party transactions in FY2026 within the meaning of SEC rules. It also says company policy bars directors and officers from hedging Microchip shares or using them as loan collateral.
- Credit rating
- No public credit rating found in a search of rating agency sites on Nov 20, 2026
Flags to know about
disclosure
Credit rating cut, agency not named
The FY2026 10-K says Microchip kept its investment grade rating but was downgraded by one rating agency in March 2025. The 10-K does not name the agency or the new rating.
other
Low support for executive pay
At the Aug 19, 2025 annual meeting, 45.65% of votes cast supported executive pay (say-on-pay). The 2026 proxy says Microchip then contacted its top 32 holders, about 60% of shares, and met 11 of them.
other
Malaysia tax dispute
Malaysia's tax authority assessed extra income for fiscal 2020. If upheld, taxes and penalties could reach MYR 1.9 billion ($473.2 million at Sep 30, 2026 rates). Payment is stayed while an appeal is heard.
other
Board change
Director Victor Peng stepped down from the board on Nov 3, 2026, effective that day, citing his time commitments, including as CEO of PsiQuantum.
23How it got here
23How it got here
How did Microchip get here?
1989
Milestone
Incorporated in Delaware
Microchip Technology Incorporated was incorporated in 1989 and is based in Chandler, Arizona.
1991
Milestone
Steve Sanghi becomes CEO
Sanghi ran the company as CEO from Oct 1991 to Mar 2021 and has been chair since Oct 1993.
2002
Milestone
First quarterly dividend
The board started a quarterly cash dividend in October 2002; payments reached about $9.11 billion by Sep 2026.
2023
Milestone
Highest net sales of FY2022-FY2026
Net sales reached $8,438.7 million in FY2023 and net income $2,237.7 million.
2024
Crisis
Sales slump and CEO change
CEO Ganesh Moorthy retired and Sanghi returned as interim CEO on Nov 18, 2024. FY2025 net sales fell 42.3% to $4,401.6 million.
2024
Crisis
Fab 2 closure
In December 2024 Microchip decided to close its Tempe, Arizona wafer factory, citing high inventory and spare capacity elsewhere. It closed in May 2025.
2025
Business-model change
Preferred stock and job cuts
In March 2025 Microchip raised $1,449.5 million from 7.50% mandatory convertible preferred stock and cut jobs at its Oregon, Colorado and Philippines plants.
2025
Milestone
Sanghi made permanent CEO
The board made Sanghi permanent CEO on Jul 2, 2025.
2026
Milestone
Sales recovery and two acquisitions
Net sales reached $1,621.5 million in the Sep 2026 quarter, up 42.2% from a year earlier. Microchip bought Hailo in September and Vorago Technologies in October 2026.
Sources (8)
- Form 10-K for FY2026
- Form 10-Q for Q2 FY2027
- Form 10-K for FY2023
- 2026 proxy statement (DEF 14A)
- 8-K filed Dec 2, 2024: closure of Fab 2 (Tempe, Arizona)
- 8-K filed Mar 25, 2025: 7.50% Series A mandatory convertible preferred stock
- 8-K filed Mar 3, 2025: Fab 2 timing and headcount reductions
- Q2 FY2027 earnings release (8-K Ex. 99.1)
24Sources and changes
Where every number on this page comes from
Sources (28 documents)
- S1Form 10-Q for Q2 FY2027 · SEC EDGAR · Tier 1: company or exchange filing · Nov 5, 2026
- S2Form 10-Q for Q1 FY2027 · SEC EDGAR · Tier 1: company or exchange filing · Aug 6, 2026
- S3Form 10-K for FY2026 · SEC EDGAR · Tier 1: company or exchange filing · May 21, 2026
- S4Form 10-Q for Q3 FY2026 · SEC EDGAR · Tier 1: company or exchange filing · Feb 5, 2026
- S5Form 10-Q for Q2 FY2026 · SEC EDGAR · Tier 1: company or exchange filing · Nov 6, 2025
- S6Form 10-Q for Q1 FY2026 · SEC EDGAR · Tier 1: company or exchange filing · Aug 7, 2025
- S7Form 10-K for FY2025 · SEC EDGAR · Tier 1: company or exchange filing · May 23, 2025
- S8Form 10-Q for Q3 FY2025 · SEC EDGAR · Tier 1: company or exchange filing · Feb 6, 2025
- S9Form 10-Q for Q2 FY2025 · SEC EDGAR · Tier 1: company or exchange filing · Nov 5, 2024
- S10Form 10-Q for Q1 FY2025 · SEC EDGAR · Tier 1: company or exchange filing · Aug 1, 2024
- S11Form 10-K for FY2024 · SEC EDGAR · Tier 1: company or exchange filing · May 23, 2024
- S12Form 10-Q for Q3 FY2024 · SEC EDGAR · Tier 1: company or exchange filing · Feb 1, 2024
- S13Form 10-K for FY2023 · SEC EDGAR · Tier 1: company or exchange filing · May 25, 2023
- S14Form 10-K for FY2022 · SEC EDGAR · Tier 1: company or exchange filing · May 20, 2022
- S15Q2 FY2027 earnings release (8-K Ex. 99.1) · SEC EDGAR · Tier 1: company or exchange filing · Nov 5, 2026
- S16Q1 FY2027 earnings release (8-K Ex. 99.1) · SEC EDGAR · Tier 1: company or exchange filing · Aug 6, 2026
- S17Q4 FY2026 earnings release (8-K Ex. 99.1) · SEC EDGAR · Tier 1: company or exchange filing · May 7, 2026
- S18Q3 FY2026 earnings release (8-K Ex. 99.1) · SEC EDGAR · Tier 1: company or exchange filing · Feb 5, 2026
- S19Q2 FY2026 earnings release (8-K Ex. 99.1) · SEC EDGAR · Tier 1: company or exchange filing · Nov 6, 2025
- S20Q1 FY2026 earnings release (8-K Ex. 99.1) · SEC EDGAR · Tier 1: company or exchange filing · Aug 7, 2025
- S21Q4 FY2025 earnings release (8-K Ex. 99.1) · SEC EDGAR · Tier 1: company or exchange filing · May 8, 2025
- S222026 proxy statement (DEF 14A) · SEC EDGAR · Tier 1: company or exchange filing · Jul 6, 2026
- S238-K filed Feb 11, 2026: 0.000% convertible senior notes due 2030 · SEC EDGAR · Tier 1: company or exchange filing · Feb 11, 2026
- S248-K filed Mar 25, 2025: 7.50% Series A mandatory convertible preferred stock · SEC EDGAR · Tier 1: company or exchange filing · Mar 25, 2025
- S258-K filed Dec 2, 2024: closure of Fab 2 (Tempe, Arizona) · SEC EDGAR · Tier 1: company or exchange filing · Dec 2, 2024
- S268-K filed Mar 3, 2025: Fab 2 timing and headcount reductions · SEC EDGAR · Tier 1: company or exchange filing · Mar 3, 2025
- S278-K filed Dec 16, 2024: 4.900% notes due 2028 and 5.050% notes due 2030 · SEC EDGAR · Tier 1: company or exchange filing · Dec 16, 2024
- S28Microchip press release, Nov 15, 2021: investment grade ratings from Moody's and Fitch · Microchip Technology Incorporated (investor relations) · Tier 2: rating agency or regulator · Nov 15, 2021
Changes to this page (v1 · Nov 20, 2026)
- v1 · Nov 20, 2026First version. (first version)
Numbers come only from tier 1 and tier 2 sources. Read how we research.
Disclaimer
For learning only. Cityfort is not a registered investment adviser or broker-dealer and does not recommend buying or selling any security. Prices shown are dated and may be out of date.
Investing in securities involves risk, including loss of capital. Before making any investment decision, do your own research and consider consulting a registered investment adviser or other qualified professional.
Cityfort, its owners and contributors may or may not hold securities of companies covered. Cityfort is not paid by any company it covers. Content is not an offer or solicitation to buy or sell any security, including in any initial public offering.
Read the positions policyRead the full disclaimerHide the full disclaimer
Cityfort publishes general educational content that explains how listed companies work. Cityfort is not registered with the US Securities and Exchange Commission or any state securities regulator as an investment adviser, and is not a broker-dealer or a member of FINRA. Cityfort does not provide investment, tax or legal advice, recommendations, ratings, price targets or any opinion on whether to buy, sell or hold any security. Nothing on the site is tailored to any person's circumstances.
All information is taken from publicly available sources, mainly company filings with the SEC, which are listed on each page with dates. We work to keep it accurate and correct errors publicly, but we do not guarantee that it is complete, accurate or up to date. Any market price or price-based ratio shown is dated, may be out of date by the time you read it, and is included only to explain concepts.
Statements by company management, including forward-looking statements and guidance, are reported as the company's statements, with their date and source; they are not our forecasts. Adjusted (non-GAAP) figures are the company's own measures and are shown next to the official (GAAP) figures.