Technology · NYSE: GLW
Corning: how the business works
Corning makes the glass, optical fiber and ceramics inside networks, phone and TV screens and car exhausts, with $15.6 billion of FY2025 net sales.
By Hardik Bhandare · Checked against filings: . Editorial policy. Corrections
Follow Corning
Email me when Corning's page is updated after earnings.
We'll send a confirmation email first. See our privacy policy.
Corning Incorporated · Corning, New York · Founded 1851
Updated for Q3 FY2026 · checked
- Net sales, FY2025
- $15.6B
- Net income to Corning, FY2025
- $1.6B
- Net sales, Q3 FY2026
- $4,855M
- Employees, end of 2025
- About 67,200
- Business began
- 1851
The short version
Corning in 5 points
1 · What it sells
Corning sells specialty glass, ceramics and optical fiber that other companies build into networks, data centers, phone and TV screens and car exhaust systems, with net sales of $15,629 million in FY2025.
2 · Who pays it
In FY2025, telecom carriers and data-center operators paid 38% of Corning's segment sales, display panel makers 23%, phone, tablet and chip-equipment makers 13%, emission-control and car makers 11%, solar, chip and drug makers 9% and labs 6%.
3 · What it keeps from $100
Of every $100 that came in during FY2025, Corning kept $10.09 as net income, which includes a $150 million currency-contract gain, while operating income was $14.41 per $100 (Cityfort calculation from the FY2025 10-K).
4 · Where the operating profit comes from
Under its 2026 segments, Glass Innovations earned $1,360 million of FY2025 segment net income and Optical Communications $1,048 million, ahead of Automotive at $278 million and Solar at $89 million, while Life Sciences and Emerging Growth lost $54 million.
5 · The one thing to watch
Optical Communications sales reached $2,379 million in Q3 FY2026, up 44%, while Corning's FY2025 10-K says 2 end customers bought 28% of that segment's 2025 sales.
Sources: From Corning's FY2025 10-K, the Q3 FY2026 10-Q and earnings release, and the Apr 28, 2026 segment recast 8-K · checked
01Where the money goes · FY2025
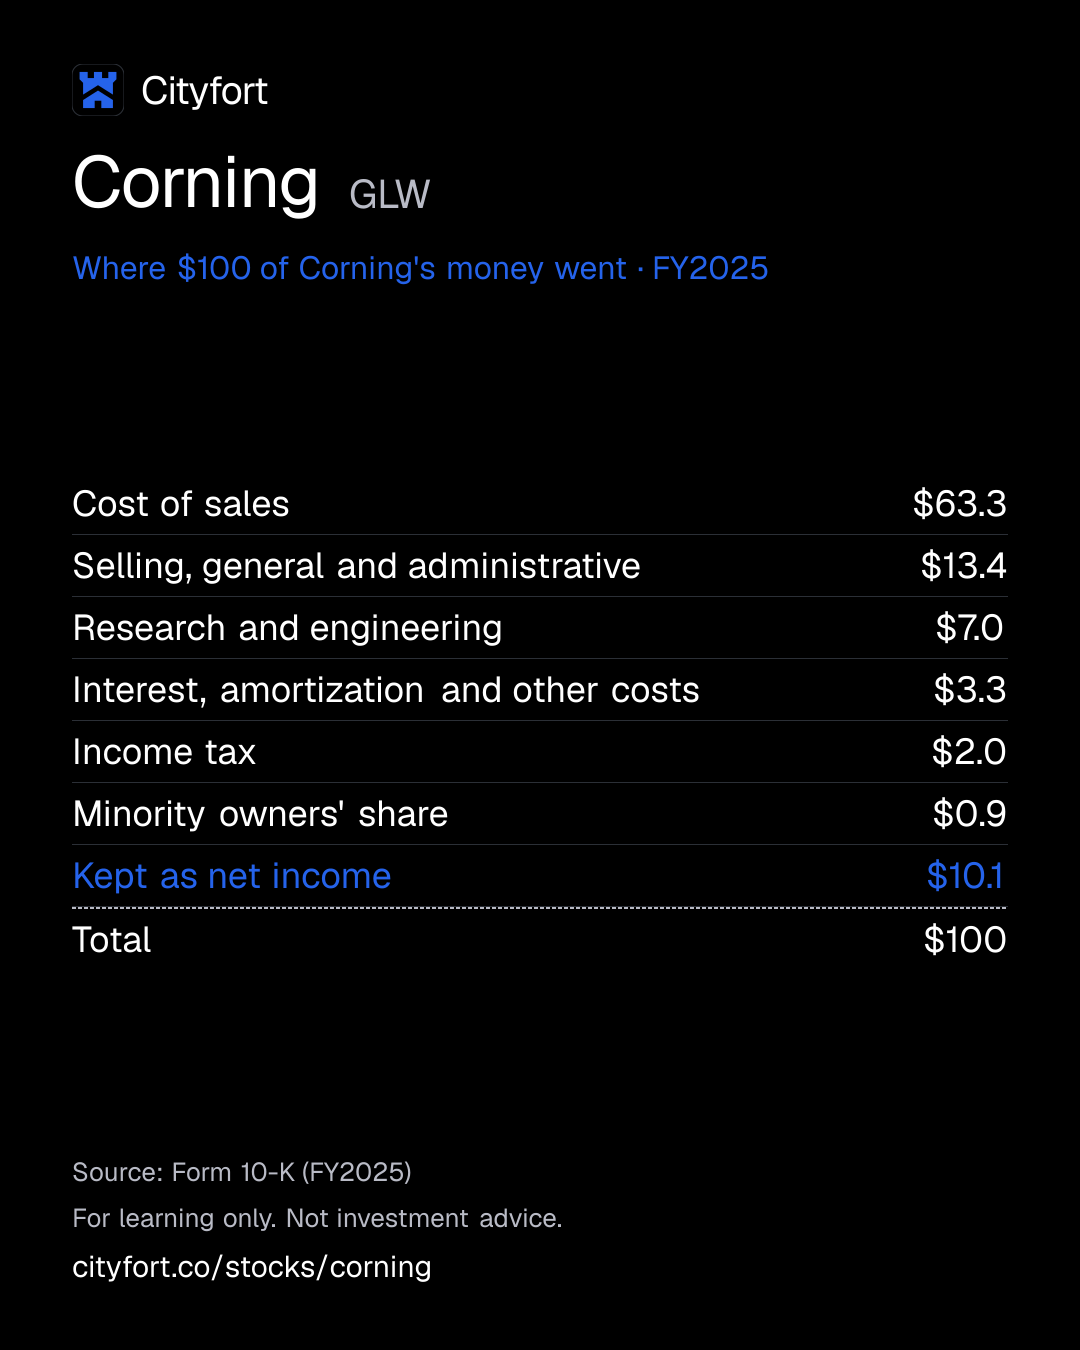
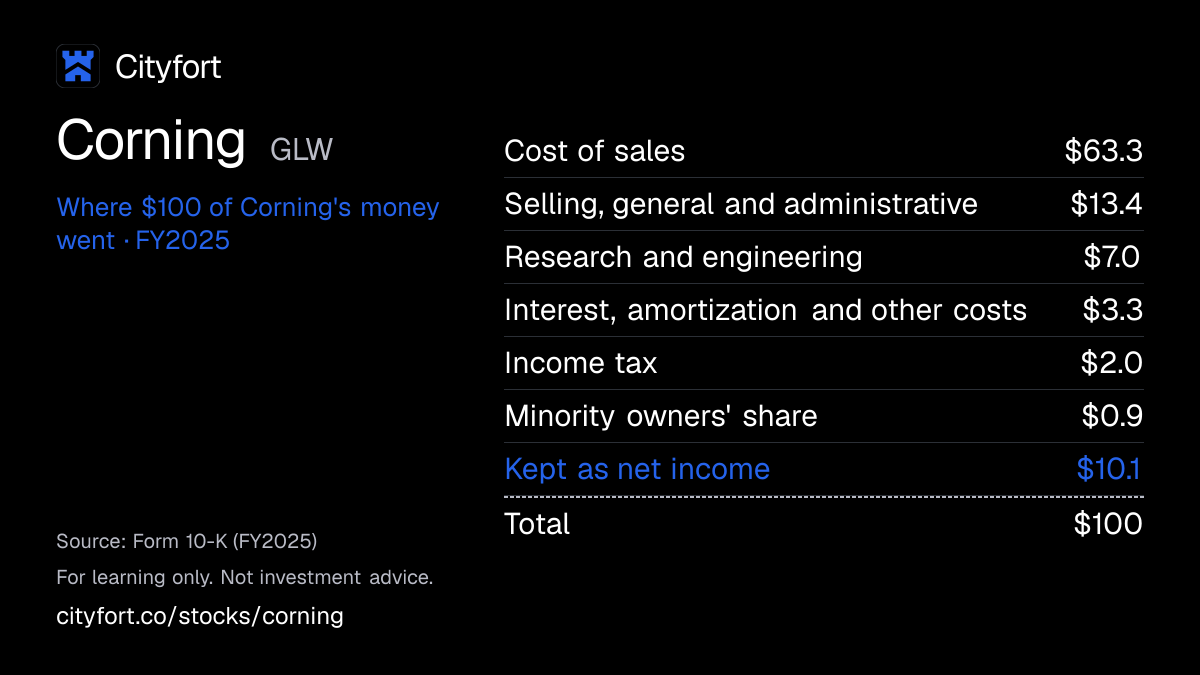
Where does $100 of Corning's money go?
Corning · FY2025
Receipt for every $100
| Cost of sales | $63.3 |
|---|---|
| Selling, general and administrative | $13.4 |
| Research and engineering | $7.0 |
| Interest, amortization and other costs | $3.3 |
| Income tax | $2.0 |
| Minority owners' share | $0.9 |
| Kept as net income | $10.1 |
| Total | $100 |
Each line = amount ÷ total money in × 100. Lines may not add to exactly $100 because of rounding.
How this is worked out
Cityfort calculation from the FY2025 10-K. Of every $100 that came in during FY2025: each line = line ÷ $15,817 million × 100 (net sales $15,629 million + interest income $38 million + currency-contract gain $150 million). Operating income was $2,279 million, or $14.41 of each $100.
Save this receipt as an image
Embed this receipt or the key numbers
Paste this code into a blog or website to show the card you choose, with a link back to this page.
Each week: the next company due to report earnings, explained in 5 points.
No tips. Unsubscribe anytime.
We'll send a confirmation email. See our privacy policy.
02The business in one line
What does Corning do?
Network builders, screen makers, phone makers and car-part makers pay Corning for specialty glass, fiber and ceramics. Most of the money goes on making them: $10.09 of every $100 that came in during FY2025 was left as net income.
- Optical Communications was 38.2% of FY2025 segment sales and Glass Innovations 36%, under the segments Corning adopted in 2026.
- Cost of sales took $63.27 of every $100 that came in during FY2025, and research $7.02 (Cityfort calculation from the FY2025 10-K).
03Who pays it
Who pays Corning?
Telecom carriers and data-center operators
38%
of revenue
Buy fiber, cable and connectors (Optical Communications). Corning's 2026 releases cite multiyear deals with Meta and Amazon and a partnership with NVIDIA.
Display panel makers
23%
of revenue
Buy glass sheets for TV, laptop and monitor screens (the Display segment until 2025).
Phone, tablet and chip-equipment makers
13%
of revenue
Buy Gorilla Glass and precision optics (Specialty Materials until 2025). Corning worked with Apple on the back glass of the iPhone 15.
Emission-control and car makers
11%
of revenue
Buy ceramic exhaust filters and car glass. Most filters are sold to emission-system makers, which sell to car and engine makers.
Solar and chip makers, and drugmakers
9%
of revenue
Buy polysilicon, solar wafers and modules, and glass tubing and vials (Hemlock and Emerging Growth businesses).
Labs and drugmakers, mostly through distributors
6%
of revenue
Buy lab plastics, cell-culture products and glassware (Life Sciences).
- Telecom carriers and data-center operators38%
- Display panel makers23%
- Phone, tablet and chip-equipment makers13%
- Emission-control and car makers11%
- Solar and chip makers, and drugmakers9%
- Labs and drugmakers, mostly through distributors6%
How spread out the customers are
Shares above are of FY2025 segment sales under the structure Corning used until 2025. Corning names no single customer above 10% of sales, but its FY2025 10-K says a few end customers buy much of each segment's sales: 3 bought 59% of Display sales, 3 bought 61% of Automotive sales and 2 bought 28% of Optical Communications sales.
04How it makes money
How does Corning make money?
Large, costly factories: when they run fuller, profit grows faster than sales.
Corning's plants cost a lot to run whether they are busy or not; depreciation alone was $1,237 million in FY2025. When FY2025 net sales rose 19%, operating income doubled from $1,135 million to $2,279 million.
Operating income per $100 of net sales
$7.1$14.6
FY2023 to FY2025
- Corning invents a new glass, fiber or ceramic and patents it
- It builds large plants to make it at scale
- Customers sign up, often on multiyear deals
- Higher volume spreads the fixed plant costs
- More of each extra dollar of sales becomes profit
- Profit pays for research and the next plants
↺ Step 6 feeds back into step 1.
Sources (1)
05Business segments · FY2025
Which businesses make up Corning?
Optical Communications
38.2%Fiber, cable and connectors for networks and data centers. Segment net income was $1,048 million.
Revenue $6.3B ($6,274M)
Glass Innovations
36%Display glass, Gorilla Glass and precision optics (the former Display and Specialty Materials segments). Segment net income was $1,360 million.
Revenue $5.9B ($5,908M)
Automotive
10.9%Ceramic exhaust filters and car glass. Segment net income was $278 million.
Revenue $1.8B ($1,794M)
Solar
7.5%Polysilicon, solar wafers and modules. Segment net income was $89 million.
Revenue $1.2B ($1,231M)
Life Sciences and Emerging Growth
7.3%Lab products, medicine glass tubing and new businesses. Segment net loss was $54 million.
Revenue $1.2B ($1,201M)
How the mix changed
- Optical Communications
- Glass Innovations
- Automotive
- Solar
- Life Sciences and Emerging Growth
Revenue by segment, FY2024 to FY2025.
US$
See the numbers
06The numbers · Consolidated · US$
How has Corning done?
Revenue
$15.6BFY2025
Net sales fell from $14,189M in FY2022 to $12,588M in FY2023, then rose to $15,629M in FY2025, and Q3 FY2026 sales of $4,855M were 18% above Q3 FY2025.
US$
See the numbers
Net income
$1.6BFY2025
Net income to Corning fell from $1,906M in FY2021 to $506M in FY2024, then rose to $1,596M in FY2025.
US$
See the numbers
Net income for every $100 of revenue
$10.2FY2025
Corning kept $10.2 of net income per $100 of sales in FY2025, up from $3.9 in FY2024 and below $13.5 in FY2021.
Net margin: $ of net income per $100 of revenue
See the numbers
Free cash flow
$1.4BFY2025
In FY2025, operating cash flow of $2,695M minus capital spending of $1,282M left free cash flow of $1,413M; quarterly EBITDA is operating income plus depreciation and amortization from each quarter's earnings release.
US$ · cash from operations minus spending on plants and equipment
See the numbers
See all yearly numbers
EBITDA here = operating income plus depreciation and amortization (from the cash flow statement). Fiscal years are the company's own: Fiscal year ends Dec 31 (the calendar year). Net income is the share belonging to the company's owners. Total net income differs from net profit to the company's owners: Total net income includes the share of profit that belongs to minority owners of Corning subsidiaries; net income to Corning leaves it out.
Learn: Fiscal years that don't end in December: Nvidia's FY2027 explained · Stock-based compensation and dilution: pay that becomes shares
Sources (20)
- Form 10-K for FY2021
- Form 10-K for FY2022
- Form 10-K for FY2024
- Form 10-K for FY2023
- Form 10-K for FY2025
- Form 10-Q for Q1 FY2024
- Q1 FY2025 earnings release (8-K Ex. 99.1)
- Form 10-Q for Q2 FY2024
- Q2 FY2025 earnings release (8-K Ex. 99.1)
- Form 10-Q for Q3 FY2024
- Form 10-Q for Q3 FY2025
- Q4 FY2025 earnings release (8-K Ex. 99.1)
- Form 10-Q for Q1 FY2025
- Form 10-Q for Q2 FY2025
- Q3 FY2026 earnings release (8-K Ex. 99.1)
- Form 10-Q for Q1 FY2026
- Q1 FY2026 earnings release (8-K Ex. 99.1)
- Form 10-Q for Q2 FY2026
- Q2 FY2026 earnings release (8-K Ex. 99.1)
- Form 10-Q for Q3 FY2026
07Who runs it
Who runs Corning, and did they deliver?
Wendell P. Weeks
Chairman, Chief Executive Officer and President · since 2005
Joined Corning in 1983; CEO since 2005 and Chairman since 2007.
Edward A. Schlesinger
Executive Vice President and Chief Financial Officer
Joined Corning in 2013 as finance chief of its optical business.
Avery H. Nelson III
Executive Vice President and Chief Operating Officer
Joined Corning in 1991 as a shift supervisor at a plant in Kentucky.
Lewis A. Steverson
Vice Chairman, Executive Vice President and Chief Legal & Administrative Officer
Joined Corning in 2013 as general counsel.
John Z. Zhang
Senior Executive Vice President and Chief Corporate Development Officer
Joined Corning in 2008.
Michael P. O'Day
Senior Vice President and General Manager, Optical Communications
Joined Corning in 1998.
What they said, and what happened
4 delivered · 2 too early to tell
Said on Jan 28, 2026
Q1 FY2026 core sales of $4.2 billion to $4.3 billion and core EPS of $0.66 to $0.70.
DeliveredWhat happened
Reported core sales of $4,345 million and core EPS of $0.70.
Said on Apr 28, 2026
Q2 FY2026 core sales of about $4.6 billion and core EPS of $0.73 to $0.77.
DeliveredWhat happened
Reported core sales of $4,738 million and core EPS of $0.78.
Said on Jul 28, 2026
Q3 FY2026 core sales of $4.9 billion to $5.0 billion and core EPS of $0.85 to $0.89.
DeliveredWhat happened
Reported core sales of $5,081 million and core EPS of $0.91.
Said on Feb 12, 2026
A core operating margin of 20% by the end of 2026 under the Springboard plan.
DeliveredWhat happened
Corning said it reached the target in Q4 2025, with a core operating margin of 20.2%.
Said on Feb 12, 2026
Capital spending of about $1.7 billion in 2026.
Too early to tellWhat happened
Capital spending was $1,299 million in the first nine months of 2026.
Said on Oct 27, 2026
Q4 FY2026 core sales of about $5.2 billion to $5.3 billion and core EPS of $0.96 to $1.00.
Too early to tellWhat happened
Not yet reported.
08What could go wrong
What could go wrong for Corning?
- Concentration
A few customers buy much of each segment's sales
In 2025, 3 end customers bought 59% of Display sales and 3 bought 61% of Automotive sales. Losing one, or a merger between two, could cut sales sharply.
Watch Customer counts and shares in the next 10-K risk factors.
- Demand
Profit leans on data-center and network spending
Corning's 10-K says Optical Communications and Display produce much of its profit and cash flow. Optical demand depends on how much telecom and hyperscale data-center companies spend.
Watch Optical Communications segment sales and net income each quarter.
- Currency
The Japanese yen and other currencies
57% of FY2025 net sales came from outside the US. Display glass is exposed to the yen, and Corning hedges its yen, yuan, won, euro and other exposures.
Watch The gap between core and GAAP sales, and hedge gains or losses.
- Execution
Solar is a new business that relies on tax incentives
Corning's 10-K says its solar business depends on government manufacturing tax incentives and policy. The Solar segment lost $7 million in each of Q2 and Q3 FY2026.
Watch Solar segment net income and any change to US manufacturing incentives.
- Raw-material prices
Sole-source materials and equipment
Some key materials and equipment come from a single supplier or a few, and some raw materials face export limits in their home country.
Watch Gross margin and any supply disruption named in filings.
- Execution
Big spending on new plants
In its FY2025 10-K (Feb 12, 2026), Corning said it expected about $1.7 billion of capital spending in 2026, up from $1,282 million in FY2025. On May 6, 2026 it announced three new US plants under the NVIDIA partnership.
Watch Capital spending against free cash flowCash from operations minus spending on buildings and equipment. Learn more in the FY2026 10-K.
- Other
New shares could be issued
NVIDIA holds warrants for up to 18 million new shares, and Corning can sell up to $2 billion of new shares under its Sep 2026 program. New shares would spread profit over more shares.
Watch Share count on each 10-Q cover and sales under the program.
09Supporters vs. critics
What do supporters and critics point to?
What supporters point to
- Corning's operating income doubled from $1,135 million in FY2024 to $2,279 million in FY2025, while net sales rose 19%.
- Optical Communications sales rose 44% to $2,379 million in Q3 FY2026, and its segment net income rose 80% to $532 million.
- Corning's Apr 28, 2026 release cites a multiyear deal with Meta of up to $6 billion, and its Jul 28, 2026 release a multiyear, multibillion-dollar deal with Amazon.
- Free cash flow was $1,413 million in FY2025, up from $974 million in FY2024 (Cityfort calculation from the FY2025 10-K: operating cash flow minus capital spending).
- Corning paid a dividend of $1.12 a share in each of FY2023, FY2024 and FY2025.
What critics point to
- A few end customers buy much of each segment's sales: in 2025, 3 bought 59% of Display sales and 3 bought 61% of Automotive sales.
- Net income to Corning was $1,596 million in FY2025, still below the $1,906 million of FY2021.
- The Solar segment lost $7 million in each of Q2 and Q3 FY2026, and Corning's 10-K says the solar business depends on government manufacturing tax incentives.
- Net debt was $5,663 million on Sep 30, 2026 (Cityfort calculation from the Q3 FY2026 10-Q: total debt of $8,200 million minus cash of $2,537 million).
- NVIDIA holds warrants for up to 18 million new shares, and Corning can sell up to $2 billion of new shares under its Sep 2026 program.
10What to watch next
What should you watch next at Corning?
Next event
Q4 FY2026 results
Date not announced yet.
Optical Communications sales and profit
Segment sales were $2,379 million in Q3 FY2026, up 44%, and segment net income $532 million. Corning's FY2025 10-K says Optical demand depends on telecom and hyperscale data-center spending.
Whether Solar turns a profit
The Solar segment had Q3 FY2026 sales of $436 million, up 37%, but lost $7 million in each of Q2 and Q3 FY2026.
Capital spending against cash flow
In its FY2025 10-K (Feb 12, 2026), Corning said it expected about $1.7 billion of capital spending in 2026, up from $1,282 million in FY2025. FY2025 operating cash flow was $2,695 million.
Share count
Shares outstanding rose from 857,757,208 on Dec 31, 2025 to 861,401,106 on Oct 23, 2026. NVIDIA's warrants and the $2 billion share-sale program could add more.
11Key dates
What are the key dates for Corning?
| Event | Date | Source |
|---|---|---|
| Quarterly dividend of $0.28 a share paidDeclared on Oct 6, 2026. | Form 10-Q for Q3 FY2026 | |
| Samsung Display share repurchase agreement window ends22 million shares can be offered to Corning in tranches through calendar 2027. | Not yet stated | Form 10-Q for Q3 FY2026 |
| $1.5 billion revolving credit agreement expiresUndrawn on Dec 31, 2025. | Form 10-K for FY2025 |
12Key facts
Key facts about Corning
- What does Corning do?
- Corning Incorporated makes specialty glass, ceramics and optical fiber that other companies build into their products. Its fiber carries internet data, its glass covers phone screens and forms TV panels, and its ceramics clean car exhaust.
- How does Corning make money?
- Corning sells materials and parts to other businesses. In FY2025, Optical Communications was 38.2% of Corning's segment sales, Glass Innovations 36%, Automotive 10.9%, Solar 7.5% and Life Sciences and Emerging Growth 7.3%, under the segments it adopted in 2026.
- Who are Corning's customers?
- Corning's customers are telecom carriers, data-center operators, display panel makers, phone makers, emission-system makers and labs. Corning names no customer above 10% of its sales, but its FY2025 10-K says 3 end customers bought 59% of Display sales and 3 bought 61% of Automotive sales in 2025.
- How big is Corning?
- Corning had net sales of $15,629 million in FY2025, up from $13,118 million in FY2024. Net income to Corning was $1,596 million, up from $506 million. It had about 67,200 employees in 44 countries.
- Where does Corning sell?
- In FY2025, customers in the United States accounted for 41.2% of Corning's segment sales (at Corning's fixed exchange rates), China 30.3%, Europe 8.6% and Taiwan 6.3% (Cityfort calculation from the FY2025 10-K).
- How much debt does Corning have?
- On Sep 30, 2026, Corning had total debt of $8,200 million, as stated in its Q3 FY2026 10-Q, and cash of $2,537 million. Corning shareholders' equity was $13,671 million.
- Does Corning pay a dividend?
- Corning paid a dividend of $1.12 a share in each of FY2023, FY2024 and FY2025. In 2026 it declared four quarterly dividends of $0.28 a share.
- Who owns Corning?
- Corning has one class of common stock, with 861.4 million shares on Oct 23, 2026. Its 2026 proxy statementThe yearly filing about shareholder votes, the board and executive pay. Learn more lists The Vanguard Group at 11.45% (holdings at Dec 31, 2023) and Samsung Display at 7.93% (holdings at Aug 20, 2025). Directors and executive officers held 0.25% (Cityfort calculation from the 2026 proxy statement).
Terms on this page
- Capital expenditures (capex)
- Debt-to-equity
- Earnings per share (EPS)
- EBITDA
- Free cash flow
- Net debt
- Net margin
- Revenue vs net income
- Stock buyback
Each explains the term in plain English, with the same number from other companies on Cityfort.
Go deeper
More detail from the same filings. Open any section.
13What it sells
13What it sells
What does Corning sell?
Optical fiber, cable and connectivity
Glass fiber, cable and connectors for phone and internet networks and for the data centers that run AI. Corning invented the first low-loss optical fiber in 1970.
Display glass (Glass Innovations)
Thin glass sheets that panel makers turn into TV, laptop and monitor screens, made in China, South Korea and Taiwan.
Gorilla Glass and semiconductor optics (Glass Innovations)
Tough cover glass for phones, tablets and watches, plus ultra-pure glass used in chip-making equipment.
Automotive
Ceramic parts that clean exhaust gas in gasoline and diesel engines, and glass for car dashboards and windows.
Solar
Polysilicon from Hemlock Semiconductor Group, a raw material for solar panels and chips, plus solar wafers and modules made from it.
Life Sciences and other businesses
Lab plastics and glassware sold under the Corning, Falcon, PYREX and Axygen brands, plus glass tubing and vials for medicines.
What it does
- Does: Makes the glass, ceramic and fiber parts that other manufacturers build into their products
- Does: Sells mostly to businesses: network builders, panel makers, phone makers, car-part makers and labs
- Does: Runs factories in 14 countries
What it does not do
- Does not: Does not make phones, TVs, cars or servers
- Does not: Does not run telecom networks or data centers
- Does not: Does not name any customer that buys more than 10% of its sales
14How the money flows
14How the money flows · FY2025
How does money flow through Corning?
Money in
- Net sales$15.6B
- Interest income ($38M) and a currency-contract gain ($150M)$188M
The company
Corning
$15.8B came in
Money out
- Cost of sales$10.0B
- Selling, general and administrative$2.1B
- Research, development and engineering$1.1B
- Interest expense ($336M), other expense ($79M) and amortization ($110M)$525M
- Income tax$310M
- Minority owners' share of subsidiaries' profit$146M
- Net income to Corning$1.6B
- Customers paid Corning $15.6 billion of net sales in FY2025.
- Making the products cost $10.0 billion, leaving a gross margin of $5.6 billion.
- Selling and administration took $2.1 billion and research $1.1 billion. Operating income was $2,279 million.
- Interest income and a currency-contract gain added $188 million; interest, other costs and tax took $725 million.
- After $146 million for minority owners of subsidiaries, $1,596 million was left for Corning.
Sources (1)
15What it needs to run
15What it needs to run
What does Corning need to run?
Power, water and raw materials
Its plants need steady power, large amounts of industrial water, precious metals and minerals such as lithium and helium. Some key materials and equipment come from a single supplier.
Factories and equipment
Plant, property and equipment was worth $14.8 billion on Dec 31, 2025. In its FY2025 10-K (Feb 12, 2026), Corning said it expected 2026 capital spending of about $1.7 billion.
Research and patents
Research, development and engineering cost $1,110 million in FY2025. Patents and trade secrets, such as its fusion process for display glass, protect its products.
People
About 67,200 employees in 44 countries, 68% of them in production and maintenance roles.
Sources (1)
16Where it sells
16Where it sells · FY2025
Where does Corning sell?
- United States41.2%
- China30.3%
- Europe8.6%
- Taiwan6.3%
- Japan4.2%
- South Korea2.6%
- Other Asia Pacific3.3%
- Canada and Mexico2.1%
- Rest of the world1.5%
Sources (1)
17Competitors and what protects it
17Competitors and what protects it
Who does Corning compete with?
Amphenol
NYSE: APH
Named in Corning's FY2025 10-K as a principal competitor in optical fiber, cable and connectivity.
Prysmian Group
Named in the FY2025 10-K as a principal competitor in optical communications, alongside Fujikura and Sumitomo.
AGC Inc.
A principal competitor in display glass, specialty glass and automotive glass, according to the FY2025 10-K.
Nippon Electric Glass
Named in the FY2025 10-K as a principal competitor in display glass and specialty materials.
NGK Insulators
The FY2025 10-K lists it, with Ibiden, as a principal competitor in ceramic exhaust substrates and filters.
What protects the business
Each strength is scored 1 (weak) to 5 (strong) for the business, with the reason. It is not a rating of the share.
- Process know-how and patents4 of 5
Corning invented the fusion process it uses for display glass and holds patent portfolios in every segment, which its 10-K calls important to each.
- Manufacturing scale4 of 5
It makes products in 14 countries; plant and equipment was $14.8 billion on Dec 31, 2025, and its 10-K says fiber scale gives it cost advantages over several rivals.
- Research spending3 of 5
Research, development and engineering cost $1,110 million in FY2025, about 7% of net sales.
- Long customer contracts3 of 5
Corning's Apr 2026 release cites a multiyear deal with Meta of up to $6 billion, and its Jul 2026 release a multiyear, multibillion-dollar deal with Amazon.
Weak spot
Few large customers
A handful of end customers buy much of each segment's sales. For example, 3 customers bought 59% of Display sales in 2025, which gives them bargaining power.
18Where growth could come from
18Where growth could come from
Where could Corning's growth come from?
On Oct 27, 2026, CFO Edward Schlesinger said Corning expects fourth-quarter 2026 core sales of about $5.2 billion to $5.3 billion, up about 19%, and core EPS of $0.96 to $1.00, up about 36%. Core figures are Corning's own adjusted (non-GAAPThe company's own "adjusted" numbers, not the official (GAAP) ones. Always read them next to the official figure. Learn more) measures. In May 2026, management laid out a plan to double its annualized sales run rate from $20 billion to $40 billion by the end of 2030.
AI data-center fiber (Optical Communications)
WorkingQ3 FY2026 segment sales $2,379M, up 44%
CEO Wendell Weeks said in the Q3 FY2026 release that Gen AI sales in Optical Communications doubled from a year earlier. Segment net income rose 80% to $532 million.
Status: Working, on track against what the company said.
Multiyear hyperscaler deals
NewMeta deal of up to $6 billion
Corning's Apr 28, 2026 release cites a recently announced multiyear deal with Meta of up to $6 billion; its Jul 28 release cites an Amazon multiyear, multibillion-dollar deal. On May 6, 2026 it announced an NVIDIA partnership with three new US plants in North Carolina and Texas.
Status: New, recently announced.
Solar (Hemlock polysilicon, wafers and modules)
MixedQ3 FY2026 sales $436M, up 37%; net loss $7M
Solar sales grew, but the segment lost $7 million in each of Q2 and Q3 FY2026. Management said in Oct 2026 it is building a Solar revenue stream of more than $3 billion.
Status: Mixed, partly on track.
Glass Innovations (display and Gorilla Glass)
MixedQ3 FY2026 sales $1,506M, down 3%
Glass Innovations sales fell 3% in Q3 FY2026, and its segment net income fell 10% to $328 million.
Status: Mixed, partly on track.
Springboard plan
WorkingQ3 FY2026 core sales $5,081M, up 19%
Springboard is the growth plan Corning introduced in Q3 2023. Core sales are Corning's own adjusted measure; GAAP net sales were $4,855 million in Q3 FY2026.
Status: Working, on track against what the company said.
Status compares progress with what the company itself said it would do: Working = on track against what the company said; Mixed = partly on track; Behind = behind the company's own plan; New = recently announced; Early = too early to judge.
19The company's own measures (non-GAAP)
19The company's own measures · FY2025 and Q3 FY2026
What do Corning's own measures show?
Official (GAAP): Net sales, FY2025
$15.6B
Company's own measure: Core sales, FY2025
$16.4B
Converts sales at Corning's fixed internal exchange rates (for example for the Japanese yen) instead of actual rates.
Official (GAAP): Diluted EPS, FY2025
$1.83
Company's own measure: Core EPS, FY2025
$2.52
Uses the same fixed exchange rates and leaves out items such as currency-contract gains, restructuring charges and acquisition costs.
Official (GAAP): Operating cash flow, FY2025
$2.7B
Company's own measure: Adjusted free cash flow, FY2025
$1.7B
Adds $304 million of realized gains on currency contracts to operating cash flow, then subtracts $1,282 million of capital spending. Free cash flow as this page calculates it was $1,413 million.
Official (GAAP): Net sales, Q3 FY2026
$4.9B
Company's own measure: Core sales, Q3 FY2026
$5.1B
From Apr 1, 2026 Corning adjusts for the exchange rates it has hedged at, a measure it calls the adjustment for hedged exposures.
Official (GAAP): Diluted EPS, Q3 FY2026
$0.78
Company's own measure: Core EPS, Q3 FY2026
$0.91
Adds back $0.20 a share for hedged exchange rates and $0.05 for tax items, and removes a $0.12 currency-contract gain.
Official (GAAP): Operating cash flow, Q3 FY2026
$1.1B
Company's own measure: Adjusted free cash flow, Q3 FY2026
$661M
Corning's own measure for the quarter, after capital spending of $545 million.
These are the company's own measures, defined by the company. They are not comparable across companies, and they are not added together. Each sits beside the nearest official (GAAP) figure.
Learn: Non-GAAP measures: what a company's "adjusted" numbers leave out
20Financial strength and debt
20Financial strength · Sep 30, 2026
How much debt does Corning have?
- Total debt$8.2B
- Cash and investments$2.5B
- Net debt (debt minus cash)$5.7B
- Net worth (shareholders' money)$13.7B
- Debt to equity
- 0.6×
- $ of debt for every $1 of shareholders' money
- Net debt of $5,663 million is total debt of $8,200 million, as Corning states it in its Q3 FY2026 10-Q, minus cash of $2,537 million (Cityfort calculation from the Q3 FY2026 10-Q). On Dec 31, 2025 it was $6,908 million: $8,434 million of debt minus $1,526 million of cash (Cityfort calculation from the FY2025 10-K).
- Debt to equity of 0.6 uses Corning shareholders' equity of $13,671 million on Sep 30, 2026; another $617 million of equity belongs to minority owners of subsidiaries.
- Debt due by year, as of Dec 31, 2025: $804 million in 2026, $401 million in 2027 and $6,379 million after 2030. The largest single item is $1,087 million of 5.45% debentures due 2079.
- Debt includes finance leases of $1,232 million on Dec 31, 2025, up from $174 million, after Corning began finance leases for its solar plant in Hemlock, Michigan and for equipment there during 2025.
- Corning has a $1.5 billion revolving credit line, undrawn on Dec 31, 2025, that runs to Jul 28, 2030. Its interest margin depends on Corning's Moody's and S&P ratings.
- Customer deposits were $1.5 billion on Dec 31, 2025; they are not part of total debt. Its global pension plans were 85% funded.
21Who owns it
21Who owns it · ownership as of Dec 31, 2025
Who owns Corning?
- Officers and directors (as a group), shares
- 0.3%
Share classes
Holders of 5% or more
From the company's proxy statement (DEF 14A), later Schedule 13G filings and the share counts on its latest annual or quarterly report. Each holder row shows the date of its own filing.
Learn: How to read a proxy statement (DEF 14A): Nvidia's 2026 proxy · Form 4 insider filings: who files, the codes and the footnotes
22What it does with profit
22What it does with profit
What does Corning do with its profit?
Dividend per share
$1.12FY2025
Dividend paid for each share, by financial year.
$ per share
See the numbers
Buyback · Dec 31, 2024
Shares bought back in FY2024.
$165M
Buyback · Dec 31, 2025
Shares bought back in FY2025.
$163M
Sources (2)
23Governance signals
23Governance signals
What do Corning's governance filings show?
- Auditor
- PricewaterhouseCoopers LLP, since 1944
- Auditor changes
- None in the period covered
- Audit qualifications
- None reported
- Related-party dealings
- The 2026 proxy says no related party transaction occurred in 2025 that required disclosure under Corning's policy or SEC rules.
- Credit rating
- Not checked for this page
Flags to know about
other
CEO is also Chairman
Wendell Weeks has been CEO since 2005 and Chairman since 2007. Every other director is independent, and Stephanie A. Burns is Lead Independent Director.
other
South Korean tax dispute
Corning's South Korean subsidiary is appealing tax assessments for 2014 to 2019. After a final unfavorable ruling for 2010 to 2012, Corning cut its tax receivable by $92 million in Q1 2026. It received a judgment on the remaining matters on Oct 1, 2026, which it intends to appeal; $150 million was on deposit with the South Korean government on Sep 30, 2026.
other
Environmental cleanup sites
Corning is named as a potentially responsible party for cleanup costs at 21 hazardous waste sites and had accrued $89 million for environmental cleanup and related litigation on Sep 30, 2026.
disclosure
Segments changed in Q1 FY2026
From 2026, Display and Specialty Materials form Glass Innovations, and Hemlock's polysilicon, wafers and modules form Solar. Corning recast FY2024 and FY2025 to the new structure; this page does not mix the two. Segment sales use Corning's fixed exchange rates: they total $16,408 million in FY2025, against GAAP net sales of $15,629 million, and the regional shares on this page use the same total. Segment net income is Corning's own measure, taxed at 21%.
disclosure
What the filings used here do not state
They name no customer above 10% of sales and give no credit rating level.
24How it got here
24How it got here
How did Corning get here?
1851
Milestone
A glass business starts
Corning traces its origins to a glass business founded in 1851; it was incorporated in New York in 1936.
1970
Milestone
First low-loss optical fiber
Corning invented the first low-loss optical fiber, the base of today's largest segment.
1989
Business-model change
Corning Glass Works becomes Corning Incorporated
Corning Glass Works changed its name to Corning Incorporated on Apr 28, 1989.
2023
Milestone
Springboard growth plan begins
Corning's Q3 FY2026 10-Q says it introduced Springboard, a plan to grow sales and profitability, in Q3 2023.
2025
Milestone
Solar factory lease starts
A lease for a solar manufacturing plant in Hemlock, Michigan began in Q3 2025, adding a $762 million right-of-use asset.
2026
Business-model change
New segments and AI deals
From Q1 2026 Corning reports Glass Innovations and Solar as segments. Its 2026 releases cite deals with Meta and Amazon, and it announced an NVIDIA partnership on May 6.
Sources (7)
25Sources and changes
Where every number on this page comes from
Sources (25 documents)
- S1Form 10-Q for Q3 FY2026 · SEC EDGAR · Tier 1: company or exchange filing · Oct 29, 2026
- S2Form 10-Q for Q2 FY2026 · SEC EDGAR · Tier 1: company or exchange filing · Jul 29, 2026
- S3Form 10-Q for Q1 FY2026 · SEC EDGAR · Tier 1: company or exchange filing · May 1, 2026
- S4Form 10-K for FY2025 · SEC EDGAR · Tier 1: company or exchange filing · Feb 12, 2026
- S5Form 10-Q for Q3 FY2025 · SEC EDGAR · Tier 1: company or exchange filing · Oct 31, 2025
- S6Form 10-Q for Q2 FY2025 · SEC EDGAR · Tier 1: company or exchange filing · Aug 1, 2025
- S7Form 10-Q for Q1 FY2025 · SEC EDGAR · Tier 1: company or exchange filing · May 2, 2025
- S8Form 10-K for FY2024 · SEC EDGAR · Tier 1: company or exchange filing · Feb 13, 2025
- S9Form 10-Q for Q3 FY2024 · SEC EDGAR · Tier 1: company or exchange filing · Nov 1, 2024
- S10Form 10-Q for Q2 FY2024 · SEC EDGAR · Tier 1: company or exchange filing · Aug 2, 2024
- S11Form 10-Q for Q1 FY2024 · SEC EDGAR · Tier 1: company or exchange filing · May 2, 2024
- S12Form 10-K for FY2023 · SEC EDGAR · Tier 1: company or exchange filing · Feb 12, 2024
- S13Form 10-K for FY2022 · SEC EDGAR · Tier 1: company or exchange filing · Feb 13, 2023
- S14Form 10-K for FY2021 · SEC EDGAR · Tier 1: company or exchange filing · Feb 14, 2022
- S15Corning 2026 proxy statement (DEF 14A, record date Mar 2, 2026) · SEC EDGAR · Tier 1: company or exchange filing · Mar 20, 2026
- S16Q3 FY2026 earnings release (8-K Ex. 99.1) · SEC EDGAR · Tier 1: company or exchange filing · Oct 27, 2026
- S17Q2 FY2026 earnings release (8-K Ex. 99.1) · SEC EDGAR · Tier 1: company or exchange filing · Jul 28, 2026
- S18Q1 FY2026 earnings release (8-K Ex. 99.1) · SEC EDGAR · Tier 1: company or exchange filing · Apr 28, 2026
- S19Segment recast to the Q1 FY2026 structure (8-K, Apr 28, 2026) · SEC EDGAR · Tier 1: company or exchange filing · Apr 28, 2026
- S20Q4 FY2025 earnings release (8-K Ex. 99.1) · SEC EDGAR · Tier 1: company or exchange filing · Jan 28, 2026
- S21Q2 FY2025 earnings release (8-K Ex. 99.1) · SEC EDGAR · Tier 1: company or exchange filing · Jul 29, 2025
- S22Q1 FY2025 earnings release (8-K Ex. 99.1) · SEC EDGAR · Tier 1: company or exchange filing · Apr 29, 2025
- S238-K, NVIDIA securities purchase agreement, warrants and partnership release (May 6, 2026) · SEC EDGAR · Tier 1: company or exchange filing · May 6, 2026
- S248-K, $1.5 billion revolving credit agreement (Jul 30, 2025) · SEC EDGAR · Tier 1: company or exchange filing · Jul 30, 2025
- S258-K, equity distribution (at-the-market) agreement (Sep 11, 2026) · SEC EDGAR · Tier 1: company or exchange filing · Sep 11, 2026
Changes to this page (v1 · Nov 20, 2026)
- v1 · Nov 20, 2026First version. (first version)
Numbers come only from tier 1 and tier 2 sources. Read how we research.
Disclaimer
For learning only. Cityfort is not a registered investment adviser or broker-dealer and does not recommend buying or selling any security. Prices shown are dated and may be out of date.
Investing in securities involves risk, including loss of capital. Before making any investment decision, do your own research and consider consulting a registered investment adviser or other qualified professional.
Cityfort, its owners and contributors may or may not hold securities of companies covered. Cityfort is not paid by any company it covers. Content is not an offer or solicitation to buy or sell any security, including in any initial public offering.
Read the positions policyRead the full disclaimerHide the full disclaimer
Cityfort publishes general educational content that explains how listed companies work. Cityfort is not registered with the US Securities and Exchange Commission or any state securities regulator as an investment adviser, and is not a broker-dealer or a member of FINRA. Cityfort does not provide investment, tax or legal advice, recommendations, ratings, price targets or any opinion on whether to buy, sell or hold any security. Nothing on the site is tailored to any person's circumstances.
All information is taken from publicly available sources, mainly company filings with the SEC, which are listed on each page with dates. We work to keep it accurate and correct errors publicly, but we do not guarantee that it is complete, accurate or up to date. Any market price or price-based ratio shown is dated, may be out of date by the time you read it, and is included only to explain concepts.
Statements by company management, including forward-looking statements and guidance, are reported as the company's statements, with their date and source; they are not our forecasts. Adjusted (non-GAAP) figures are the company's own measures and are shown next to the official (GAAP) figures.