Health Care · NYSE: BSX
Boston Scientific: how the business works
Boston Scientific makes heart, blood vessel, digestive, urology and nerve devices that doctors use inside the body, with $20.1 billion of net sales in FY2025.
By Hardik Bhandare · Checked against filings: . Editorial policy. Corrections
Follow Boston Scientific
Email me when Boston Scientific's page is updated after earnings.
We'll send a confirmation email first. See our privacy policy.
Boston Scientific Corporation · Marlborough, Massachusetts · Founded 1979
Updated for Q3 FY2026 · checked
- Net sales, FY2025
- $20.1B
- Net income, FY2025
- $2.9B
- Cardiovascular share of net sales, FY2025
- 66%
- Employees, Dec 2025
- About 59,000
- Largest holder (Vanguard), 2026 proxy
- 8.44%
The short version
Boston Scientific in 5 points
1 · What it sells
Boston Scientific makes medical devices that doctors use inside the body, mostly through a catheter or a scope, and had net sales of $20.1 billion in FY2025 across eight businesses.
2 · Who pays it
Hospitals and other buyers in the United States paid 64.1% of FY2025 net sales, while buyers in Europe, the Middle East and Africa paid 17.2%, Asia-Pacific 15.3% and Latin America and Canada 3.4%.
3 · What it keeps from $100
Of every $100 that came in during FY2025, Boston Scientific kept $14.3 as net income; its operating income, before interest and tax, was 18.0% of sales.
4 · Where the operating profit comes from
In FY2025 the Cardiovascular segment earned $4.30 billion of segment operating income before corporate costs and amortization, against $2.27 billion for MedSurg.
5 · The one thing to watch
Boston Scientific's Oct 28, 2026 release estimates FY2026 net sales growth of about 4.25%, down from the 10.5% to 11.5% it estimated on Feb 4, 2026.
Sources: From Boston Scientific's FY2025 10-K and its Q4 FY2025 and Q3 FY2026 earnings releases · checked
01Where the money goes · FY2025
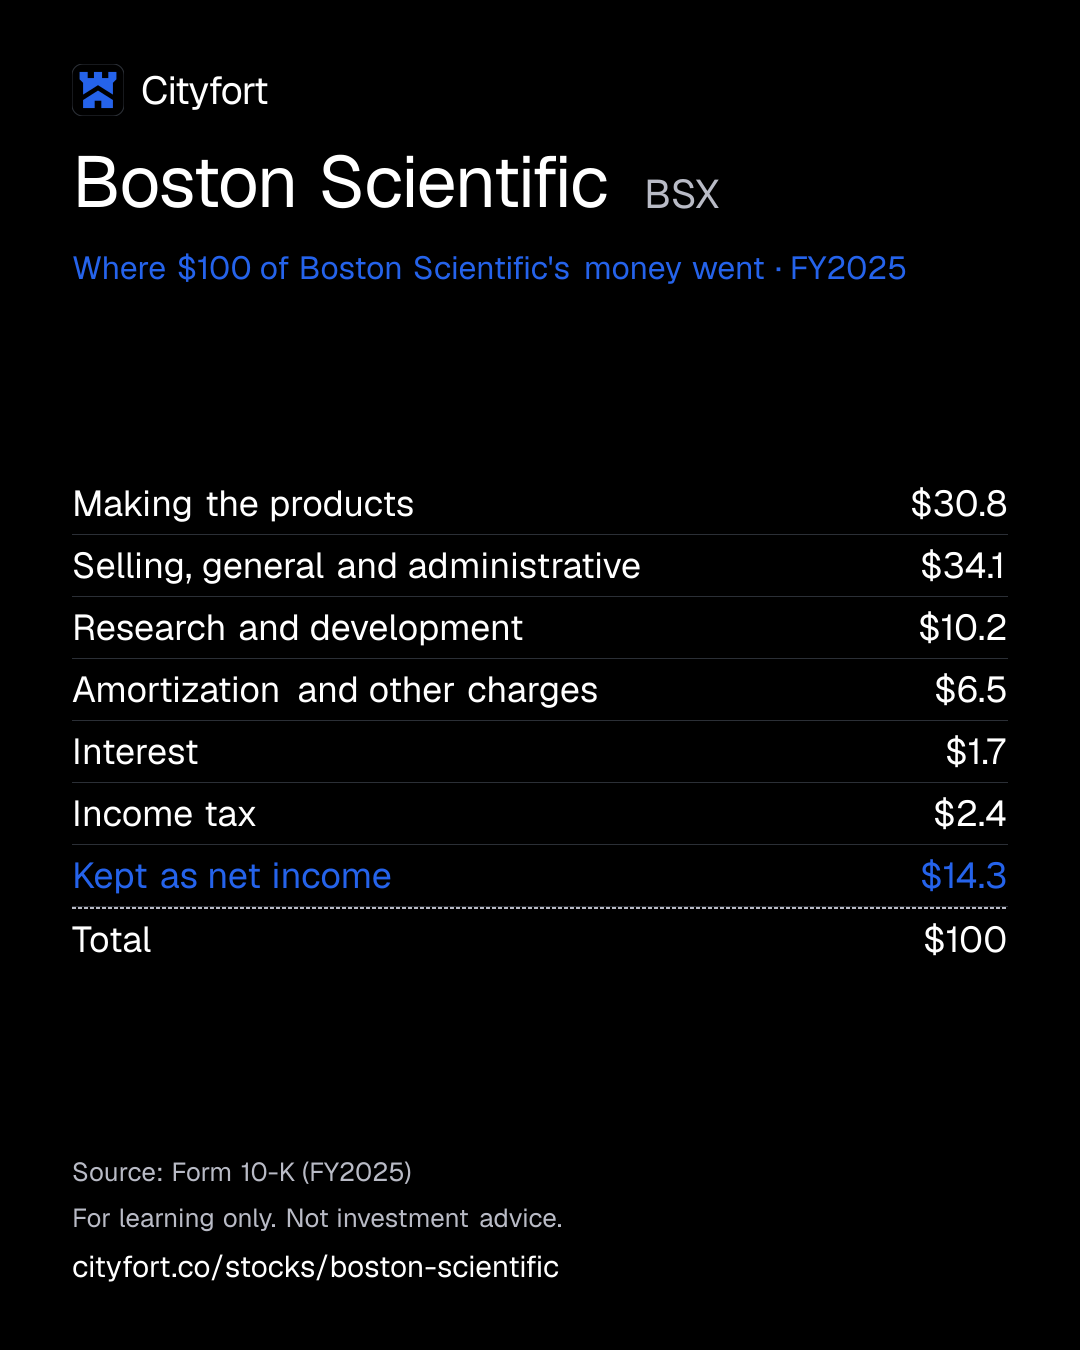
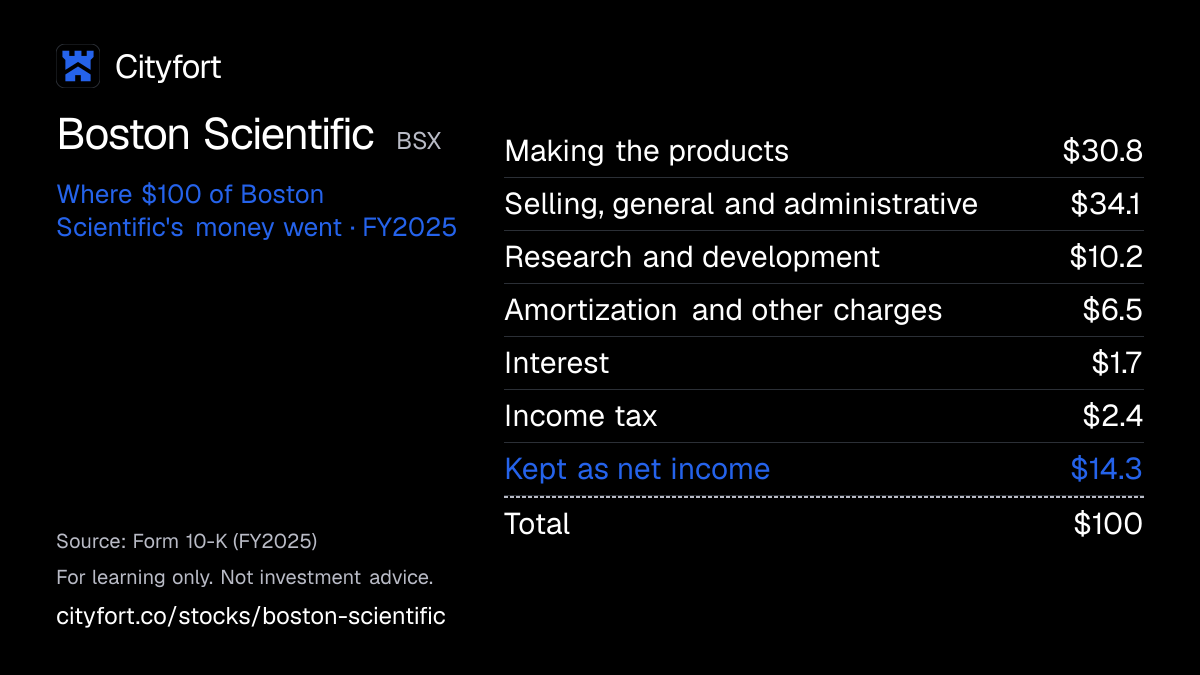
Where does $100 of Boston Scientific's money go?
Boston Scientific · FY2025
Receipt for every $100
| Making the products | $30.8 |
|---|---|
| Selling, general and administrative | $34.1 |
| Research and development | $10.2 |
| Amortization and other charges | $6.5 |
| Interest | $1.7 |
| Income tax | $2.4 |
| Kept as net income | $14.3 |
| Total | $100 |
Each line = amount ÷ total money in × 100. Lines may not add to exactly $100 because of rounding.
How this is worked out
Cityfort calculation from the FY2025 10-K. Of every $100 that came in during FY2025 (net sales of $20.07 billion plus $121 million of other income): each line = line ÷ $20.20 billion × 100.
Save this receipt as an image
Embed this receipt or the key numbers
Paste this code into a blog or website to show the card you choose, with a link back to this page.
Each week: the next company due to report earnings, explained in 5 points.
No tips. Unsubscribe anytime.
We'll send a confirmation email. See our privacy policy.
02The business in one line
What does Boston Scientific do?
Hospitals buy Boston Scientific's devices for their doctors' procedures. Of every $100 that came in during FY2025, making the products took $30.8, selling and running the business $34.1, research $10.2, and $14.3 was left as net income.
- Hospitals, clinics, buying groups and distributors in 127 countries pay for the devices; no single customer was more than 10% of net sales in 2023 to 2025, the FY2025 10-K says.
- The Cardiovascular segment, which includes Electrophysiology and Watchman, brought in 66% of FY2025 net sales and MedSurg the other 34%.
03Who pays it
Who pays Boston Scientific?
Boston Scientific does not disclose how much each type of customer pays.
Hospitals, clinics and medical offices
Hospitals, clinics, outpatient facilities and medical offices in 127 countries buy the devices that their doctors use in procedures.
Buying groups and hospital networks
Large group purchasing organizations, hospital networks and other buying groups negotiate for many hospitals; the FY2025 10-K says they represent a substantial portion of net sales.
Distributors and dealers
In countries without a Boston Scientific sales force, distributors and dealers buy and resell the products.
Insurers and governments (indirectly)
Hospitals and doctors usually bill insurers and government health programs for procedures, so their payment rules affect demand for the devices.
Where its revenue came from · FY2025
- United States64.1%
- Europe, Middle East and Africa17.2%
- Asia-Pacific15.3%
- Latin America and Canada3.4%
How spread out the customers are
No single customer was more than 10% of net sales in 2025, 2024 or 2023, the FY2025 10-K says. US customers bought 64.1% of FY2025 net sales (Cityfort calculation from the FY2025 10-K).
Sources (1)
04How it makes money
How does Boston Scientific make money?
Devices sell for about three times what they cost to make, so fast sales growth lifts profit
In FY2025 Boston Scientific kept $69.0 of gross profit from every $100 of sales. Net sales grew 19.9% while selling and administration costs grew 15.1%, and operating income rose from 15.5% of sales in FY2024 to 18.0%.
Net income per $100 of sales
$8.3$14.4
FY2021 to FY2025
- Trial results and approvals lead doctors to adopt a new device
- Sales of the device grow, as Electrophysiology did from $0.8 billion in FY2023 to $3.3 billion in FY2025
- Each sale leaves a large gross profit, $69.0 per $100 of sales in FY2025
- When sales grow faster than selling and administration costs, more of each $100 is kept
- Cash goes into research and into buying companies such as Axonics and Silk Road Medical, which adds products to sell
↺ Step 5 feeds back into step 1.
05Business segments · FY2025
Which businesses make up Boston Scientific?
Cardiovascular
66%Artery and vascular devices, Watchman, Electrophysiology, pacemakers and defibrillators, and interventional oncology. Segment operating income, before corporate costs and amortization, was 32.4% of its segment sales.
Revenue $13.3B ($13,250M) · Operating profit $4.3B ($4,303M)
MedSurg
34%Endoscopy, Urology and Neuromodulation. Segment operating income, before corporate costs and amortization, was 33.2% of its segment sales.
Revenue $6.8B ($6,824M) · Operating profit $2.3B ($2,268M)
How the mix changed
- Cardiovascular
- MedSurg
Revenue by segment, FY2023 to FY2025.
US$
See the numbers
Sources (1)
06The numbers · Consolidated · US$
How has Boston Scientific done?
Revenue
$20.1BFY2025
Net sales rose every year, from $11.9 billion in FY2021 to $20.1 billion in FY2025. They grew 1.5% in Q3 FY2026 after an August 2026 cyber incident disrupted manufacturing and shipping.
US$
See the numbers
Net income
$2.9BFY2025
Net income rose from $1.0 billion in FY2021 to $2.9 billion in FY2025, with a dip to $0.6 billion in FY2022. Q1 FY2026 included a $383 million one-time tax benefit.
US$
See the numbers
Net income for every $100 of revenue
$14.4FY2025
Net income per $100 of sales rose from $8.3 in FY2021 to $14.4 in FY2025. EBITDA (operating income plus depreciation and amortization) was $24.8 per $100 in FY2025 (Cityfort calculation from the FY2025 10-K).
Net margin: $ of net income per $100 of revenue
See the numbers
Free cash flow
$3.7BFY2025
Free cash flow (cash from operations minus purchases of property, plant and equipment) rose from $1.3 billion in FY2021 to $3.7 billion in FY2025. It was $2.3 billion in the first nine months of 2026 (Cityfort calculation from the Q3 FY2026 10-Q).
US$ · cash from operations minus spending on plants and equipment
See the numbers
See all yearly numbers
EBITDA here = operating income plus depreciation and amortization (from the cash flow statement). Fiscal years are the company's own: December 31 (the fiscal year is the calendar year, so Q3 FY2026 is July to September 2026). Net income is the share belonging to the company's owners. Total net income differs from net profit to the company's owners: Net income attributable to common stockholders excludes the $6 million of losses attributable to noncontrolling interests; total net income was $2,892 million.
Learn: Stock-based compensation and dilution: pay that becomes shares
Sources (16)
- Form 10-K for FY2021
- Form 10-K for FY2023
- Form 10-K for FY2022
- Form 10-K for FY2024
- Form 10-K for FY2025
- Form 10-Q for Q1 FY2024
- Form 10-Q for Q2 FY2024
- Form 10-Q for Q3 FY2024
- Q4 FY2024 earnings release (8-K Ex. 99.1)
- Form 10-Q for Q1 FY2025
- Form 10-Q for Q2 FY2025
- Form 10-Q for Q3 FY2025
- Q4 FY2025 earnings release (8-K Ex. 99.1)
- Form 10-Q for Q1 FY2026
- Form 10-Q for Q2 FY2026
- Form 10-Q for Q3 FY2026
07Who runs it
Who runs Boston Scientific, and did they deliver?
Michael F. Mahoney
Chairman and Chief Executive Officer · since 2012
President from Oct 2011, CEO and director from Nov 2012 and Chairman since May 2016. The 2026 proxy lists 3,299,890 shares, including 1,437,684 options he could exercise within 60 days.
Jonathan R. Monson
Executive Vice President and Chief Financial Officer · since 2025
CFO since Jun 30, 2025.
Arthur C. Butcher
Executive Vice President and Group President, MedSurg and Asia Pacific · since 2022
Joseph M. Fitzgerald
Executive Vice President and Group President, Cardiovascular · since 2022
Role as listed in the 2026 proxy. The Q3 FY2026 10-Q lists an offer letter between him and the company dated Oct 1, 2026.
Vance R. Brown
Executive Vice President, General Counsel and Corporate Secretary · since 2021
Edward J. Ludwig
Lead Independent Director · since 2016
Director since March 2014 and former Chairman and CEO of Becton Dickinson.
What they said, and what happened
3 delivered · 1 missed · 2 too early to tell
Said on Apr 23, 2025
FY2025 net sales growth of 15% to 17% on a reported basis.
DeliveredWhat happened
Net sales grew 19.9% in FY2025. The company had raised its estimate to 18% to 19% in July and about 20% in October 2025.
Said on Oct 22, 2025
Q4 FY2025 net sales growth of 14.5% to 16.5% on a reported basis.
DeliveredWhat happened
Q4 FY2025 net sales grew 15.9%.
Said on Apr 22, 2026
Q2 FY2026 adjusted EPS of $0.82 to $0.84.
DeliveredWhat happened
Q2 FY2026 adjusted EPS was $0.86.
Said on Jul 29, 2026
Q3 FY2026 net sales growth of 3% to 5% and adjusted EPS of $0.80 to $0.82.
MissedWhat happened
Q3 FY2026 net sales grew 1.5% and adjusted EPS was $0.73; the August 2026 cyber incident disrupted manufacturing and shipping in the quarter.
Said on Feb 4, 2026
FY2026 net sales growth of 10.5% to 11.5% reported and adjusted EPS of $3.43 to $3.49.
Too early to tellWhat happened
The company lowered the estimate in April, July and October 2026; its Oct 28, 2026 release estimates about 4.25% growth and $3.16 to $3.18. The year ends Dec 31, 2026.
Said on Feb 17, 2026
Complete the Penumbra acquisition during 2026.
Too early to tellWhat happened
After an FTC request for more information on Mar 16, 2026, the Q3 FY2026 10-Q expects completion in early 2027.
Sources (10)
- 2026 proxy statement (DEF 14A)
- Form 10-Q for Q3 FY2026
- Q1 FY2025 earnings release (8-K Ex. 99.1)
- Q4 FY2025 earnings release (8-K Ex. 99.1)
- Q2 FY2025 earnings release (8-K Ex. 99.1)
- Q3 FY2025 earnings release (8-K Ex. 99.1)
- Q1 FY2026 earnings release (8-K Ex. 99.1)
- Q2 FY2026 earnings release (8-K Ex. 99.1)
- Q3 FY2026 earnings release (8-K Ex. 99.1)
- Form 10-K for FY2025
08What could go wrong
What could go wrong for Boston Scientific?
- Technology
Recovery from the August 2026 cyber incident
The incident disrupted manufacturing, order processing and shipping and materially impacted Q3 FY2026, the 10-Q says. Q3 net sales grew 1.5% against the company's estimate of 3% to 5%.
Watch Q4 FY2026 net sales against the company's estimate of a 1.0% to 3.0% fall
- Competition
More competition in Electrophysiology
Electrophysiology grew from $800 million in FY2023 to $3.33 billion in FY2025, and the Q3 FY2026 10-Q cites increased competition in 2026.
Watch Electrophysiology sales in the FY2026 10-K
- Demand
Slower left atrial appendage closure market
The Q3 FY2026 10-Q says a deceleration in this market affected Watchman procedures in 2026. Watchman was $1.96 billion, 9.8% of FY2025 net sales.
Watch Watchman sales in FY2026 against $1,958 million in FY2025
- Debt
Penumbra deal and more debt
The Penumbra purchase, about $14.5 billion, awaits FTC review; the company said in its Q3 FY2026 10-Q (Nov 2, 2026) that it expects completion in early 2027. A $6.0 billion term loan can be drawn at closing, on top of $11.95 billion of debt at Sep 30, 2026.
Watch The FTC outcome, and total debt and the leverage ratio after closing
- Legal
Lawsuits and legal charges
Litigation-related net charges were $157 million in the first nine months of 2026, against none a year earlier, and the legal accrual rose to $370 million. Cases include spinal cord stimulator and surgical mesh product liability claims and a securities class action alleging misleading statements.
Watch Litigation-related charges and the legal accrual in each 10-Q and 10-K
- Pricing
Price pressure from buyers and governments
The FY2025 10-K says buying groups, governments and insurers push to contain health care costs. The Q3 FY2026 10-Q names volume-based procurement in China, where the government buys at set prices, as a reason for the Endoscopy and Urology declines.
Watch Asia-Pacific sales growth, which was -0.6% in Q3 FY2026
- Regulation
Tax incentives that expire
The Costa Rica plants operate under a Free Trade Zone regime, and the company benefits from tax holidays elsewhere; the FY2025 10-K says these benefits end unless extended.
Watch The effective tax rate in each 10-K
09Supporters vs. critics
What do supporters and critics point to?
What supporters point to
- Net sales rose every year, from $11.9 billion in FY2021 to $20.1 billion in FY2025.
- Electrophysiology sales grew from $800 million in FY2023 to $3.33 billion in FY2025 after FARAPULSE launched in the US in 2024.
- Net income per $100 of sales rose from $8.3 in FY2021 to $14.4 in FY2025, and free cash flow rose from $1.3 billion to $3.7 billion.
- FY2025 net sales grew 19.9%, above the 15% to 17% the company estimated in April 2025.
What critics point to
- After an August 2026 cyber incident, Q3 FY2026 net sales grew 1.5%, below the company's July estimate of 3% to 5%. On Oct 28, 2026 it cut its FY2026 growth estimate to about 4.25%.
- The Q3 FY2026 10-Q cites increased competition in Electrophysiology and a slowdown in the left atrial appendage closure market that affected Watchman in 2026.
- Net debt was $11.3 billion at Sep 30, 2026, up from $9.47 billion at Dec 31, 2025 (Cityfort calculation from the Q3 FY2026 10-Q and the FY2025 10-K). A $6.0 billion term loan can be drawn when the Penumbra purchase closes.
- Goodwill and other intangible assets were 56.3% of total assets at Sep 30, 2026 (Cityfort calculation from the Q3 FY2026 10-Q).
10What to watch next
What should you watch next at Boston Scientific?
Next event
Q4 FY2026 results
Date not announced yet.
Q4 FY2026 net sales
In its Oct 28, 2026 release the company said it expects Q4 FY2026 net sales to fall 1.0% to 3.0%; the Q4 results will show the actual figure.
Penumbra purchase
The roughly $14.5 billion deal awaits FTC review; the company said in its Q3 FY2026 10-Q (Nov 2, 2026) that it expects completion in early 2027.
Electrophysiology and Watchman sales
Electrophysiology had $3.33 billion and Watchman $1.96 billion of FY2025 net sales; the Q3 FY2026 10-Q cites more competition and a slower market in 2026.
11Key facts
Key facts about Boston Scientific
- What does Boston Scientific do?
- Boston Scientific makes medical devices that doctors use inside the body, mostly through a thin tube (catheter) or a scope instead of open surgery. It had net sales of $20.1 billion in FY2025 across eight businesses, from heart rhythm tools to kidney stone lasers.
- How does Boston Scientific make money?
- Boston Scientific sells its devices to hospitals and other buyers. In FY2025 it kept $69.0 of gross profit from every $100 of sales and $14.3 as net income from every $100 that came in.
- Who are Boston Scientific's customers?
- Boston Scientific sells to hospitals, clinics, outpatient centers and medical offices in 127 countries, often through buying groups and hospital networks, and through distributors where it has no sales force. No single customer was more than 10% of its net sales in 2023, 2024 or 2025, its FY2025 10-K says.
- How big is Boston Scientific?
- Boston Scientific had net sales of $20.1 billion in FY2025, up 19.9% from FY2024, and net income of $2.9 billion. It had about 59,000 employees at Dec 31, 2025.
- Which part of Boston Scientific earns the most?
- Boston Scientific's Cardiovascular segment had $13.25 billion of FY2025 net sales, 66% of the total, and $4.30 billion of segment operating income before corporate costs and amortization. MedSurg had $6.82 billion of sales and $2.27 billion of segment operating income.
- Where does Boston Scientific sell its devices?
- Customers in the United States bought 64.1% of Boston Scientific's FY2025 net sales (Cityfort calculation from the FY2025 10-K). Europe, the Middle East and Africa took 17.2%, Asia-Pacific 15.3% and Latin America and Canada 3.4%.
- Who owns Boston Scientific?
- Boston Scientific's largest holders listed in its 2026 proxy statementThe yearly filing about shareholder votes, the board and executive pay. Learn more were The Vanguard Group with 8.44%, BlackRock with 7.60% and FMR (Fidelity) with 7.42%. Its directors and executive officers as a group held under 1% on Mar 6, 2026. It had 1,449,473,222 common shares on Oct 29, 2026.
- How did Boston Scientific do in Q3 FY2026?
- Boston Scientific's net sales were $5.14 billion in Q3 FY2026, up 1.5% from a year earlier, and net income attributable to common stockholders was $582 million. Its Q3 FY2026 10-Q says a cybersecurity incident found in August 2026 disrupted manufacturing, order processing and shipping in the quarter.
- Does Boston Scientific pay a dividend?
- Boston Scientific paid no cash dividend in 2023, 2024 or 2025. In May 2026 it paid $2.0 billion for an accelerated share repurchase, and its share count fell from 1,486 million in March 2026 to 1,449 million in October 2026.
Terms on this page
- Capital expenditures (capex)
- Debt-to-equity
- Earnings per share (EPS)
- EBITDA
- Free cash flow
- Net debt
- Net margin
- Revenue vs net income
- Stock buyback
Each explains the term in plain English, with the same number from other companies on Cityfort.
Go deeper
More detail from the same filings. Open any section.
12What it sells
12What it sells
What does Boston Scientific sell?
Interventional Cardiology and Vascular Therapies ($4.64 billion, FY2025)
Catheters, balloons, stents and imaging tools that open blocked heart and leg arteries, such as AVVIGO+ imaging and Bolt Medical lithotripsy, which breaks up hard deposits.
Electrophysiology ($3.33 billion)
Tools that treat an irregular heartbeat (atrial fibrillation) by ablation, led by the FARAPULSE pulsed field ablation system launched in the US in 2024, plus OPAL HDx heart mapping.
Cardiac Rhythm Management ($2.33 billion)
Pacemakers and defibrillators, including the EMBLEM S-ICD placed under the skin, and HeartLogic heart-failure alerts.
Watchman ($1.96 billion)
An implant that closes a small pouch of the heart, the left atrial appendage, in people with atrial fibrillation at risk of stroke who can take blood thinners.
Interventional Oncology and Embolization ($996 million)
TheraSphere radioactive glass beads for liver tumors and coils such as EMBOLD that block blood vessels.
Endoscopy ($2.92 billion)
Devices used through a scope in the digestive tract, such as Resolution 360 and MANTIS clips and WallFlex and AXIOS stents.
Urology ($2.71 billion)
Kidney stone tools (LithoVue scopes, Lumenis Pulse lasers), the GreenLight XPS prostate laser and Axonics bladder and bowel nerve stimulators.
Neuromodulation ($1.20 billion)
WaveWriter Alpha spinal cord stimulators for chronic pain, Intracept for low back pain and Vercise deep brain stimulation.
What it does
- Does: Makes and sells devices for heart, blood vessel, digestive, urology and nerve procedures
- Does: Sells in 127 countries, through its own sales teams in most of them and distributors elsewhere
- Does: Runs 13 main factories: six in the US and Puerto Rico, three in Ireland, two in Costa Rica and one each in Malaysia and China
What it does not do
- Does not: Does not sell mainly to patients: hospitals, clinics and doctors' offices are its buyers
- Does not: Does not pay a cash dividend (none in 2023, 2024 or 2025)
- Does not: Has no single customer above 10% of net sales
Sources (2)
13How the money flows
13How the money flows · FY2025
How does money flow through Boston Scientific?
Money in
- Net sales$20.1B
- Other income, net$121M
The company
Boston Scientific
$20.2B came in
Money out
- Cost of making the products$6.2B
- Selling, general and administrative costs$6.9B
- Research and development$2.1B
- Amortization, impairments, restructuring, litigation and other charges$1.3B
- Interest expense$349M
- Income tax$493M
- Net income$2.9B
- Hospitals, clinics and other buyers paid Boston Scientific $20.1 billion of net sales in FY2025, and other income added $121 million.
- Making the products cost $6.2 billion, leaving $13.9 billion of gross profit, or $69.0 of every $100 of sales.
- Sales teams and administration took $6.9 billion and research and development $2.1 billion.
- Amortization of acquired intangibles, impairments, restructuring, litigation and other charges took $1.3 billion, leaving $3.6 billion of operating income.
- Interest cost $349 million and income tax $493 million, and $2.9 billion was left as net income.
Sources (1)
14What it needs to run
14What it needs to run
What does Boston Scientific need to run?
Factories
13 principal manufacturing sites: six in the US and Puerto Rico, three in Ireland, two in Costa Rica, one in Malaysia and one in China.
People
About 59,000 employees at Dec 31, 2025, about 60% of them outside the US.
Research and clinical trials
Research and development cost $2.05 billion in FY2025, 10.2% of net sales, and the company reports new trial results in its earnings releases.
Regulatory approvals
Each device needs clearance in each market, such as the FDA approval in Q2 2025 that let FARAPULSE be used for persistent atrial fibrillation.
Tax incentives
The Costa Rica plants operate under a Free Trade Zone regime, and the company has tax holidays in other countries; the FY2025 10-K says these benefits end unless extended.
15Where it sells
15Where it sells · FY2025
Where does Boston Scientific sell?
- United States64.1%
- Europe, Middle East and Africa17.2%
- Asia-Pacific15.3%
- Latin America and Canada3.4%
Sources (1)
16Where growth could come from
16Where growth could come from
Where could Boston Scientific's growth come from?
In its Oct 28, 2026 earnings release, Boston Scientific said it now estimates FY2026 net sales growth of about 4.25% reported and about 3.75% organic, and adjusted EPS of $3.16 to $3.18. Its Feb 4, 2026 release had estimated 10.5% to 11.5% reported growth. It expects Q4 FY2026 net sales to fall 1.0% to 3.0%.
Electrophysiology (FARAPULSE)
Mixed$800M (FY2023) to $3,325M (FY2025)
Sales more than quadrupled after FARAPULSE launched in the US in 2024; the Q3 FY2026 10-Q cites increased competition in 2026.
Status: Mixed, partly on track.
Watchman
Mixed$1,274M (FY2023) to $1,958M (FY2025)
Sales grew 29.2% in FY2025; the Q3 FY2026 10-Q says a slowdown in the left atrial appendage closure market affected Watchman procedures in 2026.
Status: Mixed, partly on track.
Interventional Cardiology and Vascular Therapies
Working$4,639M in FY2025, up 10.5%
The Q3 FY2026 10-Q says this business drove the quarter's sales increase.
Status: Working, on track against what the company said.
Neuromodulation
Working+13.1% in Q3 FY2026
Neuromodulation sales rose 13.1% in Q3 FY2026 while Endoscopy and Urology sales fell.
Status: Working, on track against what the company said.
Penumbra acquisition
NewAbout $14.5 billion, pending
Agreed on Jan 15, 2026 to buy Penumbra, a maker of devices that remove blood clots. The FTC asked for more information, and the company said in its Q3 FY2026 10-Q (Nov 2, 2026) that it expects to close in early 2027.
Status: New, recently announced.
Status compares progress with what the company itself said it would do: Working = on track against what the company said; Mixed = partly on track; Behind = behind the company's own plan; New = recently announced; Early = too early to judge.
17The company's own measures (non-GAAP)
17The company's own measures · FY2025 and Q3 FY2026
What do Boston Scientific's own measures show?
Official (GAAP): Diluted EPS, FY2025
$1.94
Company's own measure: Adjusted EPS, FY2025
$3.06
Boston Scientific leaves out amortization, goodwill and other intangible impairments, acquisition and divestiture items, restructuring, certain litigation charges, EU medical device regulation costs, debt extinguishment charges and other items.
Official (GAAP): Diluted EPS, Q3 FY2026
$0.40
Company's own measure: Adjusted EPS, Q3 FY2026
$0.73
Same exclusions; per share, amortization added back $0.14, restructuring $0.05, acquisition-related items $0.04 and an intangible impairment $0.02.
Official (GAAP): Reported net sales growth, FY2025 (as stated in the Q4 FY2025 earnings release)
19.9%
Company's own measure: Organic net sales growth, FY2025
15.8%
Organic growth leaves out currency moves and sales from acquisitions and divestitures that lack a full year of comparable sales.
Official (GAAP): Reported net sales growth, Q3 FY2026 (as stated in the Q3 FY2026 earnings release)
1.5%
Company's own measure: Organic net sales growth, Q3 FY2026
1.5%
Same definition; in Q3 FY2026 the two measures were equal.
These are the company's own measures, defined by the company. They are not comparable across companies, and they are not added together. Each sits beside the nearest official (GAAP) figure.
Learn: Non-GAAP measures: what a company's "adjusted" numbers leave out
18Financial strength and debt
18Financial strength · Sep 30, 2026
How much debt does Boston Scientific have?
- Total debt$12.0B
- Cash and investments$609M
- Net debt (debt minus cash)$11.3B
- Net worth (shareholders' money)$25.6B
- Debt to equity
- 0.47×
- $ of debt for every $1 of shareholders' money
- Net debt is total debt of $11.95 billion (current $1.04 billion plus long-term $10.91 billion) minus $609 million of cash (Cityfort calculation from the Q3 FY2026 10-Q). At Dec 31, 2025 it was $9.47 billion (Cityfort calculation from the FY2025 10-K).
- The leverage ratio under the credit agreements was 1.95 times at Sep 30, 2026, against a maximum of 3.75 times, the 10-Q says; the maximum can rise to 4.75 times for four quarters after a qualifying acquisition.
- A $6.0 billion term loan agreement signed Feb 26, 2026 can be drawn only when the Penumbra acquisition closes.
- Cash fell from $1.97 billion at Dec 31, 2025 to $609 million at Sep 30, 2026; in between, the company paid $2.0 billion for an accelerated share repurchase, and other investments rose from $681 million to $2.29 billion.
- Goodwill and other intangible assets were $25.6 billion, or 56.3% of total assets of $45.5 billion at Sep 30, 2026 (Cityfort calculation from the Q3 FY2026 10-Q).
Sources (2)
19Who owns it
19Who owns it · ownership as of Mar 6, 2026
Who owns Boston Scientific?
- Officers and directors (as a group), shares
- 0.3%
Share classes
Holders of 5% or more
From the company's proxy statement (DEF 14A), later Schedule 13G filings and the share counts on its latest annual or quarterly report. Each holder row shows the date of its own filing.
Learn: How to read a proxy statement (DEF 14A): Nvidia's 2026 proxy · Form 4 insider filings: who files, the codes and the footnotes
20What it does with profit
20What it does with profit
What does Boston Scientific do with its profit?
Buyback · May 19, 2026
Paid $2.0 billion to JPMorgan under an accelerated share repurchase agreed May 18, 2026, receiving about 30 million shares at first. The board had raised the buyback authorization to $5.0 billion on Feb 18, 2026.
$2.0B
Sources (1)
21Governance signals
21Governance signals
What do Boston Scientific's governance filings show?
- Auditor
- Ernst & Young LLP, since 1992
- Auditor changes
- None in the period covered
- Audit qualifications
- None reported
- Related-party dealings
- The 2026 proxy says the Nominating and Governance Committee reviewed and pre-approved 2025 transactions involving two sons of Joseph Fitzgerald, Executive Vice President and Group President, Cardiovascular. Both work in the Electrophysiology business. One earned about $1,036,021 in 2025, mostly sales commissions, and the proxy says this matched pay for similar roles.
- Credit rating
- Moody's, S&P Global Ratings and Fitch Ratings (as stated in the FY2025 10-K) Investment grade at all three (the filing gives no rating levels) (outlook Not stated in the filing), Feb 17, 2026
A credit rating describes the company's ability to repay debt. It is not a rating of the share.
Flags to know about
other
Cybersecurity incident in August 2026
Boston Scientific identified a cybersecurity incident in August 2026 that disrupted manufacturing, order processing and shipping worldwide. Its Q3 FY2026 10-Q says the incident materially impacted third-quarter results.
other
Shareholder lawsuits filed in 2026
A putative securities class action filed Mar 5, 2026 in Massachusetts federal court against the company and certain officers alleges violations of Sections 10(b) and 20(a) of the Securities Exchange Act, after the share price drop of Feb 4, 2026. Several shareholder derivative complaints followed between March and July 2026.
other
Product liability cases
On Jun 5, 2026 a federal panel consolidated pending and future federal cases alleging injuries from Boston Scientific spinal cord stimulators in the Central District of California. Transvaginal surgical mesh claims also remain. The legal accrual was $370 million at Sep 30, 2026, up from $242 million at Dec 31, 2025.
disclosure
Credit rating levels not in the filings
Boston Scientific's FY2025 10-K and 2026 10-Qs say it holds investment grade ratings at three agencies but give no rating levels; no agency document was collected for this page.
22How it got here
22How it got here
How did Boston Scientific get here?
1979
Milestone
Incorporated
The company's original certificate of incorporation was filed on Jun 22, 1979, the 2026 proxy says.
2012
Milestone
Mike Mahoney becomes CEO
Michael Mahoney, president since Oct 2011, became CEO in Nov 2012 and chairman in May 2016.
2024
Business-model change
FARAPULSE launched in the US
The pulsed field ablation system launched in the US in Q1 2024; Electrophysiology sales rose from $800 million in FY2023 to $3.33 billion in FY2025.
2024
Milestone
Silk Road Medical and Axonics bought
Bought Silk Road Medical (Cardiovascular) in Q3 2024 and Axonics (Urology) on Nov 15, 2024.
2025
Milestone
Businesses reorganized
In Q4 2025 it combined Cardiology and Peripheral Interventions into one Cardiovascular business and began showing Watchman and Electrophysiology sales separately.
2026
Business-model change
Agreement to buy Penumbra
Agreed on Jan 15, 2026 to buy Penumbra for about $14.5 billion; the Q3 FY2026 10-Q (Nov 2, 2026) says the company expects completion in early 2027.
2026
Milestone
$2.0 billion share buyback
Paid $2.0 billion in May 2026 under an accelerated share repurchase, after buying back no shares in 2024 or 2025.
2026
Crisis
Cyber incident and lower estimates
A cyber incident in August 2026 disrupted operations; on Oct 28, 2026 the company lowered its FY2026 net sales growth estimate to about 4.25%.
23Sources and changes
Where every number on this page comes from
Sources (23 documents)
- S1Form 10-Q for Q3 FY2026 · SEC EDGAR · Tier 1: company or exchange filing · Nov 2, 2026
- S2Form 10-Q for Q2 FY2026 · SEC EDGAR · Tier 1: company or exchange filing · Aug 3, 2026
- S3Form 10-Q for Q1 FY2026 · SEC EDGAR · Tier 1: company or exchange filing · May 1, 2026
- S4Form 10-K for FY2025 · SEC EDGAR · Tier 1: company or exchange filing · Feb 17, 2026
- S5Form 10-Q for Q3 FY2025 · SEC EDGAR · Tier 1: company or exchange filing · Nov 3, 2025
- S6Form 10-Q for Q2 FY2025 · SEC EDGAR · Tier 1: company or exchange filing · Aug 1, 2025
- S7Form 10-Q for Q1 FY2025 · SEC EDGAR · Tier 1: company or exchange filing · May 1, 2025
- S8Form 10-K for FY2024 · SEC EDGAR · Tier 1: company or exchange filing · Feb 18, 2025
- S9Form 10-Q for Q3 FY2024 · SEC EDGAR · Tier 1: company or exchange filing · Nov 1, 2024
- S10Form 10-Q for Q2 FY2024 · SEC EDGAR · Tier 1: company or exchange filing · Aug 1, 2024
- S11Form 10-Q for Q1 FY2024 · SEC EDGAR · Tier 1: company or exchange filing · May 1, 2024
- S12Form 10-K for FY2023 · SEC EDGAR · Tier 1: company or exchange filing · Feb 20, 2024
- S13Form 10-K for FY2022 · SEC EDGAR · Tier 1: company or exchange filing · Feb 23, 2023
- S14Form 10-K for FY2021 · SEC EDGAR · Tier 1: company or exchange filing · Feb 23, 2022
- S152026 proxy statement (DEF 14A) · SEC EDGAR · Tier 1: company or exchange filing · Mar 18, 2026
- S16Q3 FY2026 earnings release (8-K Ex. 99.1) · SEC EDGAR · Tier 1: company or exchange filing · Oct 28, 2026
- S17Q2 FY2026 earnings release (8-K Ex. 99.1) · SEC EDGAR · Tier 1: company or exchange filing · Jul 29, 2026
- S18Q1 FY2026 earnings release (8-K Ex. 99.1) · SEC EDGAR · Tier 1: company or exchange filing · Apr 22, 2026
- S19Q4 FY2025 earnings release (8-K Ex. 99.1) · SEC EDGAR · Tier 1: company or exchange filing · Feb 4, 2026
- S20Q3 FY2025 earnings release (8-K Ex. 99.1) · SEC EDGAR · Tier 1: company or exchange filing · Oct 22, 2025
- S21Q2 FY2025 earnings release (8-K Ex. 99.1) · SEC EDGAR · Tier 1: company or exchange filing · Jul 23, 2025
- S22Q1 FY2025 earnings release (8-K Ex. 99.1) · SEC EDGAR · Tier 1: company or exchange filing · Apr 23, 2025
- S23Q4 FY2024 earnings release (8-K Ex. 99.1) · SEC EDGAR · Tier 1: company or exchange filing · Feb 5, 2025
Changes to this page (v1 · Nov 20, 2026)
- v1 · Nov 20, 2026First version. (first version)
Numbers come only from tier 1 and tier 2 sources. Read how we research.
Disclaimer
For learning only. Cityfort is not a registered investment adviser or broker-dealer and does not recommend buying or selling any security. Prices shown are dated and may be out of date.
Investing in securities involves risk, including loss of capital. Before making any investment decision, do your own research and consider consulting a registered investment adviser or other qualified professional.
Cityfort, its owners and contributors may or may not hold securities of companies covered. Cityfort is not paid by any company it covers. Content is not an offer or solicitation to buy or sell any security, including in any initial public offering.
Read the positions policyRead the full disclaimerHide the full disclaimer
Cityfort publishes general educational content that explains how listed companies work. Cityfort is not registered with the US Securities and Exchange Commission or any state securities regulator as an investment adviser, and is not a broker-dealer or a member of FINRA. Cityfort does not provide investment, tax or legal advice, recommendations, ratings, price targets or any opinion on whether to buy, sell or hold any security. Nothing on the site is tailored to any person's circumstances.
All information is taken from publicly available sources, mainly company filings with the SEC, which are listed on each page with dates. We work to keep it accurate and correct errors publicly, but we do not guarantee that it is complete, accurate or up to date. Any market price or price-based ratio shown is dated, may be out of date by the time you read it, and is included only to explain concepts.
Statements by company management, including forward-looking statements and guidance, are reported as the company's statements, with their date and source; they are not our forecasts. Adjusted (non-GAAP) figures are the company's own measures and are shown next to the official (GAAP) figures.