Utilities · NASDAQ: AEP
American Electric Power: how the business works
American Electric Power owns regulated utilities that deliver electricity to about 5.6 million customers in 11 US states, with FY2025 revenue of $21,876 million.
By Hardik Bhandare · Checked against filings: . Editorial policy. Corrections
Follow American Electric Power
Email me when American Electric Power's page is updated after earnings.
We'll send a confirmation email first. See our privacy policy.
American Electric Power Company, Inc. · Columbus, Ohio · Founded 1906
Updated for Q3 FY2026 · checked
- Revenue, FY2025
- $21.9B
- Net income for AEP common shareholders, FY2025
- $3.6B
- Customers in 11 states (about)
- 5.6 million
- Employees, Dec 31, 2025
- 17,581
- Total debt, Sep 30, 2026
- $54.4B
The short version
American Electric Power in 5 points
1 · What it sells
AEP sells and delivers electricity to about 5.6 million customers in 11 US states, from about 25,000 MW of regulated plants and about 38,000 circuit miles of transmission lines.
2 · Who pays it
In FY2025, homes paid 35.4% of AEP's revenue, businesses 21.5%, industry 14.9%, retail, trading and marketing customers 11%, transmission users 7.3%, wholesale buyers 5.6% and other items 4.4%.
3 · What it keeps from $100
Of every $100 that came in during FY2025, AEP kept $15.98 for common shareholders; that includes a $480 million benefit from a FERC tax-loss order covering 2021–2024, which AEP leaves out of its operating earnings of $3,190 million.
4 · Where the operating profit comes from
In FY2025, Vertically Integrated Utilities earned $1,605 million for AEP common, AEP Transmission Holdco $1,161 million, Transmission and Distribution Utilities $816 million and Generation and Marketing $287 million, while Corporate and Other lost $289 million.
5 · The one thing to watch
Construction spending reached $9,107 million in the first nine months of 2026, up from $6,001 million a year earlier, while total debt rose from $48,830 million at Dec 31, 2025 to $54,416 million on Sep 30, 2026.
Sources: From AEP's FY2025 10-K, Q3 FY2026 10-Q and earnings releases · checked
01Where the money goes · FY2025
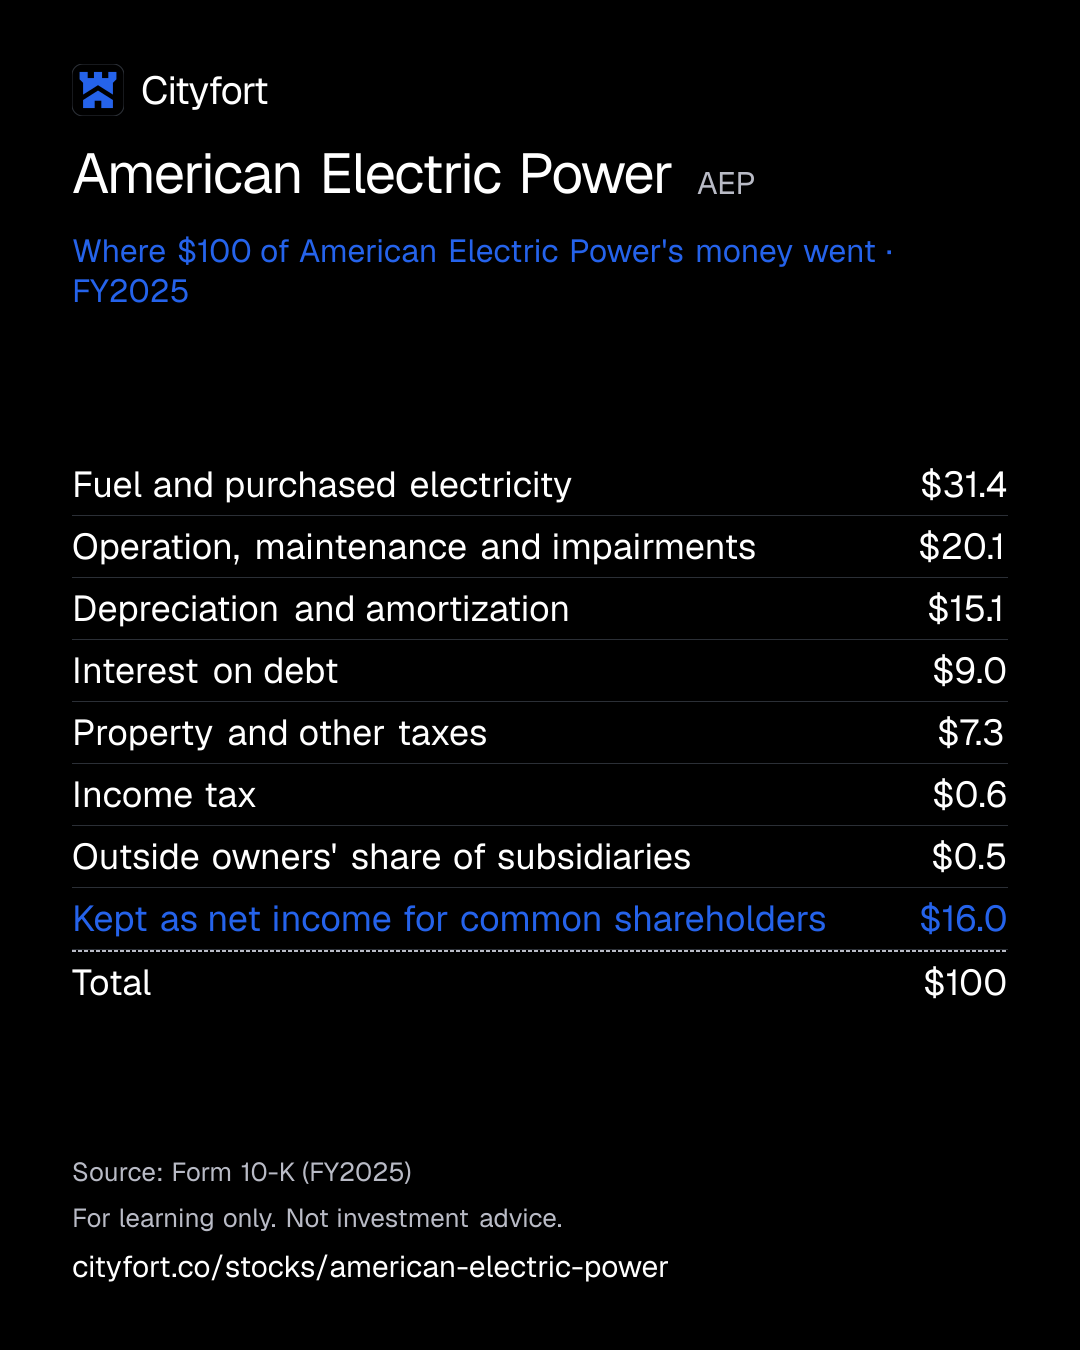
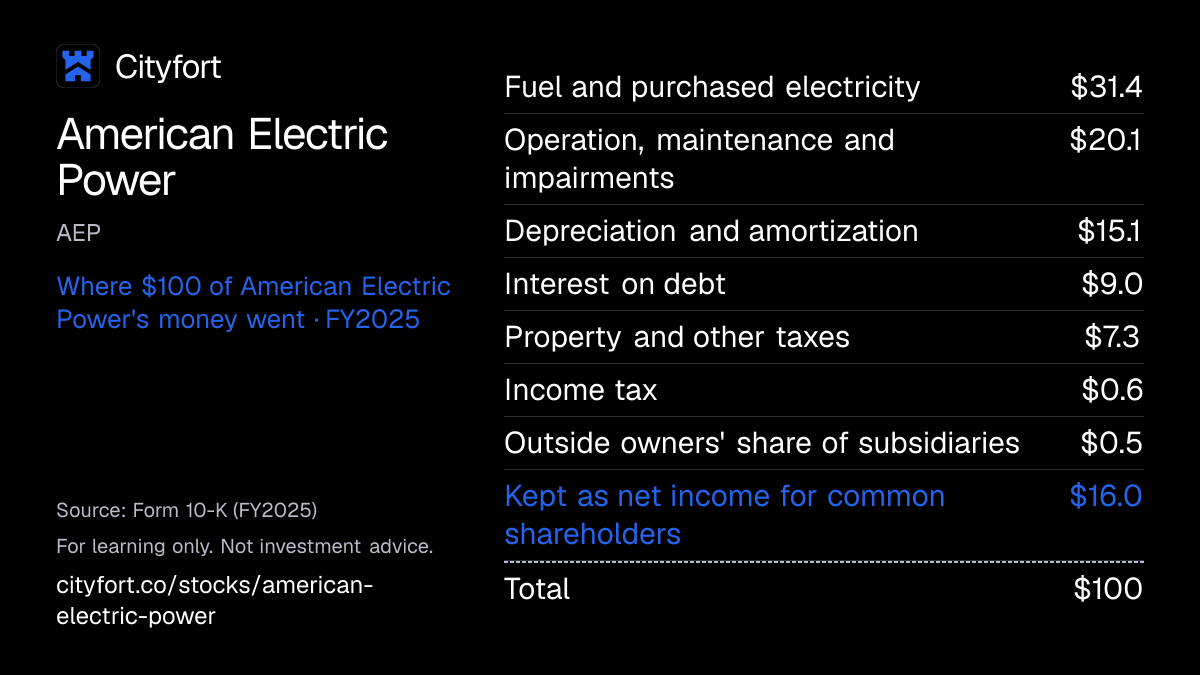
Where does $100 of American Electric Power's money go?
American Electric Power · FY2025
Receipt for every $100
| Fuel and purchased electricity | $31.4 |
|---|---|
| Operation, maintenance and impairments | $20.1 |
| Depreciation and amortization | $15.1 |
| Interest on debt | $9.0 |
| Property and other taxes | $7.3 |
| Income tax | $0.6 |
| Outside owners' share of subsidiaries | $0.5 |
| Kept as net income for common shareholders | $16.0 |
| Total | $100 |
Each line = amount ÷ total money in × 100. Lines may not add to exactly $100 because of rounding.
How this is worked out
Cityfort calculation from the FY2025 10-K. Of every $100 that came in during FY2025 (revenue $21,876 million + other income items $532 million = $22,408 million), each line = line ÷ $22,408 million × 100. Other income items are other income $48 million, equity funds used during construction $245 million, pension credits $138 million and earnings of part-owned companies $101 million.
Save this receipt as an image
Embed this receipt or the key numbers
Paste this code into a blog or website to show the card you choose, with a link back to this page.
Each week: the next company due to report earnings, explained in 5 points.
No tips. Unsubscribe anytime.
We'll send a confirmation email. See our privacy policy.
02The business in one line
What does American Electric Power do?
Homes and businesses in 11 states pay AEP's utilities prices set by regulators for electricity and the use of its lines. After fuel, upkeep, plant wear and interest, $15.98 of every $100 that came in during FY2025 was left for AEP common shareholders.
- Homes paid 35.4% of FY2025 revenue and businesses 21.5%, at rates approved by state commissions and FERC.
- Construction spending of $8,453 million in FY2025 was more than operating cash flow of $6,944 million, so AEP borrows and sells new shares to build.
03Who pays it
Who pays American Electric Power?
Homes (residential)
35.4%
of revenue
$7,754 million of FY2025 revenue, 35.4% of the $21,876 million total. Electricity bills of households in AEP's regulated areas.
Businesses (commercial)
21.5%
of revenue
$4,694 million, 21.5% of FY2025 revenue: offices, shops and other businesses, up from $4,298 million in FY2024.
Factories and industry
14.9%
of revenue
$3,250 million, 14.9% of FY2025 revenue. The 10-K lists chemical makers, oil and gas producers, pipelines and metal makers among the industries served.
Retail, trading and marketing customers
11%
of revenue
$2,397 million, 11% of FY2025 revenue, which the 10-K labels retail, trading and marketing revenue.
Users of its transmission lines
7.3%
of revenue
$1,603 million, 7.3% of FY2025 revenue: transmission revenue for the use of AEP's high-voltage network.
Wholesale buyers of power
5.6%
of revenue
$1,220 million, 5.6% of FY2025 revenue: other utilities, rural cooperatives and towns that buy power from AEP plants.
- Homes (residential)35.4%
- Businesses (commercial)21.5%
- Factories and industry14.9%
- Retail, trading and marketing customers11%
- Users of its transmission lines7.3%
- Wholesale buyers of power5.6%
How spread out the customers are
The FY2025 10-K names no single customer with a share of AEP's revenue. In AEP Texas, which bills retail electric providers rather than households, the two largest providers paid 38% of AEP Texas' 2025 operating revenue. Other retail revenue ($302 million) and other items ($656 million) make up the rest of FY2025 revenue.
Sources (1)
04How it makes money
How does American Electric Power make money?
Regulators set prices that cover AEP's costs plus an allowed return on what it invests. Profit grows as the base of plants and lines grows.
The FY2025 10-K lists allowed returns on equity of 9.25% to 10.50% across its states and FERC. Construction spending rose from $5,659.6 million in FY2021 to $8,453 million in FY2025, and EBITDAOperating profit before wear-and-tear charges (depreciation and amortization). As a margin: per $100 of sales. from $6,237 million to $8,699 million.
EBITDA, US$ million
$6,237$8,699
FY2021 to FY2025
- AEP builds plants, transmission lines and local wires
- It asks state commissions and FERC to include that spending in the base its rates are set on
- Approved rates cover costs plus an allowed return on that base
- Customers pay the rates, and earnings rise as the base grows
- Earnings, new debt and share sales fund the next round of building and the dividend
↺ Step 5 feeds back into step 1.
05Business segments · FY2025
Which businesses make up American Electric Power?
Vertically Integrated Utilities
57.4%Utilities that generate, transmit and deliver power in their states (Appalachian Power, Indiana Michigan Power, PSO, SWEPCO and others). FY2025 earnings for AEP common: $1,605 million.
Revenue $12.6B ($12,556M)
Transmission and Distribution Utilities
27.9%AEP Ohio and AEP Texas, which deliver power but do not generate it for their retail customers. FY2025 earnings: $816 million.
Revenue $6.1B ($6,097M)
Generation and Marketing
12.3%Unregulated trading, retail supply and power plants in wholesale markets. FY2025 earnings: $287 million.
Revenue $2.7B ($2,697M)
AEP Transmission Holdco
2.3%High-voltage lines at FERC-approved rates; $1,884 million more of its revenue came from other AEP segments and is not counted here. FY2025 earnings: $1,161 million, including $354 million from a FERC order on net operating loss carryforwards for 2021–2024 (FY2025 release).
Revenue $493M
Corporate and Other
0.2%Holding company and other items. FY2025 result: a loss of $289 million.
Revenue $33M
How the mix changed
- Vertically Integrated Utilities
- Transmission and Distribution Utilities
- Generation and Marketing
- AEP Transmission Holdco
- Corporate and Other
Revenue by segment, FY2023 to FY2025.
US$
See the numbers
06The numbers · Consolidated · US$
How has American Electric Power done?
Revenue
$21.9BFY2025
Revenue rose from $16,792 million in FY2021 to $21,876 million in FY2025, with a dip in FY2023.
US$
See the numbers
Net income
$3.6BFY2025
Net income for AEP common shareholders fell in FY2022 and FY2023, then rose to $3,580 million in FY2025.
US$
See the numbers
Net income for every $100 of revenue
$16.4FY2025
AEP kept $16.37 of net income per $100 of revenue in FY2025, up from $11.63 in FY2023.
Net margin: $ of net income per $100 of revenue
See the numbers
Free cash flow
−$1.5BFY2025
Construction spending was larger than operating cash flow in every year from FY2021 to FY2025, and free cash flow was negative in all five years.
US$ · cash from operations minus spending on plants and equipment
See the numbers
See all yearly numbers
EBITDA here = operating income plus depreciation and amortization (from the cash flow statement). Fiscal years are the company's own: Fiscal year is the calendar year, ending Dec 31. Net income is the share belonging to the company's owners. Total net income differs from net profit to the company's owners: Net income for AEP common shareholders deducts $116 million for noncontrolling interests, mainly KKR and PSP Investments' 19.9% stake in two transmission companies from June 2025.
Learn: Fiscal years that don't end in December: Nvidia's FY2027 explained · Stock-based compensation and dilution: pay that becomes shares
Sources (21)
- Form 10-K for FY2021
- Form 10-K for FY2022
- Form 10-K for FY2023
- Form 10-K for FY2025
- Form 10-K for FY2024
- Form 10-Q for Q2 FY2023
- Q4 FY2024 earnings release (8-K Ex. 99.1)
- Form 10-Q for Q1 FY2024
- Q1 FY2025 earnings release (8-K Ex. 99.1)
- Form 10-Q for Q2 FY2024
- Q2 FY2025 earnings release (8-K Ex. 99.1)
- Form 10-Q for Q3 FY2024
- Q3 FY2025 earnings release (8-K Ex. 99.1)
- Form 10-Q for Q1 FY2025
- Form 10-Q for Q1 FY2026
- Form 10-Q for Q2 FY2025
- Form 10-Q for Q2 FY2026
- Form 10-Q for Q3 FY2025
- Form 10-Q for Q3 FY2026
- Q4 FY2025 earnings release (8-K Ex. 99.1)
- Q1 FY2026 earnings release (8-K Ex. 99.1)
07Who runs it
Who runs American Electric Power, and did they deliver?
William J. Fehrman
Chair, President and Chief Executive Officer · since 2024
CEO since August 2024 and Chair since August 2025; earlier CEO of Centuri Holdings (January–July 2024) and of Berkshire Hathaway Energy.
Trevor I. Mihalik
Executive Vice President and Chief Financial Officer · since 2025
CFO since January 2025; previously at Sempra.
Doug Cannon
President, AEP Transmission · since 2025
Since June 2025; formerly CEO of NV Energy.
Kelly J. Ferneau
Executive Vice President and Chief Nuclear Officer · since 2024
Since November 2024.
Rob Berntsen
Executive Vice President, General Counsel and Secretary · since 2025
Since July 2025.
What they said, and what happened
2 too early to tell · 1 delivered
Said on Feb 12, 2026
2026 operating earnings of $6.15 to $6.45 a share.
Too early to tellWhat happened
Raised to $6.25 to $6.55 on Jul 30, 2026. On Oct 28, 2026, AEP said it expects at or above the high end; operating EPS for the first nine months was $5.24.
Said on Jan 9, 2025
Sell a 19.9% stake in its Ohio and Indiana Michigan transmission companies to KKR and PSP Investments for $2.82 billion.
DeliveredWhat happened
AEP's Jun 5, 2025 release (8-K filed Jun 9) reported the sale completed, for $2.82 billion.
Said on Feb 12, 2026
About $12.2 billion of construction spending in 2026.
Too early to tellWhat happened
Construction spending was $9,107 million in the nine months to Sep 30, 2026.
Sources (7)
08What could go wrong
What could go wrong for American Electric Power?
- Regulation
Recovering what it spends
The FY2025 10-K names the risk that AEP may not recover the cost of its planned capital investment. In Q1 2026 SWEPCo recorded about $31 million for a probable, partial disallowance of the Pirkey Plant under a settlement of its 2025 Texas rate case that the PUCT had not approved by Sep 30, 2026 (Q3 FY2026 10-Q).
Watch Rate case decisions in Texas, West Virginia, Indiana and other states.
- Demand
Data center demand may not arrive
The FY2025 10-K says the capital plan depends on continued growth of data centers and other large users. The Q3 FY2026 10-Q says that demand may not materialize as expected.
Watch AEP's contracted new load figure (84 GW by 2031 as of Oct 28, 2026) in each release.
- Debt
Debt and credit ratings
Total debt reached $54,416 million on Sep 30, 2026. As of Mar 31, 2026, AEP's table showed Moody's FFOFunds from operations: a REIT's own measure that adds building depreciation back to net income. Not a GAAP figure; read it next to net income. to debt (yearly cash from operations as a share of debt) at 13.9%, close to the 13% downgrade threshold.
Watch FFO to debt against the 13% thresholds and any rating action on the Baa2 / BBB ratings.
- Other
Nuclear plant
Indiana Michigan Power owns and runs the 2,296 MW Cook nuclear plant, and the 10-K lists nuclear operation as a risk. Its licenses run to 2034 and 2037. The Q3 FY2026 10-Q says Indiana Michigan Power plans to ask in early 2027 to extend them to 2054 and 2057.
Watch The license extension filing and any unplanned outage at Cook.
- Concentration
Few payers in Texas
AEP Texas bills about 146 retail electric providers, and its two largest paid 38% of its 2025 operating revenue. A default by one could delay cash.
Watch Retail electric provider failures in Texas (ERCOT).
- Raw-material prices
Wholesale power markets
Generation and Marketing sells power in the PJM, ERCOT, MISO and SPP markets, where prices move with fuel and demand. The 10-K names this exposure as a risk.
Watch Generation and Marketing earnings ($96 million GAAP in Q3 FY2026).
- Technology
Cyber and physical attacks
The FY2025 10-K names cyber attacks, physical attacks and failures of information technology, including AI, as risks to its grid and plants.
Watch Any 8-K reporting a cyber incident.
09Supporters vs. critics
What do supporters and critics point to?
What supporters point to
- Dividends declared per share rose every year, from $3.00 in FY2021 to $3.74 in FY2025, and the 2026 proxy says October 2025 brought AEP's 462nd consecutive quarterly dividend.
- Net income for AEP common shareholders rose from $2,208 million in FY2023 to $3,580 million in FY2025, and EBITDA from $6,237 million in FY2021 to $8,699 million (Cityfort calculation from the FY2021 and FY2025 10-Ks).
- The FY2025 10-K says AEP's vertically integrated utilities face no competition from other such utilities in their territories, and lists allowed returns on equity of 9.25% to 10.50%.
- AEP said on Oct 28, 2026 that new load backed by signed agreements or letters of agreement reached 84 GW by 2031, up from 56 GW by 2030 on Feb 12, 2026.
- Commercial sales at the vertically integrated utilities were 8,475 million kWh in Q3 FY2026, up from 7,355 million a year earlier.
What critics point to
- Free cash flow was negative in every year from FY2021 to FY2025, at minus $1,509 million in FY2025 (Cityfort calculation from the FY2025 10-K).
- Total debt rose from $36,068.5 million at Dec 31, 2021 to $54,416 million on Sep 30, 2026, and interest cost $2,026 million in FY2025.
- AEP's own ratings table, as of Mar 31, 2026, put Moody's FFO to debt at 13.9%, against a 13% downgrade threshold.
- Forward sales of 22,549,020 new shares in March 2025 and 23,543,308 in May 2026, plus a $3.5 billion at-the-market program, can raise the share count.
- FY2025 GAAP earnings of $3,580 million include a $480 million benefit from a FERC order on tax losses for 2021–2024; AEP's operating earnings, which leave it out, were $3,190 million.
10What to watch next
What should you watch next at American Electric Power?
Next event
Q4 FY2026 results
Date not announced yet.
Spending against plan
AEP forecast about $12.2 billion of construction spending for 2026 in its FY2025 10-K (Feb 12, 2026); spending was $9,107 million in the nine months to Sep 30, 2026.
Debt and credit metrics
Total debt was $54,416 million on Sep 30, 2026. AEP's ratings table (as of Mar 31, 2026) put Moody's FFO to debt at 13.9% and S&P's at 14.7%, against 13% downgrade thresholds.
Contracted new load
AEP said on Oct 28, 2026 that contracted new load reached 84 GW by 2031. The Q3 FY2026 10-Q says demand from data centers and other large users may not materialize as expected.
Cook nuclear licenses
The Q3 FY2026 10-Q says Indiana Michigan Power plans to ask in early 2027 to extend the 2,296 MW Cook plant's licenses from 2034 and 2037 to 2054 and 2057.
11Key facts
Key facts about American Electric Power
- What does American Electric Power do?
- American Electric Power (AEP) owns electric utilities that deliver power to about 5.6 million customers in 11 US states, according to its Q3 FY2026 release. At Dec 31, 2025, AEP owned about 25,000 MW of regulated power plants and about 38,000 circuit miles of transmission lines.
- How does American Electric Power make money?
- American Electric Power charges prices approved by state commissions and FERC. These cover its costs plus an allowed return on what it invests, and the FY2025 10-K lists allowed returns on equity of 9.25% to 10.50%. AEP's FY2025 revenue was $21,876 million, of which the Vertically Integrated Utilities segment brought in $12,556 million.
- Is American Electric Power profitable?
- Yes. American Electric Power's FY2025 net income for common shareholders was $3,580 million, or $6.66 per diluted share, up from $2,967 million ($5.58) in FY2024. In Q3 FY2026, AEP's net income for common shareholders was $1,187 million, up from $972 million in Q3 FY2025.
- Who are American Electric Power's customers?
- In FY2025, homes paid American Electric Power 35.4% of revenue, businesses 21.5%, factories and industry 14.9%, retail, trading and marketing customers 11%, users of its transmission lines 7.3% and wholesale buyers 5.6%. Other retail revenue and other items made up the remaining 4.4% ($958 million). Shares are a Cityfort calculation from the FY2025 10-K.
- What are American Electric Power's segments?
- American Electric Power reports five segments. In FY2025, revenue from outside customers was $12,556 million for Vertically Integrated Utilities, $6,097 million for Transmission and Distribution Utilities (AEP Ohio and AEP Texas), $2,697 million for Generation and Marketing, $493 million for AEP Transmission Holdco and $33 million for Corporate and Other.
- Who owns American Electric Power?
- American Electric Power has one class of common stock, with 544,526,330 shares outstanding on Oct 28, 2026. AEP's 2026 proxy statementThe yearly filing about shareholder votes, the board and executive pay. Learn more lists Vanguard with 9.06%, BlackRock with 7.41% and State Street with 5.19%, from 13G filings of 2024 and 2025. AEP's directors and executive officers as a group held about 0.05% on Feb 27, 2026 (Cityfort calculation from the 2026 proxy statement).
- How much debt does American Electric Power have?
- American Electric Power had total debt of $54,416 million and cash of $418 million on Sep 30, 2026, up from debt of $48,830 million at Dec 31, 2025, as stated in AEP's Q3 FY2026 10-Q. AEP's interest expense was $2,026 million in FY2025.
- Does American Electric Power have free cash flow?
- No. American Electric Power's free cash flowCash from operations minus spending on buildings and equipment. Learn more, operating cash flow minus construction spending, was negative in each of FY2021, FY2022, FY2023, FY2024 and FY2025. In FY2025 it was minus $1,509 million: $6,944 million of operating cash flow against $8,453 million of construction spending (Cityfort calculation from the FY2021 to FY2025 10-Ks).
- Does American Electric Power pay a dividend?
- Yes. American Electric Power declared dividends per share of $3.00 in FY2021, $3.17 in FY2022, $3.37 in FY2023, $3.57 in FY2024 and $3.74 in FY2025. AEP's board declared a quarterly dividend of $0.97 per share in October 2026, and the 2026 proxy says October 2025 brought AEP's 462nd consecutive quarterly dividend.
Terms on this page
- Capital expenditures (capex)
- Debt-to-equity
- Dividend payout ratio
- Earnings per share (EPS)
- EBITDA
- Free cash flow
- Interest coverage
- Net debt
- Net margin
- Revenue vs net income
Each explains the term in plain English, with the same number from other companies on Cityfort.
Go deeper
More detail from the same filings. Open any section.
12What it sells
12What it sells
What does American Electric Power sell?
Electricity from its own plants (8 utilities)
In states such as Virginia, West Virginia, Indiana, Oklahoma, Louisiana and Arkansas, AEP utilities generate the power and deliver it. This Vertically Integrated Utilities segment brought in $12,556 million in FY2025.
Delivery only in Ohio and Texas
AEP Ohio and AEP Texas run the wires and charge for delivering power that customers buy from other suppliers. This segment brought in $6,097 million in FY2025.
High-voltage transmission
AEP Transmission Holdco builds and owns long-distance power lines at rates approved by FERC (the federal energy regulator). Most of its revenue comes from other AEP utilities.
Generation and Marketing
Unregulated power trading, risk management and retail electricity sales in the ERCOT, MISO, PJM and SPP markets, plus power plants in PJM. It brought in $2,697 million in FY2025.
Think of it like this
A regulated utility works a bit like a toll road whose toll is set by a regulator. It earns an allowed return on what it builds.
What it does
- Does: Owns about 25,000 MW of regulated power plants at Dec 31, 2025, including coal, gas, nuclear and renewables
- Does: Runs about 38,000 circuit miles of transmission lines and 252,000 circuit miles of distribution lines
- Does: Sells and delivers power to about 5.6 million customers (Q3 FY2026 release)
What it does not do
- Does not: Set its own prices in its regulated utilities: state commissions and FERC approve rates
- Does not: Sell electricity outside its 11-state footprint, except through Generation and Marketing
- Does not: Generate the power it delivers in Ohio and Texas, where customers choose their supplier
Sources (1)
13How the money flows
13How the money flows · FY2025
How does money flow through American Electric Power?
Money in
- Revenue from electricity sales, delivery and trading$21.9B
- Other income, equity funds used during construction, pension credits and earnings of part-owned companies$532M
The company
American Electric Power
$22.4B came in
Money out
- Fuel and purchased electricity$7.0B
- Operation, maintenance and impairments$4.5B
- Depreciation and amortization$3.4B
- Interest on debt$2.0B
- Property and other taxes, and income tax$1.8B
- Outside owners' share of subsidiaries$116M
- Net income for AEP common shareholders$3.6B
- Homes, businesses and other utilities pay AEP for electricity and for using its lines.
- The biggest cost is fuel and power bought from others: $7,031 million in FY2025.
- Running and fixing the network, plant wear and taxes take another $9,655 million.
- Interest on $48,830 million of year-end debt cost $2,026 million.
- What is left, $3,580 million, belongs to AEP common shareholders; most went out as $2,008 million of dividends.
Sources (1)
14What it needs to run
14What it needs to run
What does American Electric Power need to run?
Power plants
About 25,000 MW of regulated owned capacity at Dec 31, 2025. In 2025 the vertically integrated utilities made 43% of their power from coal and lignite, 22% from gas, 19% from nuclear and 16% from renewables.
Fuel
About 19 million tons of coal delivered in 2025 at $54.86 a ton, and about 164 billion cubic feet of natural gas burned.
Wires
About 38,000 circuit miles of transmission lines, including about 2,000 miles at 765 kilovolts, and about 252,000 circuit miles of distribution lines.
Regulatory approval
Prices need approval from commissions in 11 states and from FERC. Allowed returns on equity in the FY2025 10-K range from 9.25% to 10.50%.
People
17,581 employees at the subsidiaries on Dec 31, 2025, about 24% of them in labor unions.
Borrowed and new equity money
Construction spending of $8,453 million in FY2025 was more than operating cash flow of $6,944 million. AEP borrows and sells new shares to fund the gap.
Sources (1)
15Where growth could come from
15Where growth could come from
Where could American Electric Power's growth come from?
On Oct 28, 2026, AEP said it expects 2026 operating earnings per share (its non-GAAPThe company's own "adjusted" numbers, not the official (GAAP) ones. Always read them next to the official figure. Learn more measure) at or above the high end of $6.25 to $6.55. It announced a $100 billion capital plan for 2027 to 2031. It said it expects operating EPS to grow 9% to 11% a year over that period.
Large new electricity users
Working84 GW of contracted new load by 2031 (company figure, Oct 28, 2026)
AEP's count of new load backed by signed agreements or letters of agreement rose from 56 GW by 2030 (Feb 12, 2026) to 84 GW by 2031 (Oct 28, 2026). Commercial sales at the vertically integrated utilities were 8,475 million kWh in Q3 FY2026, up from 7,355 million.
Status: Working, on track against what the company said.
Transmission building
NewAbout $37 billion planned for 2027–2031 (company, Oct 28, 2026)
AEP said on Oct 28, 2026 that about $37 billion of the $100 billion plan is for transmission. It said it expects transmission rate base to reach about $70 billion by 2031.
Status: New, recently announced.
New gas-fired plants
EarlyAbout 13 GW of gas turbine capacity secured (company, Jul 30, 2026)
AEP said on Jul 30, 2026 it had secured about 13 GW of gas turbine capacity. Indiana Michigan Power has applied to the Indiana commission to build the 1,520 MW Rockport Energy Center, a gas plant (Q3 FY2026 10-Q).
Status: Early, too early to judge.
Bigger capital plan
Working$72 billion → $100 billion five-year plan (company)
AEP raised its five-year plan from $72 billion for 2026–2030 (Feb 12, 2026) to $78 billion (May 5, 2026), then to $100 billion for 2027–2031 (Oct 28, 2026). Construction spending was $9,107 million in the first nine months of 2026, up from $6,001 million.
Status: Working, on track against what the company said.
Status compares progress with what the company itself said it would do: Working = on track against what the company said; Mixed = partly on track; Behind = behind the company's own plan; New = recently announced; Early = too early to judge.
16The company's own measures (non-GAAP)
16The company's own measures · FY2025
What do American Electric Power's own measures show?
Official (GAAP): GAAP EPS (basic), FY2025
$6.70
Company's own measure: Operating EPS, FY2025
$5.97
AEP's operating earnings leave out items it classes as non-operating; in FY2025 the largest item was a $480 million benefit from a FERC order on net operating loss carryforwards for 2021–2024. Diluted GAAP EPS was $6.66.
Official (GAAP): Earnings for AEP common shareholders, FY2025
$3.6B
Company's own measure: Operating earnings, FY2025
$3.2B
The FY2025 release reconciles the two at the end; FY2024 operating earnings were $2,978 million against GAAP earnings of $2,967 million.
Official (GAAP): GAAP EPS (basic), Q3 FY2026
$2.18
Company's own measure: Operating EPS, Q3 FY2026
$2.23
For the first nine months of 2026, operating EPS was $5.24 and GAAP EPS $5.10.
These are the company's own measures, defined by the company. They are not comparable across companies, and they are not added together. Each sits beside the nearest official (GAAP) figure.
Learn: Non-GAAP measures: what a company's "adjusted" numbers leave out
17Financial strength and debt
17Financial strength · Sep 30, 2026
How much debt does American Electric Power have?
- Total debt$54.4B
- Cash and investments$418M
- Net debt (debt minus cash)$54.0B
- Net worth (shareholders' money)$32.8B
- Debt to equity
- 1.66×
- $ of debt for every $1 of shareholders' money
- Interest cover
- 2.6×
- how many times operating profit covers interest
- Net debt of $53,998 million = total debt of $54,416 million (short-term debt $1,875 million, long-term debt due within one year $2,677 million and long-term debt $49,864 million) minus cash of $418 million (Cityfort calculation from the Q3 FY2026 10-Q).
- Total debt on the same basis was $36,068.5 million at Dec 31, 2021 and $48,830 million at Dec 31, 2025 (Cityfort calculation from the FY2021 and FY2025 10-Ks).
- Debt to equity of 1.66 uses AEP common shareholders' equity of $32,775 million; total equity including noncontrolling interests was $34,043 million (Cityfort calculation from the Q3 FY2026 10-Q).
- Interest coverage of 2.63 = FY2025 operating income of $5,319 million ÷ interest expense of $2,026 million (Cityfort calculation from the FY2025 10-K).
- The Q3 FY2026 10-Q states debt to total capitalization of 56.0% at Sep 30, 2026 as defined in its credit agreements, against a 67.5% limit.
- AEP's own ratings table (as of Mar 31, 2026) shows Moody's FFO to debt at 13.9% and S&P's at 14.7%, against downgrade thresholds of 13%.
- EBITDA = operating income + depreciation and amortization; free cash flow = operating cash flow − construction expenditures, which leaves out $3,453 million spent buying power plants in FY2025 (Cityfort calculation from the FY2025, FY2023, FY2022 and FY2021 10-Ks).
- Quarterly EBITDA uses each 10-Q's three-month operating income and depreciation and amortization. The Q4 rows come from the earnings releases, which give revenue and net income but no full income statement, so Q4 EBITDA and diluted EPS are left blank.
18Who owns it
18Who owns it · ownership as of Mar 2, 2026
Who owns American Electric Power?
- Officers and directors (as a group), shares
- 0.1%
Share classes
Holders of 5% or more
From the company's proxy statement (DEF 14A), later Schedule 13G filings and the share counts on its latest annual or quarterly report. Each holder row shows the date of its own filing.
Learn: How to read a proxy statement (DEF 14A): Nvidia's 2026 proxy · Form 4 insider filings: who files, the codes and the footnotes
19What it does with profit
19What it does with profit
What does American Electric Power do with its profit?
Dividend per share
$3.74FY2025
Dividend paid for each share, by financial year.
$ per share
See the numbers
Money raised · Mar 27, 2025
Forward sale agreements on 22,549,020 new shares, including the underwriters' option, at an initial forward price of $99.756 a share.
Money raised · Jun 5, 2025
Sale of a 19.9% stake in its Ohio and Indiana Michigan transmission companies to KKR and PSP Investments, completed for $2.82 billion.
$2.8B
Money raised · May 14, 2026
Forward sale agreements on 23,543,308 new shares, including the underwriters' option, with BofA, Goldman Sachs and Morgan Stanley affiliates as forward purchasers.
20Governance signals
20Governance signals
What do American Electric Power's governance filings show?
- Auditor
- PricewaterhouseCoopers LLP, since 2017
- Auditor changes
- None in the period covered
- Audit qualifications
- None reported
- Related-party dealings
- The 2026 proxy describes a Related Person Transaction Approval Policy, run by the board's Governance Committee. It covers deals above $120,000 with directors, officers, 5% holders or their families. This page does not list individual transactions.
- Credit rating
- Moody's, S&P Global Ratings and Fitch (as listed in AEP's own ratings table as of Mar 31, 2026) Baa2 (Moody's) / BBB (S&P) / BBB (Fitch), senior unsecured, American Electric Power Company, Inc. (outlook Stable at all three), Mar 31, 2026
A credit rating describes the company's ability to repay debt. It is not a rating of the share.
Flags to know about
regulatory · Oct 28, 2026
Rate case disallowances in 2026
The Q3 FY2026 10-Q says SWEPCo recorded about $31 million in Q1 2026 for a probable, partial disallowance of the Pirkey Plant's book value, after a settlement in principle in the 2025 Texas base rate case; the settlement filed in September 2026 awaits PUCT approval. The Q3 FY2026 release also leaves a partial disallowance under the Unified Tracker Mechanism out of operating earnings.
regulatory
Customer appeals in West Virginia
The Q3 FY2026 10-Q says groups of Appalachian Power customers appealed to the West Virginia Supreme Court. They allege the state commission erred in two April 2026 rate orders.
other · Dec 22, 2025
Agreement with the Icahn Group
AEP signed a Board Observer Agreement with the Icahn Group and Andrew J. Teno. It ended an earlier director appointment agreement, and Hunter C. Gary was not nominated for the 2026 annual meeting.
other · Oct 23, 2026
Executive departure settlement
Alicia Knapp, former President Nuclear Development, left AEP. A settlement agreement pays her $4,342,662 before withholding, in place of severance plan benefits.
other
Ways the share count can rise
The Q3 FY2026 10-Q says 6 million shares sat under at-the-market forward agreements at Sep 30, 2026, which AEP said it expects to bring in $684 million. These follow forward share sales in March 2025 and May 2026.
disclosure
What this page could not use
This page has no earnings call transcripts or investor slides. The 5% holder figures in the proxy rest on Schedule 13GA filing by anyone who owns more than 5% of a company's shares and does not seek control. Learn more filings from 2024 and 2025.
21How it got here
21How it got here
How did American Electric Power get here?
1906
Milestone
Incorporated in New York
AEP was incorporated in 1906 and reorganized in 1925 as a holding company that owns its utility subsidiaries.
2023
Business-model change
Sold its contracted renewables
AEP sold its Competitive Contracted Renewables portfolio in 2023, booking a $93 million loss.
2024
Milestone
New chief executive
William J. Fehrman, formerly CEO of Berkshire Hathaway Energy, became CEO in August 2024 and Chair in August 2025.
2025
Business-model change
Sold part of two transmission companies
KKR and PSP Investments bought 19.9% of AEP's Ohio and Indiana Michigan transmission companies for $2.82 billion, completed in June 2025.
2025
Milestone
Bought 2.2 GW of power plants
AEP acquired 2.2 GW of generation in 2025, including the 904 MW Green Country gas plant for PSO on Jun 30, 2025; plant purchases cost $3,453 million.
2026
Business-model change
$100 billion capital plan
On Oct 28, 2026, AEP announced a $100 billion plan for 2027–2031. The same release put contracted new load at 84 GW by 2031.
22Sources and changes
Where every number on this page comes from
Sources (29 documents)
- S1Form 10-Q for Q1 FY2026 · SEC EDGAR · Tier 1: company or exchange filing · May 5, 2026
- S2Form 10-K for FY2025 · SEC EDGAR · Tier 1: company or exchange filing · Feb 12, 2026
- S3Form 10-Q for Q3 FY2025 · SEC EDGAR · Tier 1: company or exchange filing · Oct 29, 2025
- S4Form 10-Q for Q2 FY2025 · SEC EDGAR · Tier 1: company or exchange filing · Jul 30, 2025
- S5Form 10-Q for Q1 FY2025 · SEC EDGAR · Tier 1: company or exchange filing · May 6, 2025
- S6Form 10-K for FY2024 · SEC EDGAR · Tier 1: company or exchange filing · Feb 13, 2025
- S7Form 10-Q for Q3 FY2024 · SEC EDGAR · Tier 1: company or exchange filing · Nov 6, 2024
- S8Form 10-Q for Q2 FY2024 · SEC EDGAR · Tier 1: company or exchange filing · Jul 30, 2024
- S9Form 10-Q for Q1 FY2024 · SEC EDGAR · Tier 1: company or exchange filing · Apr 30, 2024
- S10Form 10-K for FY2023 · SEC EDGAR · Tier 1: company or exchange filing · Feb 26, 2024
- S12Form 10-Q for Q2 FY2023 · SEC EDGAR · Tier 1: company or exchange filing · Jul 27, 2023
- S13Form 10-K for FY2022 · SEC EDGAR · Tier 1: company or exchange filing · Feb 23, 2023
- S14Form 10-K for FY2021 · SEC EDGAR · Tier 1: company or exchange filing · Feb 24, 2022
- S15Form 10-Q for Q2 FY2026 · SEC EDGAR · Tier 1: company or exchange filing · Jul 30, 2026
- S16Form 10-Q for Q3 FY2026 · SEC EDGAR · Tier 1: company or exchange filing · Oct 28, 2026
- S172026 proxy statement (DEF 14A) · SEC EDGAR · Tier 1: company or exchange filing · Mar 18, 2026
- S18Q3 FY2026 earnings release (8-K Ex. 99.1) · SEC EDGAR · Tier 1: company or exchange filing · Oct 28, 2026
- S19Q2 FY2026 earnings release (8-K Ex. 99.1) · SEC EDGAR · Tier 1: company or exchange filing · Jul 30, 2026
- S20Q1 FY2026 earnings release (8-K Ex. 99.1) · SEC EDGAR · Tier 1: company or exchange filing · May 5, 2026
- S21Q4 FY2025 earnings release (8-K Ex. 99.1) · SEC EDGAR · Tier 1: company or exchange filing · Feb 12, 2026
- S22Q3 FY2025 earnings release (8-K Ex. 99.1) · SEC EDGAR · Tier 1: company or exchange filing · Oct 29, 2025
- S23Q2 FY2025 earnings release (8-K Ex. 99.1) · SEC EDGAR · Tier 1: company or exchange filing · Jul 30, 2025
- S24Q1 FY2025 earnings release (8-K Ex. 99.1) · SEC EDGAR · Tier 1: company or exchange filing · May 6, 2025
- S25Q4 FY2024 earnings release (8-K Ex. 99.1) · SEC EDGAR · Tier 1: company or exchange filing · Feb 13, 2025
- S268-K filed May 14, 2026 (forward sale agreements) · SEC EDGAR · Tier 1: company or exchange filing · May 14, 2026
- S278-K filed Mar 27, 2025 (forward sale agreements) · SEC EDGAR · Tier 1: company or exchange filing · Mar 27, 2025
- S288-K Ex. 99: Olympus transmission stake sale completed, Jun 9, 2025 · SEC EDGAR · Tier 1: company or exchange filing · Jun 9, 2025
- S298-K Ex. 99: Olympus transmission stake sale agreed, Jan 10, 2025 · SEC EDGAR · Tier 1: company or exchange filing · Jan 10, 2025
- S30AEP credit ratings and downgrade thresholds (as of Mar 31, 2026) · American Electric Power (investor relations) · Tier 1: company or exchange filing · Mar 31, 2026
Changes to this page (v1 · Nov 20, 2026)
- v1 · Nov 20, 2026First version. (first version)
Numbers come only from tier 1 and tier 2 sources. Read how we research.
Disclaimer
For learning only. Cityfort is not a registered investment adviser or broker-dealer and does not recommend buying or selling any security. Prices shown are dated and may be out of date.
Investing in securities involves risk, including loss of capital. Before making any investment decision, do your own research and consider consulting a registered investment adviser or other qualified professional.
Cityfort, its owners and contributors may or may not hold securities of companies covered. Cityfort is not paid by any company it covers. Content is not an offer or solicitation to buy or sell any security, including in any initial public offering.
Read the positions policyRead the full disclaimerHide the full disclaimer
Cityfort publishes general educational content that explains how listed companies work. Cityfort is not registered with the US Securities and Exchange Commission or any state securities regulator as an investment adviser, and is not a broker-dealer or a member of FINRA. Cityfort does not provide investment, tax or legal advice, recommendations, ratings, price targets or any opinion on whether to buy, sell or hold any security. Nothing on the site is tailored to any person's circumstances.
All information is taken from publicly available sources, mainly company filings with the SEC, which are listed on each page with dates. We work to keep it accurate and correct errors publicly, but we do not guarantee that it is complete, accurate or up to date. Any market price or price-based ratio shown is dated, may be out of date by the time you read it, and is included only to explain concepts.
Statements by company management, including forward-looking statements and guidance, are reported as the company's statements, with their date and source; they are not our forecasts. Adjusted (non-GAAP) figures are the company's own measures and are shown next to the official (GAAP) figures.