Industrials · NYSE: ITW
Illinois Tool Works: how the business works
Illinois Tool Works makes car parts, commercial dishwashers, welding machines, glues and fasteners for other businesses, with revenue of $16,044 million in FY2025.
By Hardik Bhandare · Checked against filings: . Editorial policy. Corrections
Follow Illinois Tool Works
Email me when Illinois Tool Works's page is updated after earnings.
We'll send a confirmation email first. See our privacy policy.
Illinois Tool Works Inc. · Glenview, Illinois · Founded 1912
Updated for Q3 FY2026 · checked
- Revenue, FY2025
- $16.0B
- Net income, FY2025
- $3.07B
- Divisions, Dec 31, 2025
- 88
- Employees, Dec 31, 2025
- About 43,000
- Directors and officers' stake, Mar 9, 2026
- 0.83%
The short version
Illinois Tool Works in 5 points
1 · What it sells
Illinois Tool Works makes car parts, food equipment, test machines, welding gear, adhesives, fasteners and packaging equipment through 88 divisions, with revenue of $16,044 million in FY2025.
2 · Who pays it
Customers in the United States paid 46.1% of FY2025 revenue, Europe, the Middle East and Africa 25.9%, Asia Pacific 19.2%, Canada and Mexico 6.8% and South America 2% (Cityfort calculation from the FY2025 10-K).
3 · What it keeps from $100
Of every $100 that came in during FY2025, ITW kept $19.06 as net income, with only $42 million of other income in the total; operating income was $26.3 per $100 of revenue (Cityfort calculation from the FY2025 10-K).
4 · Where the operating profit comes from
All seven segments earned between $493 million and $753 million of FY2025 operating income; Food Equipment earned the most, $753 million on $2,699 million of revenue, and Polymers & Fluids the least.
5 · The one thing to watch
On Feb 3, 2026 ITW said it expected all seven segments to grow organically (before currency moves and acquisitions) in FY2026; in Q3 FY2026 organic revenue fell in Automotive OEM (−2.1%), Construction Products (−0.8%) and Specialty Products (−1.2%).
Sources: From Illinois Tool Works' FY2025 10-K, its Q4 FY2025 and Q3 FY2026 earnings releases · checked
01Where the money goes · FY2025
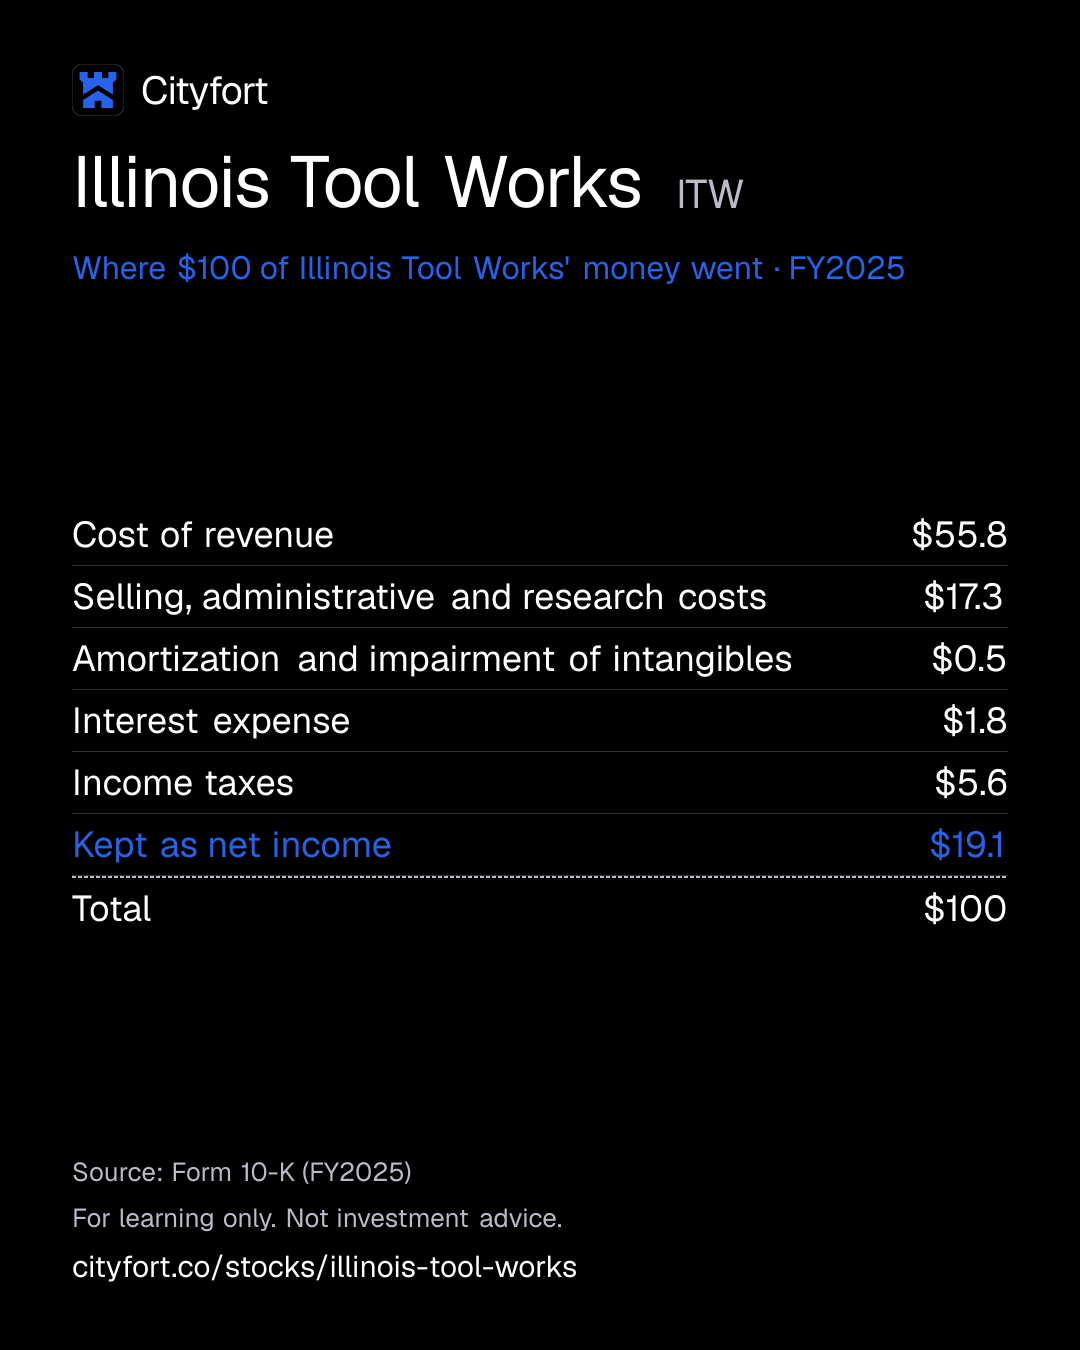
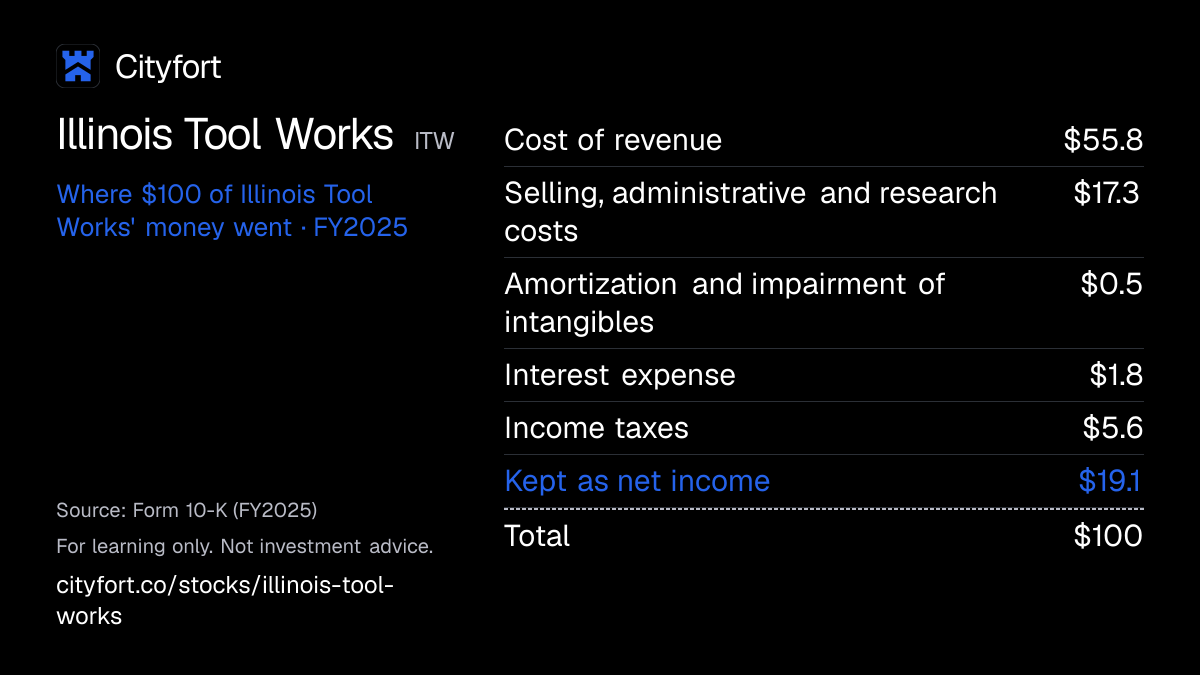
Where does $100 of Illinois Tool Works' money go?
Illinois Tool Works · FY2025
Receipt for every $100
| Cost of revenue | $55.8 |
|---|---|
| Selling, administrative and research costs | $17.3 |
| Amortization and impairment of intangibles | $0.5 |
| Interest expense | $1.8 |
| Income taxes | $5.6 |
| Kept as net income | $19.1 |
| Total | $100 |
Each line = amount ÷ total money in × 100. Lines may not add to exactly $100 because of rounding.
How this is worked out
Cityfort calculation from the FY2025 10-K. Of every $100 that came in during FY2025: each line = line ÷ $16,086 million × 100 (operating revenue $16,044 million + other income $42 million).
Save this receipt as an image
Embed this receipt or the key numbers
Paste this code into a blog or website to show the card you choose, with a link back to this page.
Each week: the next company due to report earnings, explained in 5 points.
No tips. Unsubscribe anytime.
We'll send a confirmation email. See our privacy policy.
02The business in one line
What does Illinois Tool Works do?
Factories, car makers, restaurants and builders pay ITW for parts, machines and supplies; making them took $55.75 of every $100 in FY2025, and $19.06 was left as net income.
- Customers in the US paid 46.1% of FY2025 revenue and customers elsewhere the rest (Cityfort calculation from the FY2025 10-K).
- Each of ITW's 88 divisions runs its own business, close to its customers.
- Operating income per $100 of revenue rose from $24.1 in FY2021 to $26.3 in FY2025 (operating margin as stated in the FY2021 and FY2025 10-Ks).
03Who pays it
Who pays Illinois Tool Works?
Car makers and their suppliers
20.5%
of revenue
Buy parts and fasteners from the Automotive OEM segment, which had $3,288 million of revenue in FY2025.
Industrial manufacturers
Share of revenue not disclosed
Buy directly from ITW divisions: test equipment, welding gear, adhesives, coding machines and other products.
Independent distributors and retailers
Share of revenue not disclosed
Resell ITW products such as fasteners, welding consumables and packaged hardware to trades and shoppers.
How spread out the customers are
The FY2025 10-K names no customer and does not give the share of revenue from its largest customers.
Sources (1)
04How it makes money
How does Illinois Tool Works make money?
ITW makes more money by focusing each small division on its biggest customers and products
ITW calls this its 80/20 Front-to-Back process: each division puts most effort into the customers and products that bring most of its revenue, and trims the rest. Operating income per $100 of revenue rose from $24.1 in FY2021 to $26.3 in FY2025 (Cityfort calculation from the FY2021 and FY2025 10-Ks). The company says its enterprise initiatives added 1.3 points to operating margin in both FY2024 and FY2025.
Operating income per $100 of revenue
$24.1$26.3
FY2021 to FY2025
- Each of 88 divisions studies which customers and products bring most of its sales
- It serves those best and drops low-value product lines
- It develops new products from what those customers ask for
- Costs fall through simpler lines and group-wide purchasing
- More of each $100 of revenue stays as operating income
- Cash pays dividends and buys back shares
↺ Step 6 feeds back into step 1.
05Business segments · FY2025
Which businesses make up Illinois Tool Works?
Automotive OEM
20.5%Parts and fasteners for car makers.
Revenue $3.3B ($3,288M) · Operating profit $693M
Food Equipment
16.8%Kitchen and food processing equipment and service.
Revenue $2.7B ($2,699M) · Operating profit $753M
Test & Measurement and Electronics
17.6%Testing machines and electronics assembly equipment.
Revenue $2.8B ($2,825M) · Operating profit $694M
Welding
11.8%Welding machines and consumables.
Revenue $1.9B ($1,890M) · Operating profit $621M
Polymers & Fluids
11%Adhesives, sealants, lubricants and car-care fluids.
Revenue $1.8B ($1,765M) · Operating profit $493M
Construction Products
11.3%Fasteners, tools and anchors for builders.
Revenue $1.8B ($1,820M) · Operating profit $550M
Specialty Products
11.1%Packaging, coding, appliance and other niche products.
Revenue $1.8B ($1,775M) · Operating profit $553M
How the mix changed
- Automotive OEM
- Food Equipment
- Test & Measurement and Electronics
- Welding
- Polymers & Fluids
- Construction Products
- Specialty Products
Revenue by segment, FY2021 to FY2025.
US$
See the numbers
06The numbers · Consolidated · US$
How has Illinois Tool Works done?
Revenue
$16.0BFY2025
Revenue was between $14.5 billion (FY2021) and $16.1 billion (FY2023) in each of the five years, and $16.0 billion in FY2025.
US$
See the numbers
Net income
$3.1BFY2025
Net income fell to $3.07 billion in FY2025 from $3.49 billion in FY2024, a year lifted by a $363 million pre-tax gain on selling the Wilsonart stake.
US$
See the numbers
Net income for every $100 of revenue
$19.1FY2025
EBITDA (profit before interest, tax, depreciation and amortization) was $28.8 per $100 of revenue in FY2025, up from $26.9 in FY2021; Q1 FY2024 includes a one-time $117 million accounting gain.
Net margin: $ of net income per $100 of revenue
See the numbers
Free cash flow
$2.7BFY2025
Free cash flow (cash from operations minus spending on plants and equipment) was $2.71 billion in FY2025, which the company states was 88% of net income.
US$ · cash from operations minus spending on plants and equipment
See the numbers
See all yearly numbers
EBITDA here = operating income plus depreciation and amortization (from the cash flow statement). Fiscal years are the company's own: Fiscal year ends Dec 31 (the calendar year); ITW calls Jan–Mar its first quarter. Net income is the share belonging to the company's owners.
Learn: Fiscal years that don't end in December: Nvidia's FY2027 explained · Stock-based compensation and dilution: pay that becomes shares
Sources (17)
- Form 10-K for FY2021
- Form 10-K for FY2022
- Form 10-K for FY2023
- Form 10-K for FY2024
- Form 10-K for FY2025
- Form 10-Q for Q1 FY2024
- Form 10-Q for Q2 FY2025
- Form 10-Q for Q1 FY2025
- Form 10-Q for Q2 FY2024
- Form 10-Q for Q3 FY2024
- Form 10-Q for Q3 FY2025
- Q4 and full-year FY2024 earnings release (8-K Ex. 99.1)
- Form 10-Q for Q1 FY2026
- Q4 and full-year FY2025 earnings release (8-K Ex. 99.1)
- Form 10-Q for Q2 FY2026
- Form 10-Q for Q3 FY2026
- Q3 FY2026 earnings release (8-K Ex. 99.1)
07Who runs it
Who runs Illinois Tool Works, and did they deliver?
Christopher A. O'Herlihy
President and Chief Executive Officer · since 2024
The FY2025 10-K lists him as Vice Chairman from 2015 to 2023, before he became CEO.
Michael M. Larsen
Senior Vice President and Chief Financial Officer · since 2013
Matteo C. Pigozzo
Vice President and Chief Accounting Officer · since 2026
Took over on Jul 1, 2026 from Randall J. Scheuneman, who held the role from 2009; joined ITW in 2006.
Christopher P. Rauch
Senior Vice President, General Counsel and Secretary · since 2025
E. Scott Santi
Non-Executive Chairman
Former ITW chief executive.
Richard H. Lenny
Independent Lead Director
What they said, and what happened
1 delivered · 4 too early to tell
Said on Feb 5, 2025
Initial guidance for FY2025 GAAP earnings per share of $10.15 to $10.55.
DeliveredWhat happened
FY2025 GAAP EPS was $10.49.
Said on Feb 3, 2026
Initial guidance for FY2026 GAAP earnings per share of $11.00 to $11.40.
Too early to tellWhat happened
Raised three times, to $11.45 to $11.55 on Oct 27, 2026; the full year is not yet reported.
Said on Feb 3, 2026
Plan to repurchase about $1.5 billion of its own shares in FY2026.
Too early to tellWhat happened
About $1.3 billion (5.0 million shares) bought by Sep 30, 2026.
Said on Feb 3, 2026
All seven segments expected to deliver positive organic growth and operating margin expansion in FY2026.
Too early to tellWhat happened
In Q3 FY2026, organic revenue fell in Automotive OEM (−2.1%), Construction Products (−0.8%) and Specialty Products (−1.2%).
Said on Feb 3, 2026
FY2026 free cash flowCash from operations minus spending on buildings and equipment. Learn more projected above 100% of net income.
Too early to tellWhat happened
On Oct 27, 2026 the company projected free cash flow of about 100% of net income.
Sources (9)
- Form 10-K for FY2025
- Form 8-K filed May 22, 2026 (Chief Accounting Officer change)
- 2026 proxy statement (DEF 14A)
- Q4 and full-year FY2024 earnings release (8-K Ex. 99.1)
- Q4 and full-year FY2025 earnings release (8-K Ex. 99.1)
- Q1 FY2026 earnings release (8-K Ex. 99.1)
- Q2 FY2026 earnings release (8-K Ex. 99.1)
- Q3 FY2026 earnings release (8-K Ex. 99.1)
- Form 10-Q for Q3 FY2026
08What could go wrong
What could go wrong for Illinois Tool Works?
- Demand
Demand follows the economy
ITW's 10-K says downturns in the markets it serves could hurt results. Organic revenue was flat in FY2025 and fell 0.7% in FY2024.
Watch Organic revenue growth each quarter, overall and by segment.
- Currency
More than half of sales are outside the US
The 10-K says over 50% of net sales come from customers outside the US, mainly Europe, so a stronger dollar lowers reported results. Currency added 0.8 points to FY2025 revenue growth.
Watch The currency effect in each earnings release.
- Regulation
Tariffs and trade rules
The 10-K describes new US tariffs from Apr 2, 2025 and counter-tariffs. The company says pricing and supply-chain actions offset the tariff impact in FY2025.
Watch Tariff comments and operating margin in each quarterly earnings release.
- Legal
IRS tax dispute
According to ITW's Q3 FY2026 10-Q (filed Oct 28, 2026), the IRS issued a Notice of Deficiency in Sep 2026 for tax years 2018 to 2021. The notice assessed $23 million of additional income taxes, plus interest and penalties, over a 2021 capital loss. It also disallowed $47 million of refund claims. The 10-Q says related taxes for later years total $148 million; ITW said it intends to petition the US Tax Court and believes it will be successful in defending its position.
Watch The Tax Court petition and any change in the 10-Q tax note.
- Debt
Rising debt and buybacks
Total debt rose to $9,372 million at Sep 30, 2026 from $7,863 million at Dec 31, 2024, while shareholders' equity was $3,142 million. ITW spent $1.5 billion on buybacks in each of FY2023, FY2024 and FY2025.
Watch Total debt, the debt-to-EBITDAOperating profit before wear-and-tear charges (depreciation and amortization). As a margin: per $100 of sales. ratio in the 10-K and the buyback pace.
- Raw-material prices
Raw material prices and supply
Steel, resins and chemicals are the main inputs, and the 10-K says raw material price rises and shortages could hurt results. Cost of revenue took $55.75 of every $100 that came in during FY2025.
Watch Gross margin and price-cost comments in earnings releases.
- Demand
Car industry exposure
Automotive OEM is the largest segment, 20.5% of FY2025 segment revenue, and has the lowest segment margin, 21.1% in FY2025, as stated in the FY2025 10-K. Its organic revenue fell 2.1% in Q3 FY2026.
Watch Automotive OEM organic growth and margin.
09Supporters vs. critics
What do supporters and critics point to?
What supporters point to
- Operating income per $100 of revenue rose from $24.1 in FY2021 to $26.3 in FY2025 (operating margin as stated in the FY2021 and FY2025 10-Ks).
- Operating margin reached 27.8% in Q3 FY2026, and the company says its enterprise initiatives added 1.3 points of it.
- Free cash flow, as reported in ITW's FY2023 to FY2025 10-Ks, was at least $1,936 million in each year from FY2021 to FY2025, and $2,707 million in FY2025.
- The company says the Q3 FY2026 dividend raise was its 63rd yearly increase in a row, to an annualized $6.88 a share.
- Sales are spread out: the largest segment, Automotive OEM, was 20.5% of FY2025 segment revenue, and the 10-K names no major customer.
What critics point to
- Organic revenue, which leaves out currency and acquisitions, was flat in FY2025 and fell 0.7% in FY2024, according to the company.
- Total debt rose from $7,863 million at Dec 31, 2024 to $9,372 million at Sep 30, 2026, against shareholders' equity of $3,142 million.
- Automotive OEM, the largest segment, had the lowest FY2025 segment margin, 21.1% according to the FY2025 10-K, and its organic revenue fell 2.1% in Q3 FY2026.
- According to the Q3 FY2026 10-Q, an IRS Notice of Deficiency for 2018 to 2021 assessed $23 million of additional taxes and disallowed $47 million of refund claims; ITW intends to petition the US Tax Court.
- In Q3 FY2026 organic revenue fell in three of seven segments, after the company had said in Feb 2026 that it expected all seven to grow.
10What to watch next
What should you watch next at Illinois Tool Works?
Next event
Q4 FY2026 results
Date not announced yet.
FY2026 results against the outlook
On Oct 27, 2026 ITW said it expects FY2026 GAAP earnings per share of $11.45 to $11.55. Q3 FY2026 diluted EPS was $3.00.
Segments that shrank
Organic revenue fell in Automotive OEM, Construction Products and Specialty Products in Q3 FY2026. The company had said in Feb 2026 that it expected all seven segments to grow in FY2026.
Debt and buybacks
Total debt was $9,372 million at Sep 30, 2026. ITW bought about $1.3 billion of its shares in the first nine months of FY2026, and its board approved a new $6.0 billion program on Aug 7, 2026.
The IRS tax dispute
The Q3 FY2026 10-Q says ITW intends to petition the US Tax Court over the IRS notice for 2018 to 2021. Later 10-Qs will show any change in its tax note.
11Key facts
Key facts about Illinois Tool Works
- What does Illinois Tool Works do?
- Illinois Tool Works (NYSE: ITW) makes industrial products for other businesses, such as car fasteners and plastic parts, commercial dishwashers, welding machines, adhesives and nail guns. At Dec 31, 2025 it had 88 divisions and about 43,000 employees in 49 countries.
- How does Illinois Tool Works make money?
- Illinois Tool Works sells parts, machines and consumables through seven segments. In FY2025 Automotive OEM was the largest, with $3,288 million or 20.5% of segment revenue, followed by Test & Measurement and Electronics at $2,825 million (Cityfort calculation from the FY2025 10-K).
- Who are Illinois Tool Works' customers?
- Illinois Tool Works sells to car makers and their suppliers, industrial manufacturers, restaurants and food processors, builders, and independent distributors and retailers. Its FY2025 10-K names no customer and gives no share of revenue for its largest customers.
- How big is Illinois Tool Works?
- Illinois Tool Works had operating revenue of $16,044 million and net income of $3,066 million in FY2025, against $15,898 million and $3,488 million in FY2024. FY2024 net income included a $363 million pre-tax gain on the sale of its Wilsonart stake.
- Where does Illinois Tool Works sell?
- Illinois Tool Works got 46.1% of FY2025 revenue from the United States, 25.9% from Europe, the Middle East and Africa, 19.2% from Asia Pacific, 6.8% from Canada and Mexico and 2% from South America (Cityfort calculation from the FY2025 10-K).
- Who owns Illinois Tool Works?
- No single holder controls Illinois Tool Works. The 2026 proxy lists The Vanguard Group at 9.1% (Schedule 13GA filing by anyone who owns more than 5% of a company's shares and does not seek control. Learn more/A of Feb 13, 2024) and Briar Hall Management, which holds Smith family shares, at 8.9%. Directors and executive officers held 0.83% at Mar 9, 2026 (Cityfort calculation from the 2026 proxy).
- How much debt does Illinois Tool Works have?
- Illinois Tool Works had total debt of $9,372 million and cash of $809 million at Sep 30, 2026, according to its Q3 FY2026 10-Q. Shareholders' equity was $3,142 million on the same date.
- Does Illinois Tool Works pay a dividend?
- Illinois Tool Works declared dividends of $6.22 a share for FY2025, up from $4.72 for FY2021. In Q3 FY2026 it raised the dividend 7% to an annualized $6.88 a share, which the company says was its 63rd yearly increase in a row.
Terms on this page
- Capital expenditures (capex)
- Debt-to-equity
- Earnings per share (EPS)
- EBITDA
- Free cash flow
- Net debt
- Net margin
- Revenue vs net income
- Stock buyback
Each explains the term in plain English, with the same number from other companies on Cityfort.
Go deeper
More detail from the same filings. Open any section.
12What it sells
12What it sells
What does Illinois Tool Works sell?
Automotive OEM
Plastic and metal parts, fasteners and assemblies for cars and light trucks, sold to car makers and their suppliers under long-term supply agreements.
Food Equipment
Commercial dishwashers, cooking, refrigeration and food processing equipment, kitchen exhaust systems and servicing, under brands such as Hobart.
Test & Measurement and Electronics
Machines, software and consumables that test materials and measure performance (brands such as Instron and MTS), plus equipment and materials for assembling electronics.
Welding
Arc welding equipment and the wire and other consumables it uses, under brands such as Miller.
Polymers & Fluids
Engineered adhesives, sealants, lubricants and cutting fluids, and products for the car aftermarket.
Construction Products
Fasteners and fastening tools, concrete anchors, roof truss parts and packaged hardware sold through retail stores.
Specialty Products
Beverage packaging equipment, product coding and marking, appliance parts, airport ground equipment and medical device parts.
What it does
- Does: Sells parts, machines and consumables to other businesses, directly or through independent distributors
- Does: Runs each of its 88 divisions as its own business, close to its customers
- Does: Owns about 4,200 US and 10,400 foreign patents (Dec 31, 2025)
What it does not do
- Does not: Does not make cars: it supplies components and fasteners to car makers
- Does not: Does not run one central research lab: ITW says its divisions develop products from customer needs
- Does not: Does not rely on a large order backlog: the 10-K says delivery periods are short
Sources (1)
13How the money flows
13How the money flows · FY2025
How does money flow through Illinois Tool Works?
Money in
- Operating revenue$16.0B
- Other income$42M
The company
Illinois Tool Works
$16.1B came in
Money out
- Cost of revenue$9.0B
- Selling, administrative and research costs$2.8B
- Amortization and impairment of intangibles$80M
- Interest expense$292M
- Income taxes$900M
- Net income$3.1B
- Customers paid ITW $16,044 million for its products in FY2025.
- Materials, factory labor and other costs of making those products took $8,969 million.
- Selling, office and research costs took $2,779 million, and writing down bought-in intangible assets $80 million.
- Interest on debt took $292 million and income taxes $900 million, after $42 million of other income.
- That left $3,066 million of net income.
Sources (1)
14What it needs to run
14What it needs to run
What does Illinois Tool Works need to run?
Steel, resins and chemicals
The main raw materials, bought from many suppliers; the 10-K says their supply has not caused significant business interruptions.
About 410 plants and offices
About 270 of them were outside the US at Dec 31, 2025, and no single site is significant on its own.
About 43,000 employees
About 16,000 of them work in the US, at Dec 31, 2025.
Patents
About 4,200 US and 10,400 foreign unexpired patents, plus about 7,200 pending applications, at Dec 31, 2025.
Sources (1)
15Where it sells
15Where it sells · FY2025
Where does Illinois Tool Works sell?
- United States46.1%
- Canada and Mexico6.8%
- Europe, Middle East and Africa25.9%
- Asia Pacific19.2%
- South America2%
Sources (1)
16Competitors and what protects it
16Competitors and what protects it
Who does Illinois Tool Works compete with?
Lincoln Electric Holdings
Named in ITW's FY2025 10-K as a global competitor of its Welding segment.
ESAB Corporation
Named in ITW's FY2025 10-K as a global competitor of its Welding segment.
What protects the business
Each strength is scored 1 (weak) to 5 (strong) for the business, with the reason. It is not a rating of the share.
- Spread across seven segments4 of 5
No segment brought more than 20.5% of FY2025 segment revenue (Automotive OEM, $3,288 million of $16,062 million; Cityfort calculation from the FY2025 10-K).
- Operating method (80/20 Front-to-Back)4 of 5
ITW reported a segment operating margin of 27.2% for FY2025, and says enterprise initiatives added 1.3 points to operating margin that year.
- Patents and brands3 of 5
About 4,200 US and 10,400 foreign unexpired patents at Dec 31, 2025, with brands such as Hobart, Miller and Instron.
- Global footprint3 of 5
ITW operates in 49 countries; its 10-K says this footprint is a competitive advantage in many markets, especially in Automotive OEM.
Weak spot
Slow organic growth
The FY2025 10-K reports organic revenue (growth before currency moves and acquisitions) flat in FY2025 and down 0.7% in FY2024, with product line simplification cutting 0.6 points from both years.
17Where growth could come from
17Where growth could come from
Where could Illinois Tool Works' growth come from?
In its Oct 27, 2026 earnings release, ITW said it expects FY2026 GAAP earnings per share of $11.45 to $11.55, revenue growth of 4.5% to 5.5% and organic growth of 3% to 4%.
Customer-Back Innovation (new products from customer needs)
Working+2.4% of revenue growth, FY2025
The company says new products added 2.4 points to FY2025 revenue growth; its stated goal is a yield of 3% or more.
Status: Working, on track against what the company said.
Enterprise initiatives (80/20 and purchasing)
Working+1.3 points of margin, Q3 FY2026
The company says these added 1.3 points to operating margin in FY2025 and again in Q3 FY2026, when the margin reached 27.8%.
Status: Working, on track against what the company said.
Welding and test equipment demand
Working+15.8% organic, Test & Measurement, Q3 FY2026
Q3 FY2026 organic revenue grew 15.8% in Test & Measurement and Electronics and 6.9% in Welding, which lost an estimated $40 million of sales to a tornado.
Status: Working, on track against what the company said.
Automotive OEM
Mixed−2.1% organic, Q3 FY2026
Revenue rose to $3,288 million in FY2025 from $3,188 million, but organic revenue fell 2.1% in Q3 FY2026.
Status: Mixed, partly on track.
Status compares progress with what the company itself said it would do: Working = on track against what the company said; Mixed = partly on track; Behind = behind the company's own plan; New = recently announced; Early = too early to judge.
18The company's own measures (non-GAAP)
18The company's own measures · FY2025, unless the row says otherwise
What do Illinois Tool Works' own measures show?
Official (GAAP): Reported revenue growth, FY2025
0.9%
Company's own measure: Organic revenue growth, FY2025
0.0%
Organic growth leaves out currency moves (+0.8 points) and acquisitions (+0.1 points).
Official (GAAP): Reported revenue growth, Q3 FY2026
4.4%
Company's own measure: Organic revenue growth, Q3 FY2026
3.8%
Leaves out currency (+0.3 points) and an acquisition (+0.3 points). The company estimates about 5% organic growth without the Welding tornado.
Official (GAAP): Net cash provided by operating activities, FY2025
$3.1B
Company's own measure: Free cash flow, FY2025
$2.7B
ITW defines free cash flow as operating cash flow minus additions to plant and equipment ($419 million); it states this was 88% of net income.
Official (GAAP): Net income, FY2025
$3.1B
Company's own measure: EBITDA, FY2025
$4.6B
ITW adds back interest, other income or expense, income taxes, depreciation and amortization; the 10-K uses it for its debt-to-EBITDA ratio of 1.9 times.
These are the company's own measures, defined by the company. They are not comparable across companies, and they are not added together. Each sits beside the nearest official (GAAP) figure.
Learn: Non-GAAP measures: what a company's "adjusted" numbers leave out
19Financial strength and debt
19Financial strength · Sep 30, 2026
How much debt does Illinois Tool Works have?
- Total debt$9.4B
- Cash and investments$809M
- Net debt (debt minus cash)$8.6B
- Net worth (shareholders' money)$3.1B
- Debt to equity
- 2.98×
- $ of debt for every $1 of shareholders' money
- Net debt of $8,563 million is total debt ($2,219 million short-term plus $7,153 million long-term) minus $809 million of cash: Cityfort calculation from the Q3 FY2026 10-Q.
- In the FY2025 10-K, ITW states total debt was 1.9 times its FY2025 EBITDA, up from 1.7 times for FY2024.
- In August 2026 ITW sold $1.5 billion of 4.65% notes due 2029, mainly to repay commercial paper (short-term company borrowing).
- A new $3.0 billion five-year credit agreement from Feb 20, 2026 replaced the old revolving credit line; nothing was borrowed under it when it was signed.
20Who owns it
20Who owns it · ownership as of Mar 9, 2026
Who owns Illinois Tool Works?
- Officers and directors (as a group), shares
- 0.8%
Share classes
Holders of 5% or more
From the company's proxy statement (DEF 14A), later Schedule 13G filings and the share counts on its latest annual or quarterly report. Each holder row shows the date of its own filing.
Learn: How to read a proxy statement (DEF 14A): Nvidia's 2026 proxy · Form 4 insider filings: who files, the codes and the footnotes
21What it does with profit
21What it does with profit
What does Illinois Tool Works do with its profit?
Dividend per share
$6.22FY2025
Dividend paid for each share, by financial year.
$ per share
See the numbers
Buyback · Dec 31, 2021
Repurchases of common stock in FY2021.
$1.0B
Buyback · Dec 31, 2022
Repurchases of common stock in FY2022.
$1.8B
Buyback · Dec 31, 2023
Repurchases of common stock in FY2023.
$1.5B
Buyback · Dec 31, 2024
Repurchases of common stock in FY2024 (about 5.9 million shares).
$1.5B
Buyback · Dec 31, 2025
Repurchases of common stock in FY2025 (about 6.0 million shares).
$1.5B
22Governance signals
22Governance signals
What do Illinois Tool Works' governance filings show?
- Auditor
- Deloitte & Touche LLP, since 2002
- Auditor changes
- None in the period covered
- Audit qualifications
- None reported
- Related-party dealings
- The 2026 proxy says ITW's Code of Conduct requires directors, officers and employees to avoid conflicts of interest and to raise any transaction that may create one for review.
- Credit rating
- Not checked for this page
23How it got here
23How it got here
How did Illinois Tool Works get here?
1912
Milestone
Founded
Illinois Tool Works was founded in 1912 and incorporated in 1915; the Smith family, its founders, still hold shares through Briar Hall Management.
2012
Business-model change
Enterprise Strategy begins
ITW started simplifying its portfolio and applying its 80/20 process across the company, ending up with 88 divisions.
2012
Business-model change
Decorative surfaces business sold
ITW sold a 51% majority stake in its Decorative Surfaces segment (Wilsonart) to funds managed by Clayton, Dubilier & Rice.
2023
Milestone
$5.0 billion buyback program
Announced on Aug 4, 2023; about $2.0 billion of it was left at Dec 31, 2025.
2024
Business-model change
New chief executive and Next Phase
Christopher O'Herlihy became CEO in 2024, as the company began the Next Phase of its strategy (2024 to 2030), aimed at organic growth.
2024
Milestone
Last Wilsonart stake sold
On Aug 5, 2024 ITW sold its remaining stake in Wilsonart for $398 million, booking a $363 million pre-tax gain.
2026
Crisis
Tornado hits two Welding plants
Damage in late July 2026 cut Q3 revenue by an estimated $40 million; the company says insurance largely offset the lost operating income.
2026
Milestone
New borrowing and buyback approval
ITW sold $1.5 billion of 4.65% notes due 2029 in August 2026, and its board approved a new $6.0 billion buyback program on Aug 7, 2026.
24Sources and changes
Where every number on this page comes from
Sources (23 documents)
- S1Form 10-Q for Q3 FY2026 · SEC EDGAR · Tier 1: company or exchange filing · Oct 28, 2026
- S2Form 10-Q for Q2 FY2026 · SEC EDGAR · Tier 1: company or exchange filing · Aug 6, 2026
- S3Form 10-Q for Q1 FY2026 · SEC EDGAR · Tier 1: company or exchange filing · May 7, 2026
- S4Form 10-K for FY2025 · SEC EDGAR · Tier 1: company or exchange filing · Feb 13, 2026
- S5Form 10-Q for Q3 FY2025 · SEC EDGAR · Tier 1: company or exchange filing · Oct 24, 2025
- S6Form 10-Q for Q2 FY2025 · SEC EDGAR · Tier 1: company or exchange filing · Aug 1, 2025
- S7Form 10-Q for Q1 FY2025 · SEC EDGAR · Tier 1: company or exchange filing · May 1, 2025
- S8Form 10-K for FY2024 · SEC EDGAR · Tier 1: company or exchange filing · Feb 14, 2025
- S9Form 10-Q for Q3 FY2024 · SEC EDGAR · Tier 1: company or exchange filing · Oct 30, 2024
- S10Form 10-Q for Q2 FY2024 · SEC EDGAR · Tier 1: company or exchange filing · Aug 2, 2024
- S11Form 10-Q for Q1 FY2024 · SEC EDGAR · Tier 1: company or exchange filing · May 2, 2024
- S12Form 10-K for FY2023 · SEC EDGAR · Tier 1: company or exchange filing · Feb 9, 2024
- S13Form 10-K for FY2022 · SEC EDGAR · Tier 1: company or exchange filing · Feb 10, 2023
- S14Form 10-K for FY2021 · SEC EDGAR · Tier 1: company or exchange filing · Feb 11, 2022
- S15Q3 FY2026 earnings release (8-K Ex. 99.1) · Illinois Tool Works Inc. (furnished to SEC EDGAR) · Tier 1: company or exchange filing · Oct 27, 2026
- S16Q2 FY2026 earnings release (8-K Ex. 99.1) · Illinois Tool Works Inc. (furnished to SEC EDGAR) · Tier 1: company or exchange filing · Jul 28, 2026
- S17Q1 FY2026 earnings release (8-K Ex. 99.1) · Illinois Tool Works Inc. (furnished to SEC EDGAR) · Tier 1: company or exchange filing · Apr 30, 2026
- S18Q4 and full-year FY2025 earnings release (8-K Ex. 99.1) · Illinois Tool Works Inc. (furnished to SEC EDGAR) · Tier 1: company or exchange filing · Feb 3, 2026
- S19Q4 and full-year FY2024 earnings release (8-K Ex. 99.1) · Illinois Tool Works Inc. (furnished to SEC EDGAR) · Tier 1: company or exchange filing · Feb 5, 2025
- S202026 proxy statement (DEF 14A) · SEC EDGAR · Tier 1: company or exchange filing · Mar 27, 2026
- S21Form 8-K filed Feb 23, 2026 (new $3.0 billion credit agreement) · SEC EDGAR · Tier 1: company or exchange filing · Feb 23, 2026
- S22Form 8-K filed May 22, 2026 (Chief Accounting Officer change) · SEC EDGAR · Tier 1: company or exchange filing · May 22, 2026
- S23Form 8-K filed Aug 13, 2026 ($1.5 billion notes due 2029) · SEC EDGAR · Tier 1: company or exchange filing · Aug 13, 2026
Changes to this page (v1 · Nov 20, 2026)
- v1 · Nov 20, 2026First version. (first version)
Numbers come only from tier 1 and tier 2 sources. Read how we research.
Disclaimer
For learning only. Cityfort is not a registered investment adviser or broker-dealer and does not recommend buying or selling any security. Prices shown are dated and may be out of date.
Investing in securities involves risk, including loss of capital. Before making any investment decision, do your own research and consider consulting a registered investment adviser or other qualified professional.
Cityfort, its owners and contributors may or may not hold securities of companies covered. Cityfort is not paid by any company it covers. Content is not an offer or solicitation to buy or sell any security, including in any initial public offering.
Read the positions policyRead the full disclaimerHide the full disclaimer
Cityfort publishes general educational content that explains how listed companies work. Cityfort is not registered with the US Securities and Exchange Commission or any state securities regulator as an investment adviser, and is not a broker-dealer or a member of FINRA. Cityfort does not provide investment, tax or legal advice, recommendations, ratings, price targets or any opinion on whether to buy, sell or hold any security. Nothing on the site is tailored to any person's circumstances.
All information is taken from publicly available sources, mainly company filings with the SEC, which are listed on each page with dates. We work to keep it accurate and correct errors publicly, but we do not guarantee that it is complete, accurate or up to date. Any market price or price-based ratio shown is dated, may be out of date by the time you read it, and is included only to explain concepts.
Statements by company management, including forward-looking statements and guidance, are reported as the company's statements, with their date and source; they are not our forecasts. Adjusted (non-GAAP) figures are the company's own measures and are shown next to the official (GAAP) figures.