Technology · NASDAQ: ROP
Roper Technologies: how the business works
Roper Technologies owns 29 businesses that mostly sell software built for one industry, such as insurance agencies and schools, with revenue of $7.90 billion in FY2025.
By Hardik Bhandare · Checked against filings: . Editorial policy. Corrections
Follow Roper Technologies
Email me when Roper Technologies's page is updated after earnings.
We'll send a confirmation email first. See our privacy policy.
Roper Technologies, Inc. · Sarasota, Florida · Founded 1981
Updated for Q3 FY2026 · checked
- Revenue, FY2025
- $7.90B
- Net income, FY2025
- $1.54B
- Businesses it owns
- 29
- Employees, Dec 31, 2025
- About 19,400
- Incorporated in Delaware
- 1981
The short version
Roper Technologies in 5 points
1 · What it sells
Roper owns 29 businesses; in FY2025 its Application Software segment had $4.48 billion of revenue, Technology Enabled Products $1.82 billion and Network Software $1.60 billion.
2 · Who pays it
Software subscribers paid 56.7% of Roper's FY2025 revenue, product buyers 22.4%, transaction-fee payers 10.5% and one-time software buyers 10.3%.
3 · What it keeps from $100
Of every $100 that came in during FY2025, Roper kept $19.4 as net income, which includes $25.7 million of investment gains and other income; operating income was $2.24 billion.
4 · Where the operating profit comes from
Application Software had $1.20 billion of Roper's FY2025 segment operating profit, Network Software $696 million and Technology Enabled Products $627 million, before $290 million of corporate costs.
5 · The one thing to watch
Roper's debt was $9.72 billion at Sep 30, 2026, with $1.42 billion due within a year, including $700 million of notes due Dec 15, 2026.
Sources: From Roper's FY2025 10-K, Q3 FY2026 10-Q and 2026 proxy statement · checked
01Where the money goes · FY2025
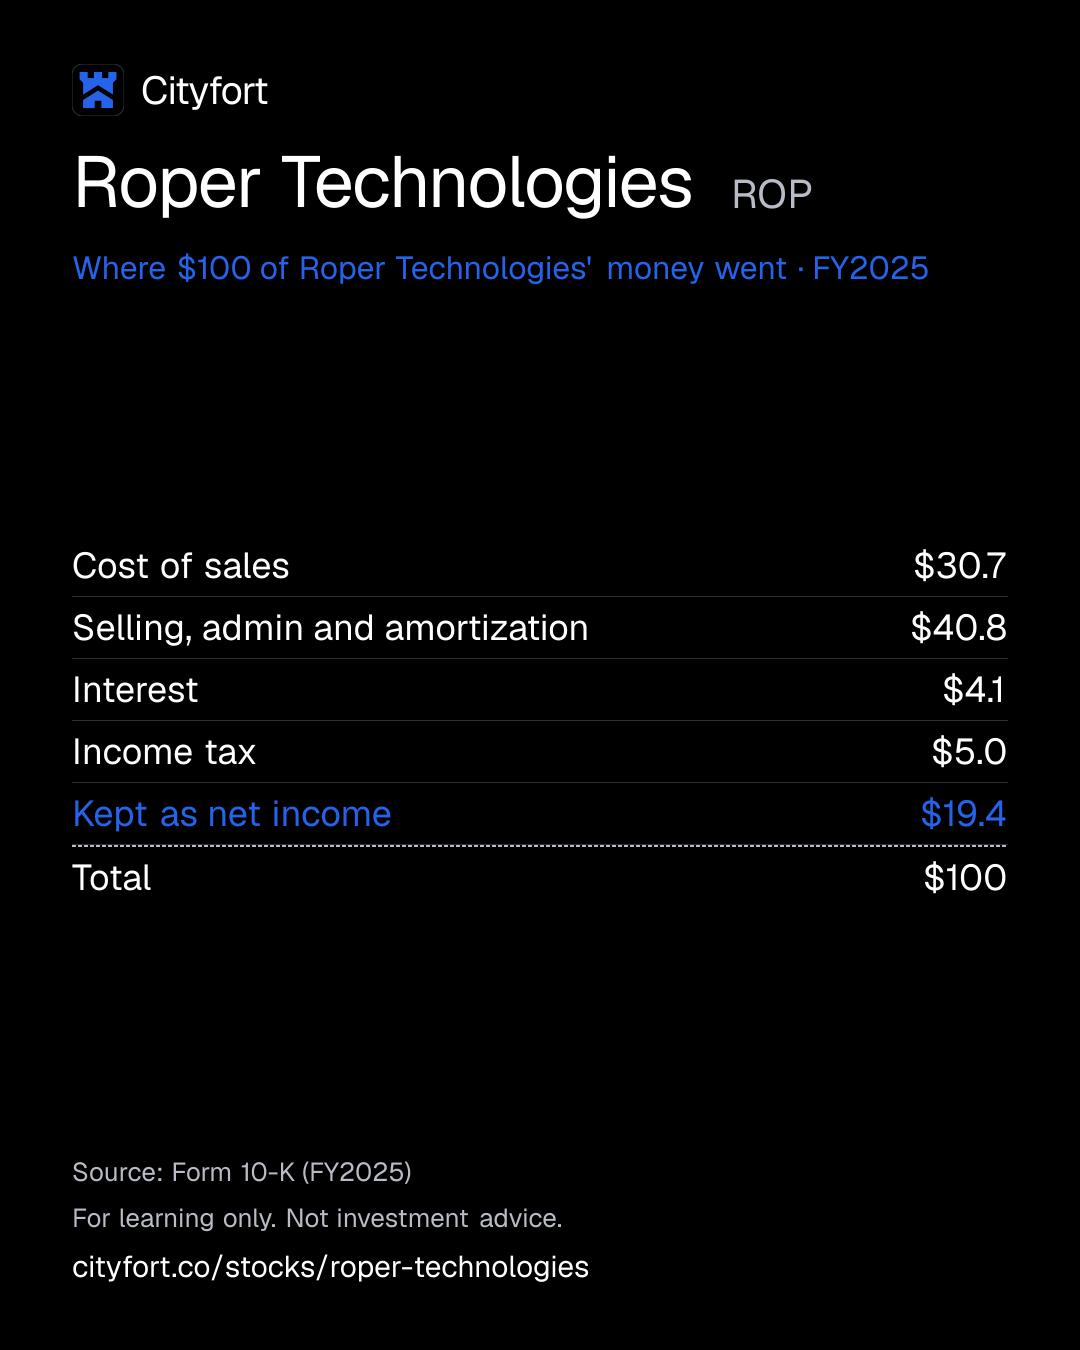
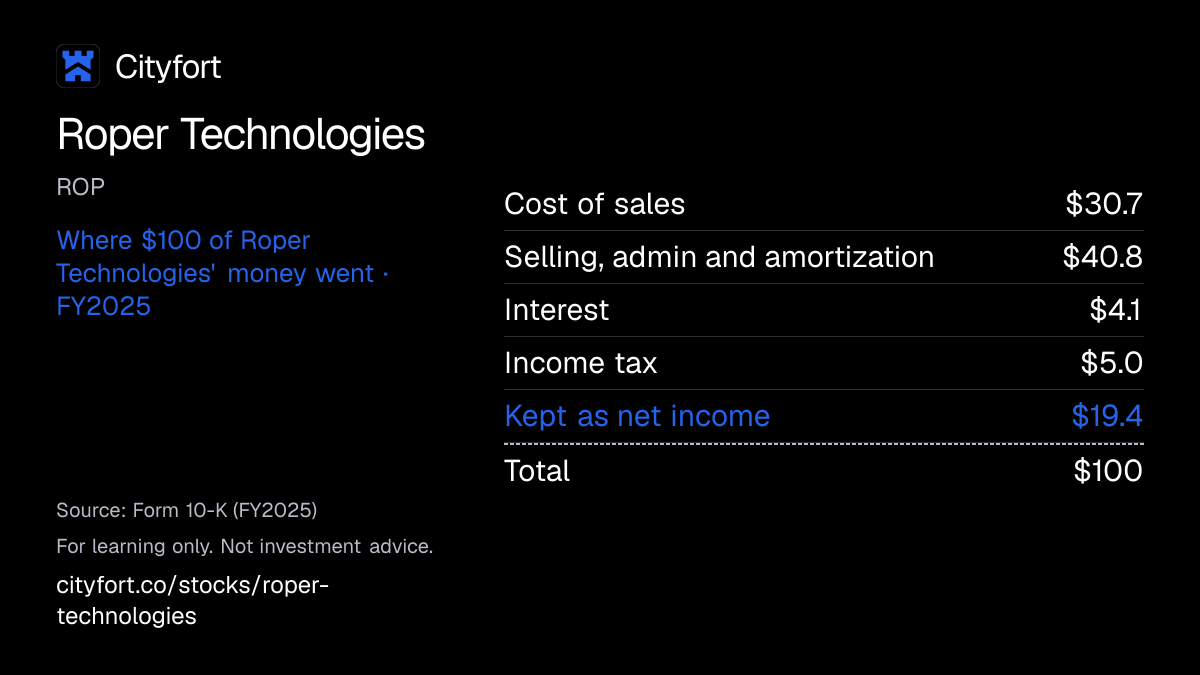
Where does $100 of Roper Technologies' money go?
Roper Technologies · FY2025
Receipt for every $100
| Cost of sales | $30.7 |
|---|---|
| Selling, admin and amortization | $40.8 |
| Interest | $4.1 |
| Income tax | $5.0 |
| Kept as net income | $19.4 |
| Total | $100 |
Each line = amount ÷ total money in × 100. Lines may not add to exactly $100 because of rounding.
How this is worked out
Cityfort calculation from the FY2025 10-K. Of every $100 that came in during FY2025 (revenue plus $25.7 million of investment gains and other income): each line = line ÷ $7.93 billion × 100. Costs include $815 million of amortization of acquired intangible assets, a non-cash cost.
Save this receipt as an image
Embed this receipt or the key numbers
Paste this code into a blog or website to show the card you choose, with a link back to this page.
Each week: the next company due to report earnings, explained in 5 points.
No tips. Unsubscribe anytime.
We'll send a confirmation email. See our privacy policy.
02The business in one line
What does Roper Technologies do?
Insurance agencies, schools, government contractors and other niche customers pay Roper mostly recurring software fees; in FY2025 it kept $19.4 of every $100 that came in as net income.
- Recurring software subscriptions, licenses and support were 56.7% of FY2025 revenue, and products such as water meters and medical devices were 22.4%.
- Free cash flow was $2.49 billion in FY2025, and Roper spent $3.29 billion buying nine companies that year.
03Who pays it
Who pays Roper Technologies?
Software subscribers
56.7%
of revenue
Businesses and institutions that pay recurring fees for SaaS (software used over the internet), annual licenses and support. $4.48 billion in FY2025.
Transaction-fee payers
10.5%
of revenue
Users charged per transaction or by volume through Roper software, such as freight brokers and payment users. $833 million in FY2025.
One-time software buyers
10.3%
of revenue
Customers buying multi-year or permanent licenses, setup services and hardware sold with software. $814 million in FY2025.
Product buyers
22.4%
of revenue
Water utilities, hospitals and other buyers of meters, medical devices and sensors. $1.77 billion in FY2025.
- Software subscribers56.7%
- Transaction-fee payers10.5%
- One-time software buyers10.3%
- Product buyers22.4%
How spread out the customers are
The FY2025 10-K says no customer accounted for 10% or more of any segment or of total revenue. Shares by revenue type are a Cityfort calculation from the FY2025 10-K.
Sources (1)
04How it makes money
How does Roper Technologies make money?
Buy niche software businesses, let them run on their own, and use their cash to buy more.
Recurring software fees were 56.7% of FY2025 revenue, and gross profit was $69.24 per $100 of revenue. Capital spending was only $47.4 million in FY2025, so most operating cash flow can go to acquisitions, dividends or buybacks. Free cash flowCash from operations minus spending on buildings and equipment. Learn more per $100 is a Cityfort calculation from the FY2025 10-K.
Free cash flow per $100 of revenue
$31.8$31.5
FY2023 to FY2025
- Own software used daily in one industry
- Customers renew subscriptions and support
- High gross profit, low equipment spending
- Cash flow funds new acquisitions
- Acquired businesses add more recurring revenue
↺ Step 5 feeds back into step 1.
Sources (1)
05Business segments · FY2025
Which businesses make up Roper Technologies?
Application Software
56.7%Industry software for law firms, insurance agents, schools, labs, government contractors and child-care centers.
Revenue $4.5B ($4,483M) · Operating profit $1.2B ($1,203M)
Network Software
20.3%Marketplaces and data networks, such as freight matching, food supply chains and life insurance sales.
Revenue $1.6B ($1,601M) · Operating profit $696M
Technology Enabled Products
23%Water meters, medical devices, sensors and card readers, often with software attached.
Revenue $1.8B ($1,819M) · Operating profit $627M
How the mix changed
- Application Software
- Network Software
- Technology Enabled Products
Revenue by segment, FY2021 to FY2025.
US$
See the numbers
06The numbers · Consolidated · US$
How has Roper Technologies done?
Revenue
$7.9BFY2025
Revenue grew every year, from $4.83 billion in FY2021 (restated without the industrial businesses sold in 2022) to $7.90 billion in FY2025.
US$
See the numbers
Net income
$1.5BFY2025
FY2022 net income of $4.54 billion includes the gain on selling a majority of the industrial businesses; FY2025 net income was $1.54 billion, against $1.55 billion in FY2024.
US$
See the numbers
Net income for every $100 of revenue
$19.4FY2025
EBITDA (profit before interest, tax, depreciation and amortization) stayed between $38.4 and $40.5 per $100 of revenue in each year from FY2021 to FY2025.
Net margin: $ of net income per $100 of revenue
See the numbers
Free cash flow
$2.5BFY2025
Free cash flow was $2.49 billion in FY2025; FY2021 to FY2023 cash flows include the industrial businesses sold in 2022, and FY2022's $695 million came after $953.8 million of cash taxes on that sale.
US$ · cash from operations minus spending on plants and equipment
See the numbers
See all yearly numbers
EBITDA here = operating income plus depreciation and amortization (from the cash flow statement). Fiscal years are the company's own: Fiscal year ends Dec 31. Net income is the share belonging to the company's owners.
Learn: Fiscal years that don't end in December: Nvidia's FY2027 explained · Stock-based compensation and dilution: pay that becomes shares
Sources (16)
- Form 10-K for FY2023
- Form 10-K for FY2021
- Form 10-K for FY2022
- Form 10-K for FY2024
- Form 10-K for FY2025
- Form 10-Q for Q1 FY2024
- Form 10-Q for Q2 FY2024
- Form 10-Q for Q3 FY2024
- Q4 FY2024 earnings release (8-K Ex. 99.1)
- Form 10-Q for Q1 FY2025
- Form 10-Q for Q2 FY2025
- Form 10-Q for Q3 FY2025
- Q4 FY2025 earnings release (8-K Ex. 99.1)
- Form 10-Q for Q1 FY2026
- Form 10-Q for Q2 FY2026
- Form 10-Q for Q3 FY2026
07Who runs it
Who runs Roper Technologies, and did they deliver?
L. Neil Hunn
President and Chief Executive Officer · since 2018
CEO since August 2018, earlier Chief Operating Officer. Total 2025 pay was $26.2 million.
Jason P. Conley
Executive Vice President and Chief Financial Officer · since 2023
CFO since February 2023; at Roper since 2006.
John K. Stipancich
Executive Vice President, Chief Legal Officer and Corporate Secretary · since 2018
Amy Woods Brinkley
Independent Chair of the Board · since 2021
Chair since Jun 1, 2021; director since 2015; retired Chief Risk Officer of Bank of America.
What they said, and what happened
3 delivered · 1 too early to tell
Said on Jan 27, 2026
Guided Q1 FY2026 adjusted diluted EPS (profit per share on Roper's own adjusted basis) of $4.95 to $5.00.
DeliveredWhat happened
Reported $5.16 for Q1 FY2026.
Said on Apr 23, 2026
Guided Q2 FY2026 adjusted diluted EPS of $5.25 to $5.30.
DeliveredWhat happened
Reported $5.38 for Q2 FY2026.
Said on Jul 23, 2026
Guided Q3 FY2026 adjusted diluted EPS of $5.75 to $5.80.
DeliveredWhat happened
Reported $5.89 for Q3 FY2026.
Said on Jan 27, 2026
Guided FY2026 adjusted diluted EPS of $21.30 to $21.55 and total revenue growth of about 8%.
Too early to tellWhat happened
The EPS range was raised to $22.35 to $22.40 on Oct 22, 2026; full-year results are not yet reported.
08What could go wrong
What could go wrong for Roper Technologies?
- Execution
Growth depends on acquisitions
Roper spent $3.29 billion on nine acquisitions in FY2025. Its 10-K says it may not find suitable targets or integrate them well.
Watch Acquisition spending and organic growth in each earnings release.
- Debt
Debt of $9.72 billion
Debt was $9.72 billion at Sep 30, 2026, with $1.42 billion due within a year. The credit line caps debt at 0.65 times total capital.
Watch Refinancing of the $700 million of notes due Dec 15, 2026.
- Other
Goodwill larger than equity
Goodwill (the premium paid for acquired businesses) was $21.34 billion at Dec 31, 2025, about 62% of total assets and more than shareholders' equity. A write-down would cut reported profit.
Watch Any goodwill impairment charge in the 10-K or 10-Qs.
- Other
Indicor stake swings net income
Roper re-estimates the value of its 43.4% Indicor stake each quarter, using its own assumptions, and the changes are added to or taken from net income. Q2 FY2026 included an $835.2 million pre-tax gain.
Watch The Indicor pump sale: the Q3 FY2026 10-Q (Nov 2, 2026) says Roper expects about $600 million before tax when it closes.
- Technology
AI could change its markets
The 10-K says competitors or AI companies may use AI to compete, and that Roper relies on outside AI models it does not control.
Watch Organic growth in Application Software and Network Software.
- Technology
Cyber attacks and cloud outages
Roper's software runs partly on outside data centers and cloud platforms. The 10-K says a failure or attack could disrupt its operations.
Watch Incidents reported in 8-K filings or the 10-K.
- Legal
Legal claims
The 10-K says Roper faces routine claims from normal business, including product liability, antitrust and data privacy. Its PowerPlan unit settled a legal matter in January 2025 for $24.0 million before tax.
Watch Note 13 (contingencies) in the next 10-K.
09Supporters vs. critics
What do supporters and critics point to?
What supporters point to
- Revenue rose in each year from FY2021 to FY2025, from $4.83 billion to $7.90 billion; FY2021 is restated without the industrial businesses sold in 2022.
- Recurring software fees were 56.7% of FY2025 revenue, and the 10-K says no customer was 10% or more of revenue.
- Free cash flow was $2.49 billion in FY2025, after $47.4 million of capital spending.
- Roper's adjusted diluted EPS, its own non-GAAP measure, came in above its guidance range in each of Q1, Q2 and Q3 FY2026.
- The FY2025 10-K says Roper has raised its dividend every year since its 1992 IPO.
What critics point to
- Debt was $9.72 billion at Sep 30, 2026, against $311 million of cash and cash equivalents.
- Goodwill was $21.56 billion at Sep 30, 2026, more than shareholders' equity of $19.17 billion.
- Growth leans on acquisitions: Roper spent $3.29 billion on nine deals in FY2025.
- FY2025 net income was $1.54 billion, against $1.55 billion in FY2024, while revenue rose.
- The 10-K says competitors or AI companies may use AI to compete, and Roper relies on outside AI models.
10What to watch next
What should you watch next at Roper Technologies?
Next event
Q4 FY2026 results
Date not announced yet.
Notes due Dec 15, 2026
$700 million of 3.80% notes fall due on Dec 15, 2026. Debt due within a year was $1.42 billion at Sep 30, 2026.
Indicor pump sale
The Q3 FY2026 10-Q says Roper expects about $600 million before tax when the sale closes. Changes in the stake's value are added to or taken from net income.
FY2026 guidance
On Oct 22, 2026 Roper guided FY2026 adjusted diluted EPS of $22.35 to $22.40. Organic revenue grew 7% in Q3 FY2026.
11Key facts
Key facts about Roper Technologies
- What does Roper Technologies do?
- Roper Technologies owns 29 businesses. Most sell software built for one industry, such as Vertafore for insurance agencies and Frontline for school districts; others make Neptune water meters and Verathon medical devices.
- How does Roper Technologies make money?
- In FY2025, recurring software fees were 56.7% of Roper Technologies' $7.90 billion revenue, product sales 22.4%, transaction fees 10.5% and one-time software sales 10.3% (Cityfort calculation from the FY2025 10-K).
- Who are Roper Technologies' customers?
- Roper Technologies sells to government contractors, insurance agencies, school districts, child-care centers, freight brokers, water utilities and hospitals. Its FY2025 10-K says no customer was 10% or more of revenue.
- How big is Roper Technologies?
- Roper Technologies had FY2025 revenue of $7.90 billion and net income of $1.54 billion, against $7.04 billion and $1.55 billion in FY2024. It had about 19,400 employees at Dec 31, 2025.
- Which Roper Technologies segment makes the most profit?
- In FY2025, Roper Technologies' Application Software segment had operating profit of $1.20 billion, Network Software $696 million and Technology Enabled Products $627 million, before $290 million of corporate costs.
- How much debt does Roper Technologies have?
- Roper Technologies had $9.72 billion of debt and $311 million of cash and cash equivalents at Sep 30, 2026, with $1.42 billion of debt due within a year.
- Does Roper Technologies pay a dividend?
- Roper Technologies declared dividends of $3.39 a share in FY2025, up from $3.08 in FY2024. Its FY2025 10-K says it has raised the dividend every year since its February 1992 IPO.
- Who owns Roper Technologies?
- Roper Technologies has one class of stock and no controlling holder, with 99.0 million shares outstanding at Sep 30, 2026. Its 2026 proxy lists The Vanguard Group at 11.6% (as of Dec 31, 2025), BlackRock at 9.0% (as of Dec 31, 2023) and WindAcre Partnership at 6.9%.
Terms on this page
- Backlog
- Capital expenditures (capex)
- Debt-to-equity
- Earnings per share (EPS)
- EBITDA
- Free cash flow
- Interest coverage
- Net debt
- Net margin
- Remaining performance obligations (RPO)
Each explains the term in plain English, with the same number from other companies on Cityfort.
Go deeper
More detail from the same filings. Open any section.
12What it sells
12What it sells
What does Roper Technologies sell?
Application Software
Software that runs daily work in one industry: Deltek for government contractors, Vertafore for insurance agencies, Frontline for school districts, Procare for child-care centers. $4.48 billion of revenue in FY2025.
Network Software
Online marketplaces and data networks that link many buyers and sellers, such as DAT, which matches truck loads with carriers in the US and Canada. $1.60 billion of revenue in FY2025.
Technology Enabled Products
Physical products with software inside: Neptune water meters for utilities, Verathon airway and bladder-scanning devices for hospitals, and RFID card readers. $1.82 billion of revenue in FY2025.
Think of it like this
Like a holding company of small specialist software firms, each run by its own managers and each serving one niche.
What it does
- Does: Sells subscriptions, support and licenses for industry-specific software
- Does: Charges transaction fees through some of its software, such as freight matching and payments
- Does: Buys software companies every year and folds bolt-on deals into businesses it already owns
What it does not do
- Does not: Make general-purpose software sold to every industry
- Does not: Depend on one large customer: no customer reached 10% of revenue in FY2025
- Does not: Run the industrial pump and instrument businesses it once owned; it sold a majority of them in 2022 and keeps a 43.4% stake
Sources (1)
13How the money flows
13How the money flows · FY2025
How does money flow through Roper Technologies?
Money in
- Recurring software fees$4.5B
- Transaction and volume fees$833M
- One-time licenses and services$814M
- Product sales$1.8B
- Gains on equity investments and other income$25.7M
The company
Roper Technologies
$7.9B came in
Money out
- Cost of sales$2.4B
- Selling, general and administrative (incl. amortization)$3.2B
- Net interest$325M
- Income tax$400M
- Net income$1.5B
- Customers paid Roper $7.90 billion in FY2025, 56.7% of it as recurring software fees.
- Making products and delivering software and services cost $2.43 billion.
- Selling, running the businesses and amortizing acquired assets took $3.24 billion.
- Interest on debt was $325 million and income tax $400 million.
- $1.54 billion was left as net income.
Sources (1)
14What it needs to run
14What it needs to run
What does Roper Technologies need to run?
Acquisitions
Roper spent about $8.96 billion buying businesses over FY2023 to FY2025; its 10-K says its growth rate depends highly on finding and integrating new ones.
People
About 19,400 employees at the end of 2025, 13,100 of them in the US. Each business is run by its own managers.
Cloud platforms and AI models
Some systems run on Amazon Web Services, Google Cloud, Microsoft Azure and Oracle Cloud; products use AI models from providers such as OpenAI, Anthropic, Google and Microsoft.
Components
The products segment buys parts; some components are available from only a limited number of suppliers.
Borrowing
A $3.5 billion revolving credit line signed in March 2026 and $8.5 billion of bonds help pay for acquisitions.
15Where it sells
15Where it sells · FY2025
Where does Roper Technologies sell?
- United States87%
- Europe6.9%
- Canada3.7%
- Rest of world1.6%
- Asia0.9%
Sources (1)
16Where growth could come from
16Where growth could come from
Where could Roper Technologies' growth come from?
In its Oct 22, 2026 earnings release, Roper raised its FY2026 adjusted diluted EPS guidance to $22.35 to $22.40, from $22.15 to $22.30 in July. It guided Q4 FY2026 adjusted diluted EPS of $5.95 to $6.00. The guidance excludes future acquisitions, share buybacks and proceeds from the pending Indicor pump sale.
Organic growth
Working+7% organic revenue, Q3 FY2026
Revenue from businesses Roper already owned rose 7% in Q3 FY2026, with acquisitions adding 1 point to 8% total growth.
Status: Working, on track against what the company said.
Acquisitions
Working$3.29 billion on 9 deals, FY2025
FY2025 deals included CentralReach (autism therapy software, about $1.85 billion) and Subsplash (church software, about $800 million). Four smaller deals followed in the first nine months of 2026.
Status: Working, on track against what the company said.
Contracted backlog
Working$3.47 billion, Sep 30, 2026
Backlog, the contracted revenue expected within 12 months, was 9.4% higher than a year earlier.
Status: Working, on track against what the company said.
AI features in its software
EarlyLaunches named at PowerPlan, Strata and Vertafore, Q3 FY2026
CEO Neil Hunn said in the Oct 22, 2026 release that its businesses brought several AI launches to market in the quarter. No revenue figure is disclosed.
Status: Early, too early to judge.
Status compares progress with what the company itself said it would do: Working = on track against what the company said; Mixed = partly on track; Behind = behind the company's own plan; New = recently announced; Early = too early to judge.
17The company's own measures (non-GAAP)
17The company's own measures · FY2025 and Q3 FY2026
What do Roper Technologies' own measures show?
Official (GAAP): Net income, FY2025
$1.5B
Company's own measure: Adjusted EBITDA, FY2025
$3.1B
Adds back taxes, interest, depreciation and amortization, then removes $25 million of minority-investment gains (mainly Indicor) and adds $9 million of deal costs.
Official (GAAP): Net margin, FY2025
19.4%
Company's own measure: Adjusted EBITDA margin, FY2025
39.8%
Adjusted EBITDAOperating profit before wear-and-tear charges (depreciation and amortization). As a margin: per $100 of sales. as a share of revenue, as Roper reports it; it was 40.2% in FY2024.
Official (GAAP): Diluted EPS, FY2025
$14.20
Company's own measure: Adjusted diluted EPS, FY2025
$20.00
Also adds back amortization of acquired intangible assets and removes the Indicor gains.
Official (GAAP): Operating cash flow, FY2025
$2.5B
Company's own measure: Adjusted free cash flow, FY2025
$2.5B
Roper deducts capital expenditures and capitalized software and leaves out taxes paid on divestitures. The numbers table deducts only capital expenditures.
Official (GAAP): Diluted EPS, Q3 FY2026
$4.88
Company's own measure: Adjusted diluted EPS, Q3 FY2026
$5.89
Leaves out a $56 million pre-tax Indicor gain and adds back amortization of acquired intangible assets.
Official (GAAP): Remaining performance obligations, Sep 30, 2026
$5.4B
Company's own measure: Backlog, Sep 30, 2026
$3.5B
In the Q3 FY2026 10-Q, Roper defines backlog as the part of remaining performance obligationsSigned contracts with customers that have not been billed yet. it will recognize as revenue within 12 months. It was $3.17 billion a year earlier.
These are the company's own measures, defined by the company. They are not comparable across companies, and they are not added together. Each sits beside the nearest official (GAAP) figure.
Learn: Non-GAAP measures: what a company's "adjusted" numbers leave out
18Financial strength and debt
18Financial strength · Sep 30, 2026
How much debt does Roper Technologies have?
- Total debt$9.7B
- Cash and investments$311M
- Net debt (debt minus cash)$9.4B
- Net worth (shareholders' money)$19.2B
- Debt to equity
- 0.51×
- $ of debt for every $1 of shareholders' money
- Interest cover
- 6.9×
- how many times operating profit covers interest
- Debt is $8.5 billion of fixed-rate senior notes (bonds), $1.25 billion drawn on the revolving credit line and $16.1 million of other debt, less financing costs. Roper states net debt of $9.41 billion in the Q3 FY2026 10-Q.
- $1.42 billion of debt is due within a year, including $700 million of 3.80% notes due Dec 15, 2026.
- A five-year, $3.5 billion unsecured revolving credit line was signed on Mar 30, 2026. Its covenant (a condition of the loan) keeps total debt at or below 0.65 times total capital.
- Goodwill (the premium paid for acquired businesses) was $21.56 billion at Sep 30, 2026, more than shareholders' equity of $19.17 billion.
- Debt-to-equity, years of operating cash flow (FY2025: $2.54 billion) and interest cover (FY2025 operating income of $2.24 billion over $325 million of net interest) are Cityfort calculations from the Q3 FY2026 10-Q and FY2025 10-K.
- Deferred revenue, money customers paid ahead, was $1.89 billion at Sep 30, 2026.
19Who owns it
19Who owns it · ownership as of Feb 28, 2026
Who owns Roper Technologies?
- Officers and directors (as a group), shares
- 0.8%
Share classes
Holders of 5% or more
From the company's proxy statement (DEF 14A), later Schedule 13G filings and the share counts on its latest annual or quarterly report. Each holder row shows the date of its own filing.
Learn: How to read a proxy statement (DEF 14A): Nvidia's 2026 proxy · Form 4 insider filings: who files, the codes and the footnotes
20What it does with profit
20What it does with profit
What does Roper Technologies do with its profit?
Dividend per share
$3.39FY2025
Dividend paid for each share, by financial year.
$ per share
See the numbers
Buyback · Oct 23, 2025
The board approved buying back up to $3.0 billion of stock.
$3.0B
Buyback · Dec 31, 2025
Repurchased 1.12 million shares for $500 million in Q4 FY2025; there were no buybacks in FY2023 or FY2024.
$500M
Buyback · Apr 23, 2026
Added another $3.0 billion to the buyback authorization in April 2026.
$3.0B
Buyback · Sep 30, 2026
Repurchased 7.865 million shares for $2.72 billion in the first nine months of FY2026, none in Q3; $2.78 billion of the authorization remained.
$2.7B
21Governance signals
21Governance signals
What do Roper Technologies' governance filings show?
- Auditor
- PricewaterhouseCoopers LLP, since 2002
- Auditor changes
- None in the period covered
- Audit qualifications
- None reported
- Related-party dealings
- The 2026 proxy says the Audit Committee reviews and approves transactions with related persons; Roper has not adopted written procedures for this review.
- Credit rating
- No public credit rating found in a search of rating agency sites on Nov 20, 2026
22How it got here
22How it got here
How did Roper Technologies get here?
1981
Milestone
Incorporated in Delaware
The company was incorporated in Delaware on Dec 17, 1981. It was formerly named Roper Industries, Inc. and is now Roper Technologies, Inc.
1992
Milestone
Listed on the stock market
Its IPO was in February 1992. The FY2025 10-K says it has declared a cash dividend in each quarter since then and raised the rate every year.
2022
Business-model change
Sold most of its industrial businesses
In November 2022 it sold a majority stake in its industrial businesses (Indicor) to Clayton, Dubilier & Rice and kept a minority stake.
2022
Milestone
Bought Frontline
About $3.74 billion for Frontline, cloud software for K-12 school administration, on Oct 4, 2022.
2024
Milestone
Bought Procare and Transact
About $1.86 billion for Procare (child-care center software) and about $1.6 billion for Transact (campus payments), which it combined with CBORD.
2025
Milestone
Bought CentralReach and Subsplash
Nine deals cost $3.29 billion, including CentralReach for about $1.85 billion and Subsplash for about $800 million.
2025
Milestone
Started buying back shares
A $3.0 billion buyback was approved in October 2025, after no repurchases in FY2023 or FY2024.
2026
Milestone
Cash from the Indicor stake
Indicor sold its instrumentation businesses to AMETEK on Aug 26, 2026; Roper received $1.24 billion before tax.
23Sources and changes
Where every number on this page comes from
Sources (22 documents)
- S1Form 10-Q for Q3 FY2026 · SEC EDGAR · Tier 1: company or exchange filing · Nov 2, 2026
- S2Form 10-Q for Q2 FY2026 · SEC EDGAR · Tier 1: company or exchange filing · Jul 31, 2026
- S3Form 10-Q for Q1 FY2026 · SEC EDGAR · Tier 1: company or exchange filing · May 1, 2026
- S4Form 10-K for FY2025 · SEC EDGAR · Tier 1: company or exchange filing · Feb 24, 2026
- S5Form 10-Q for Q3 FY2025 · SEC EDGAR · Tier 1: company or exchange filing · Oct 31, 2025
- S6Form 10-Q for Q2 FY2025 · SEC EDGAR · Tier 1: company or exchange filing · Aug 1, 2025
- S7Form 10-Q for Q1 FY2025 · SEC EDGAR · Tier 1: company or exchange filing · May 2, 2025
- S8Form 10-K for FY2024 · SEC EDGAR · Tier 1: company or exchange filing · Feb 24, 2025
- S9Form 10-Q for Q3 FY2024 · SEC EDGAR · Tier 1: company or exchange filing · Nov 1, 2024
- S10Form 10-Q for Q2 FY2024 · SEC EDGAR · Tier 1: company or exchange filing · Aug 1, 2024
- S11Form 10-Q for Q1 FY2024 · SEC EDGAR · Tier 1: company or exchange filing · May 3, 2024
- S12Form 10-K for FY2023 · SEC EDGAR · Tier 1: company or exchange filing · Feb 22, 2024
- S13Form 10-K for FY2022 · SEC EDGAR · Tier 1: company or exchange filing · Feb 27, 2023
- S14Form 10-K for FY2021 · SEC EDGAR · Tier 1: company or exchange filing · Feb 22, 2022
- S152026 proxy statement (DEF 14A) · SEC EDGAR · Tier 1: company or exchange filing · Apr 7, 2026
- S168-K filed Apr 1, 2026: new five-year credit agreement · SEC EDGAR · Tier 1: company or exchange filing · Apr 1, 2026
- S178-K filed Oct 1, 2026: director election · SEC EDGAR · Tier 1: company or exchange filing · Oct 1, 2026
- S18Q3 FY2026 earnings release (8-K Ex. 99.1) · SEC EDGAR · Tier 1: company or exchange filing · Oct 22, 2026
- S19Q2 FY2026 earnings release (8-K Ex. 99.1) · SEC EDGAR · Tier 1: company or exchange filing · Jul 23, 2026
- S20Q1 FY2026 earnings release (8-K Ex. 99.1) · SEC EDGAR · Tier 1: company or exchange filing · Apr 23, 2026
- S21Q4 FY2025 earnings release (8-K Ex. 99.1) · SEC EDGAR · Tier 1: company or exchange filing · Jan 27, 2026
- S25Q4 FY2024 earnings release (8-K Ex. 99.1) · SEC EDGAR · Tier 1: company or exchange filing · Jan 30, 2025
Changes to this page (v1 · Nov 20, 2026)
- v1 · Nov 20, 2026First version. (first version)
Numbers come only from tier 1 and tier 2 sources. Read how we research.
Disclaimer
For learning only. Cityfort is not a registered investment adviser or broker-dealer and does not recommend buying or selling any security. Prices shown are dated and may be out of date.
Investing in securities involves risk, including loss of capital. Before making any investment decision, do your own research and consider consulting a registered investment adviser or other qualified professional.
Cityfort, its owners and contributors may or may not hold securities of companies covered. Cityfort is not paid by any company it covers. Content is not an offer or solicitation to buy or sell any security, including in any initial public offering.
Read the positions policyRead the full disclaimerHide the full disclaimer
Cityfort publishes general educational content that explains how listed companies work. Cityfort is not registered with the US Securities and Exchange Commission or any state securities regulator as an investment adviser, and is not a broker-dealer or a member of FINRA. Cityfort does not provide investment, tax or legal advice, recommendations, ratings, price targets or any opinion on whether to buy, sell or hold any security. Nothing on the site is tailored to any person's circumstances.
All information is taken from publicly available sources, mainly company filings with the SEC, which are listed on each page with dates. We work to keep it accurate and correct errors publicly, but we do not guarantee that it is complete, accurate or up to date. Any market price or price-based ratio shown is dated, may be out of date by the time you read it, and is included only to explain concepts.
Statements by company management, including forward-looking statements and guidance, are reported as the company's statements, with their date and source; they are not our forecasts. Adjusted (non-GAAP) figures are the company's own measures and are shown next to the official (GAAP) figures.