Real Estate · NYSE: PLD
Prologis: how the business works
Prologis owns, builds and manages warehouses in 20 countries and rents them to about 6,500 customers such as Amazon and Home Depot, with FY2025 revenue of $8.8 billion.
By Hardik Bhandare · Checked against filings: . Editorial policy. Corrections
Follow Prologis
Email me when Prologis's page is updated after earnings.
We'll send a confirmation email first. See our privacy policy.
Prologis, Inc. · San Francisco, California
Updated for Q3 FY2026 · checked
- Revenue, FY2025
- $8.8B
- Net income for common stockholders, FY2025
- $3.3B
- Buildings owned and managed, Sep 30, 2026
- 5,492
- Space occupied, owned and managed, Sep 30, 2026
- 95.6%
- Employees, Dec 31, 2025
- 2,802
The short version
Prologis in 5 points
1 · What it sells
Prologis rents out logistics buildings in 20 countries: its owned and managed portfolio had 5,492 buildings with 1.23 billion square feet at Sep 30, 2026, and 95.6% of the space was occupied.
2 · Who pays it
In FY2025, rent from customers such as Amazon and Home Depot made up 92.8% of Prologis's revenue, fees from co-investment ventures 6.7% and development management and other income 0.4%.
3 · What it keeps from $100
Of every $100 that came in during FY2025, including $943.6 million of gains on property sales, Prologis kept $32.7 as net income for common stockholders, while operating income before those gains was $3,414.3 million, 38.8% of revenue.
4 · Where the operating profit comes from
In FY2025, Prologis's Real Estate segment produced $6,187.6 million of net operating income and Strategic Capital $321.8 million, out of $6,509.4 million in total.
5 · The one thing to watch
Interest expense rose from $266.2 million in FY2021 to $1,002.3 million in FY2025, and debt reached $36,832.5 million on Sep 30, 2026.
Sources: From Prologis's FY2025 10-K, Q3 FY2026 10-Q and Q3 FY2026 supplemental package · checked
See the full receipt and the management scorecard below
01Where $100 of a REIT's money goes · FY2025
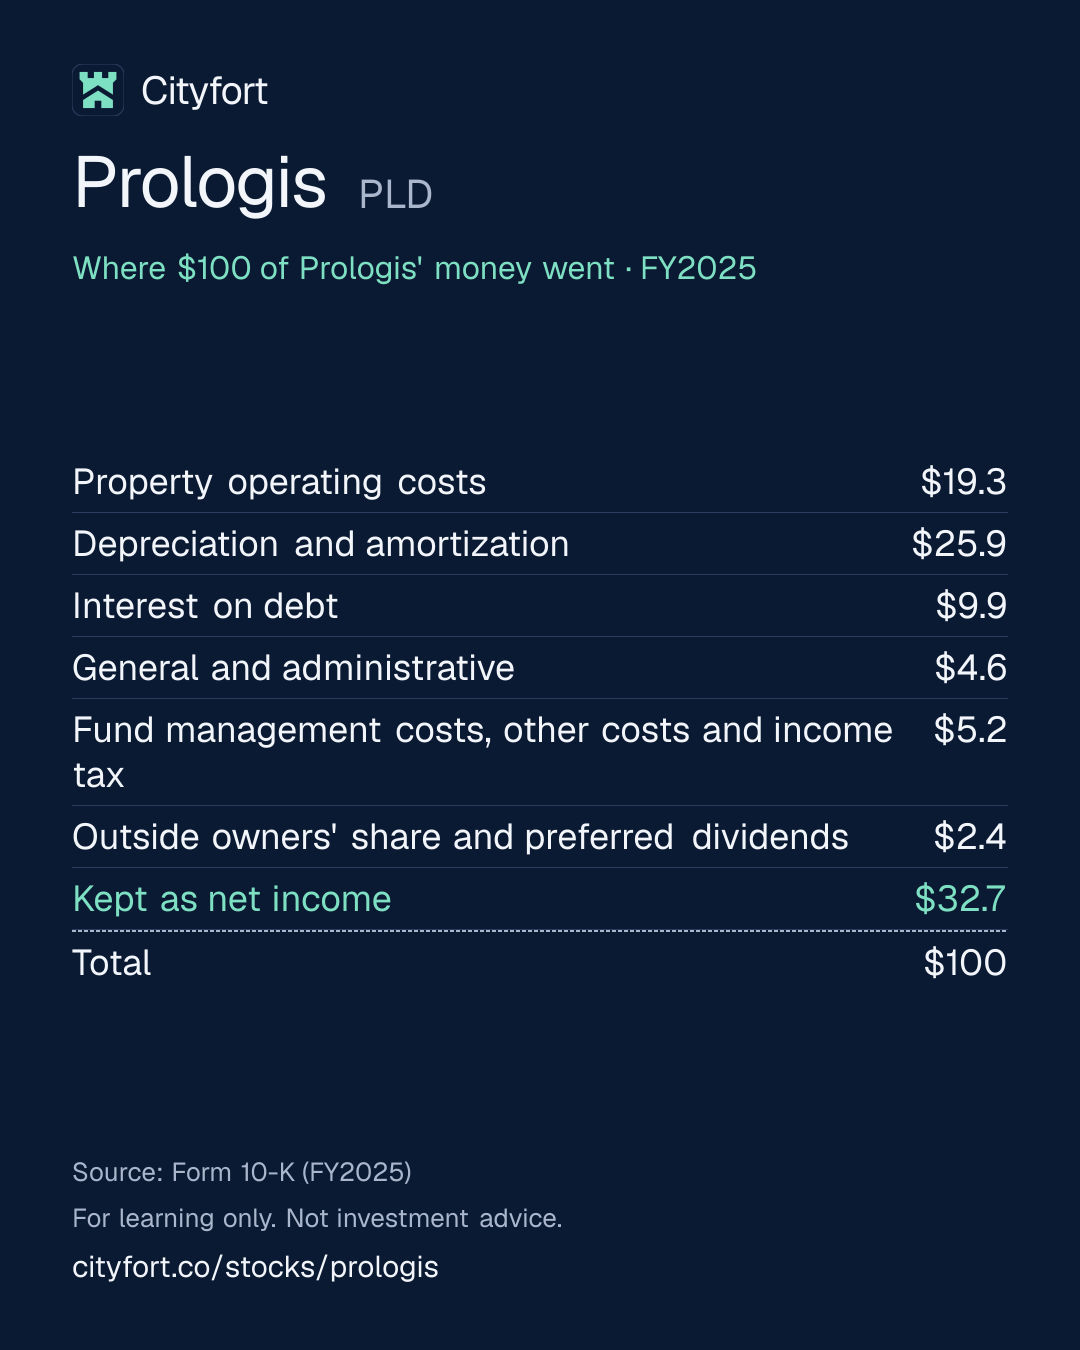
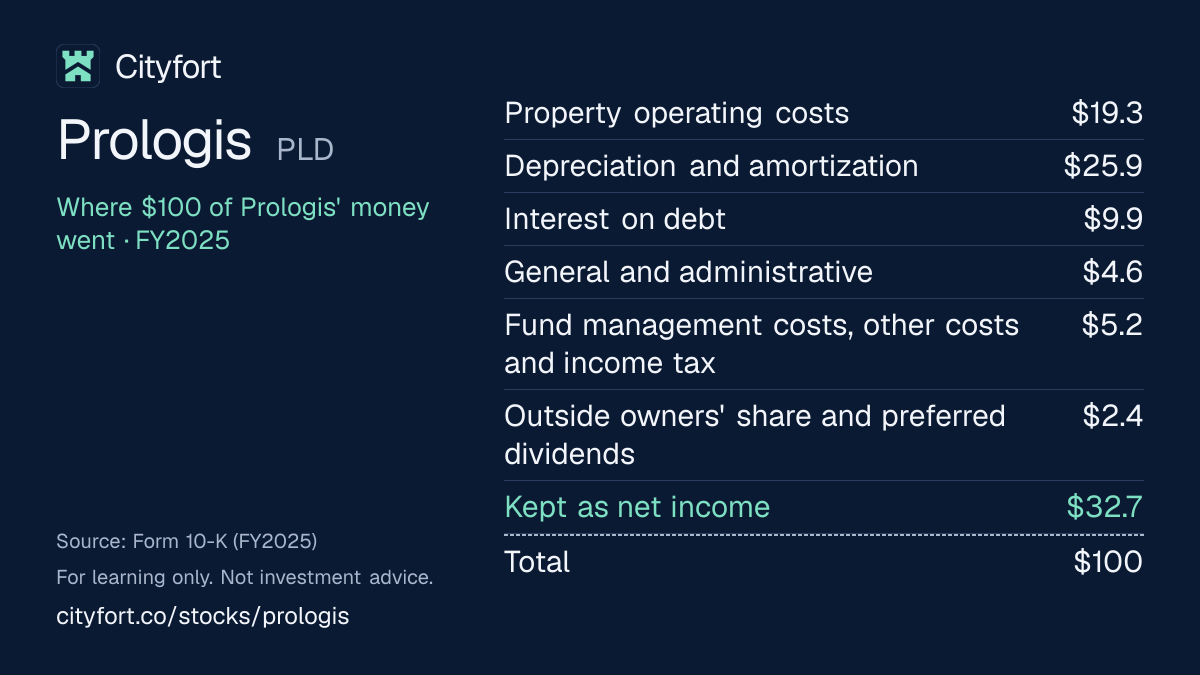
Where does $100 of Prologis' money go?
Prologis · FY2025
Receipt for every $100
| Property operating costs | $19.3 |
|---|---|
| Depreciation and amortization | $25.9 |
| Interest on debt | $9.9 |
| General and administrative | $4.6 |
| Fund management costs, other costs and income tax | $5.2 |
| Outside owners' share and preferred dividends | $2.4 |
| Kept as net income | $32.7 |
| Total | $100 |
Each line = amount ÷ total money in × 100. Lines may not add to exactly $100 because of rounding.
How this is worked out
Cityfort calculation from the FY2025 10-K. Of every $100 that came in (revenue of $8,790.1 million plus $1,360.9 million of gains on real estate sales, earnings from unconsolidated ventures and foreign currency and derivative gains): each line = line ÷ $10,151.0 million × 100.
Save this receipt as an image:
1080 × 1350 PNG for Instagram, LinkedIn1200 × 675 PNG for X
Embed this receipt
Paste this code into a blog or website to show the receipt, with a link back to this page:
Each week: one company explained in 5 points, picked by earnings date.
Free, no tips, unsubscribe anytime.
We'll send a confirmation email. See our privacy policy.
02The business in one line
What does Prologis do?
Companies that store and ship goods pay Prologis rent for its warehouses; the biggest costs are depreciation, property running costs and interest, and in FY2025 net income was $3,322.3 million, helped by $943.6 million of gains on property sales.
- Rent was $8,158.9 million of FY2025 revenue of $8,790.1 million; fees from co-investment ventures made up most of the rest.
- Depreciation took $25.9 and interest $9.9 of every $100 that came in during FY2025.
03Who pays it
Who pays Prologis?
Tenants (rent)
93%
of revenue
About 6,500 customers in the owned and managed portfolio, including Amazon, Home Depot, FedEx, UPS and Walmart, pay rent for warehouse space. Rental revenue was $8,158.9 million in FY2025.
Investors in its co-investment ventures (fees)
7%
of revenue
Institutional investors pay management fees and promotes (performance fees). Strategic capital revenue was $592.4 million in FY2025.
Development management and other
0%
of revenue
Fees for developing buildings for others and other revenue: $38.9 million in FY2025.
- Tenants (rent)93%
- Investors in its co-investment ventures (fees)7%
- Development management and other0%
How spread out the customers are
Shares of revenue are Cityfort calculations from the FY2025 10-K. Customer shares are of net effective rent in the consolidated operating portfolio at Dec 31, 2025, as the 10-K reports them: Amazon 6.3%, the top 10 customers 16.3% and the top 25 23.7%.
- Largest customer
- 6%
- Top 10 customers
- 16%
04Why it makes money
Why does Prologis make money?
It earns rent on warehouses it builds and buys, and fees for managing buildings it owns with investors
Prologis builds or buys warehouses, rents them out and resets rents when leases end. In Q3 FY2026, rent on leases signed was 38.0% above the leases they replaced, a company measure. Development gains and venture fees add to rent, and operating income before gains was $3,414.3 million in FY2025, 38.8% of revenue.
Operating income before gains on real estate sales, US$ million
1,617.43,414.3
FY2021 to FY2025
- Buy land and build warehouses
- Rent them on leases of about five to six years
- Reset rents when leases end
- Sell some buildings to its ventures or others
- Earn fees for managing the ventures
- Put the money into new buildings
↺ Step 6 feeds back into step 1.
05Business segments · FY2025
Which businesses make up Prologis?
Real Estate
93%Renting out and developing logistics buildings. Segment net operating income (revenue minus segment costs) was $6,187.6 million in FY2025.
Revenue $8.2B
Strategic Capital
7%Managing co-investment ventures for institutional investors, for fees and promotes. Segment net operating income was $321.8 million in FY2025.
Revenue $592M
How the mix changed
- Real Estate
- Strategic Capital
Revenue by segment, FY2023 to FY2025.
US$
See the numbers
06The numbers · Consolidated · US$
How has Prologis done?
Rental revenue
$8.2BFY2025
Rental revenue rose every year, from $4,148.0 million in FY2021 to $8,158.9 million in FY2025, helped by the Duke Realty purchase in October 2022.
US$ · rent and related income from tenants, as reported
See the yearly numbers
See the quarterly numbers
Net income per share and FFO per share
$3.56FY2025 net income per share (GAAP)
Net income (GAAP)
FFO (company measure)
Net income was $3.56 per diluted share in FY2025; Nareit FFO, a company measure that adds back real estate depreciation and leaves out gains on property sales, was $5.94 per share (Cityfort calculation from the FY2025 10-K).
Prologis states Nareit-defined FFO only in dollars ($5,680 million in FY2025), not per share. Cityfort calculation from the FY2025 10-K: $5,680 million ÷ 956.8 million diluted shares. Nareit FFO adds back real estate depreciation and leaves out gains on property sales.
$ per diluted share · left: GAAP net income; right: FFO, the company's own measure (non-GAAP), which adds back real estate depreciation
See the numbers
Occupancy
95.6%Sep 30, 2026
Average occupancy in the fourth quarter (owned and managed) fell from 98.0% in FY2022 to 95.3% in FY2025, and the Q3 FY2026 average was 95.1%.
% · occupied by sq ft, owned and managed operating portfolio, ventures at 100%, as reported
See the numbers
When leases end
3.9 yrsaverage lease left
At Dec 31, 2025, leases paying 9.6% of net effective rent in the consolidated portfolio were due to end in 2026 and 14.9% in 2027.
% of net effective rent, consolidated operating portfolio expiring in each year, as reported at Dec 31, 2025
See the numbers
- Properties
- 5,492
- owned at Sep 30, 2026: logistics buildings, owned and managed (including co-investment ventures at 100%)
- Square feet
- 1,229.8 million
- rentable space, as reported
- Average lease left
- 3.9 years
- weighted average remaining lease term, as reported
- Cash same-store NOI growth, Q4 FY2025 (Prologis share)
- 5.7%
- the company's own measure (non-GAAP), FY2025: rent minus property costs at properties owned in both periods
See all yearly numbers
Depreciation spreads the cost of buildings over their lives, so it lowers GAAP net income without cash leaving the company. FFO (funds from operations) adds real estate depreciation back and leaves out gains on property sales; it is the company's own measure, not a GAAP figure, and is shown only beside GAAP net income. Net income is the amount for common stockholders. Fiscal years are the company's own (December 31 (fiscal year = calendar year)).
- Occupancy by year is the average for the fourth quarter and by quarter the quarter's average, both for the owned and managed portfolio, as the earnings releases report them; the portfolio card is the occupied share at Sep 30, 2026.
- Properties by year are consolidated operating buildings (10-K, Note 3); the portfolio card counts owned and managed buildings, including co-investment ventures at 100%.
- Rental revenue grew partly because Prologis bought Duke Realty in an all-stock deal on Oct 3, 2022.
Download Prologis' yearly and quarterly numbers (CSV, with source ids)
Learn: What is FFO? The REIT industry's performance measure, in US filings · Non-GAAP measures: what a company's "adjusted" numbers leave out · What is the dividend payout ratio? Profit paid out, with US companies
Sources (19)
- Prologis Form 10-K for fiscal year 2023
- Prologis Form 10-K for fiscal year 2022
- Prologis Fourth Quarter and Full Year 2021 Earnings Results (8-K Ex. 99.2)
- Prologis Reports Strong Fourth Quarter and Full Year 2022 Earnings (8-K Ex. 99.2)
- Prologis, Inc. and Prologis, L.P. Form 10-K for fiscal year 2025
- Prologis Reports Fourth Quarter and Full Year 2023 Results (8-K Ex. 99.2)
- Prologis Form 10-K for fiscal year 2024
- Prologis Reports Fourth Quarter and Full Year 2024 Results (8-K Ex. 99.2)
- Prologis Reports Fourth Quarter and Full Year 2025 Results (8-K Ex. 99.2)
- Prologis Supplemental Information, Fourth Quarter 2025 (8-K Ex. 99.1)
- Prologis Supplemental Information, First Quarter 2026 (8-K Ex. 99.1)
- Prologis Reports First Quarter 2025 Results (8-K Ex. 99.2)
- Prologis Supplemental Information, Second Quarter 2026 (8-K Ex. 99.1)
- Prologis Reports Second Quarter 2025 Results (8-K Ex. 99.2)
- Prologis Supplemental Information, Third Quarter 2026 (8-K Ex. 99.1)
- Prologis Reports Third Quarter 2025 Results (8-K Ex. 99.2)
- Prologis Reports First Quarter 2026 Results (8-K Ex. 99.2)
- Prologis Reports Second Quarter 2026 Results (8-K Ex. 99.2)
- Prologis Reports Third Quarter 2026 Results (8-K Ex. 99.2)
07Who runs it
Who runs Prologis, and did they deliver?
Daniel S. Letter
Chief Executive Officer · since 2026
CEO since Jan 1, 2026; president from January 2023 to December 2025, and with Prologis since 2004.
Hamid R. Moghadam
Executive Chairman · since 2026
Co-founder; CEO until December 2025 and executive chairman from Jan 1, 2026.
Timothy D. Arndt
Chief Financial Officer
What they said, and what happened
2 delivered · 2 too early to tell
Said on Jan 21, 2025
Prologis's Q4 FY2024 earnings release set a 2025 average occupancy range of 94.50% to 95.50%.
DeliveredWhat happened
Average occupancy was between 94.7% and 95.3% in each quarter of 2025, both owned and managed and at Prologis's share.
Said on Jan 21, 2025
Prologis's Q4 FY2024 earnings release set a 2025 range for cash same-store NOI growth, a company measure, of 4.00% to 5.00%.
DeliveredWhat happened
Quarterly cash same-store NOI growth (Prologis share) was 6.2%, 4.9%, 5.2% and 5.7% in 2025, within or above the range in every quarter; the releases used give no full-year figure.
Said on Oct 15, 2026
Prologis expects 2026 net earnings per diluted share of $4.05 to $4.15 (cut from $4.40 to $4.55).
Too early to tellWhat happened
Net earnings per diluted share were $3.04 for the first nine months of 2026 ($1.05, $1.13 and $0.86).
Said on Oct 28, 2026
Prologis expects the SEGRO acquisition to close in the first half of 2027.
Too early to tellWhat happened
SEGRO shareholders approved the offer on Sep 28, 2026; regulatory approvals and court sanction were still needed.
Sources (12)
- Prologis 2026 proxy statement (DEF 14A)
- Prologis Reports Third Quarter 2026 Results (8-K Ex. 99.2)
- Prologis Reports Fourth Quarter and Full Year 2024 Results (8-K Ex. 99.2)
- Prologis Reports First Quarter 2025 Results (8-K Ex. 99.2)
- Prologis Reports Second Quarter 2025 Results (8-K Ex. 99.2)
- Prologis Reports Third Quarter 2025 Results (8-K Ex. 99.2)
- Prologis Reports Fourth Quarter and Full Year 2025 Results (8-K Ex. 99.2)
- Prologis Supplemental Information, First Quarter 2026 (8-K Ex. 99.1)
- Prologis Supplemental Information, Second Quarter 2026 (8-K Ex. 99.1)
- Prologis Supplemental Information, Third Quarter 2026 (8-K Ex. 99.1)
- Prologis Form 10-Q for the quarter ended September 30, 2026 (Q3 FY2026)
- Prologis 8-K filed Aug 4, 2026: SEGRO offer (Rule 2.7 announcement), Co-operation Agreement, term loan
08What could go wrong
What could go wrong for Prologis?
- Debt
Interest costs and refinancing
Interest expense rose from $266.2 million in FY2021 to $1,002.3 million in FY2025. Debt was $36,832.5 million at Sep 30, 2026, with $2,045.7 million of principal due in 2027.
Watch The weighted average interest rate (3.2% at Sep 30, 2026) and new bond rates in each 10-Q.
- Demand
Occupancy and demand for warehouses
Average occupancy in the fourth quarter (owned and managed) fell from 98.0% in FY2022 to 95.3% in FY2025. The 10-K names its focus on the logistics sector and customer defaults as risks.
Watch Average occupancy each quarter (95.1% in Q3 FY2026).
- Concentration
California concentration
California (Central Valley, San Francisco Bay Area and Southern California markets) made up 30.6% of consolidated operating properties by gross book value at Dec 31, 2025; Southern California is the only market at 10% or more of total assets or revenue, and the 10-K names geographic concentration as a risk.
Watch The share of operating properties in California and the Southern California market figures in each 10-K.
- Execution
SEGRO acquisition
The pending SEGRO offer would issue new Prologis shares and add a London listing, and Prologis arranged a £3.6 billion ($4.7 billion) term loan for its cash part. Closing needs regulatory approvals and court sanction.
Watch Closing, expected in the first half of 2027, and the final number of new shares.
- Other
Profit depends partly on property sales
Gains on real estate sales were $943.6 million in FY2025, down from $1,589.6 million in FY2021, and they move net income from year to year.
Watch Gains on real estate transactions each quarter ($108.0 million in Q3 FY2026).
- Currency
Foreign currencies
Revenue in currencies other than the US dollar was $697 million in FY2025, 7.9% of revenue, and the 10-K names currency moves as a risk.
Watch Foreign currency and derivative gains or losses each quarter.
Sources (8)
- Prologis Form 10-K for fiscal year 2023
- Prologis, Inc. and Prologis, L.P. Form 10-K for fiscal year 2025
- Prologis Form 10-Q for the quarter ended September 30, 2026 (Q3 FY2026)
- Prologis Reports Strong Fourth Quarter and Full Year 2022 Earnings (8-K Ex. 99.2)
- Prologis Reports Fourth Quarter and Full Year 2025 Results (8-K Ex. 99.2)
- Prologis Reports Third Quarter 2026 Results (8-K Ex. 99.2)
- Prologis 8-K filed Aug 4, 2026: SEGRO offer (Rule 2.7 announcement), Co-operation Agreement, term loan
- Prologis Supplemental Information, Third Quarter 2026 (8-K Ex. 99.1)
09Both sides
What do supporters and critics point to?
What supporters point to
- Rental revenue rose every year, from $4,148.0 million in FY2021 to $8,158.9 million in FY2025.
- Rent on leases signed in Q3 FY2026 was 38.0% above the leases they replaced (net effective, Prologis share), a company measure.
- The Q3 FY2026 10-Q states ratings of A (S&P) and A2 (Moody's), both stable, and the weighted average rate on debt was 3.2%.
- Amazon, the largest customer, paid 6.3% of net effective rent at Dec 31, 2025, and the top 25 customers paid 23.7%.
What critics point to
- Interest expense rose from $266.2 million in FY2021 to $1,002.3 million in FY2025.
- Average occupancy in the fourth quarter (owned and managed) fell from 98.0% in FY2022 to 95.3% in FY2025.
- Net income includes gains on real estate sales that vary: $1,589.6 million in FY2021 and $943.6 million in FY2025.
- Shares outstanding rose from 929.2 million at Dec 31, 2025 to 950.4 million at Sep 30, 2026, and the SEGRO offer would issue more.
- California (Central Valley, San Francisco Bay Area and Southern California markets) made up 30.6% of consolidated operating properties by gross book value at Dec 31, 2025; Southern California is the only market at 10% or more of total assets or revenue.
10What to watch next
What should you watch next at Prologis?
Next event
Q4 FY2026 results
Date not announced yet.
SEGRO closing
Prologis expects the SEGRO acquisition to close in the first half of 2027, subject to other conditions including regulatory approvals, as the Q3 FY2026 10-Q states; the Aug 4, 2026 8-K lists the court's sanction of the scheme as a condition.
Occupancy
Prologis guided 2026 average occupancy (Prologis share) of 95.25% to 95.50% on Oct 15, 2026; the Q3 FY2026 average was 95.1%.
Debt and interest
Debt was $36,832.5 million at Sep 30, 2026 at a 3.2% weighted average rate, with $2,045.7 million of principal due in 2027.
New shares
Sales under the $5.0 billion at-the-market program set up on Oct 30, 2026, reported in each 10-Q.
11Key dates
What are the key dates for Prologis?
| Event | Date | Source |
|---|---|---|
| SEGRO acquisition expected to closeExpected in the first half of 2027, as the Q3 FY2026 10-Q states. | Not yet stated | Prologis Form 10-Q for the quarter ended September 30, 2026 (Q3 FY2026) |
12Key facts
Key facts about Prologis
- What does Prologis do?
- Prologis owns, develops and manages logistics buildings (warehouses) in 20 countries; its owned and managed portfolio, which includes buildings held in co-investment ventures, had 5,492 buildings with 1.23 billion square feet at Sep 30, 2026.
- How does Prologis make money?
- Prologis makes most of its money from rent: rental revenue was $8,158.9 million of its $8,790.1 million of FY2025 revenue (92.8%), and fees from co-investment ventures made up most of the rest.
- What is Prologis's business model?
- Prologis builds or buys warehouses, rents them on leases that averaged 70 months at signing in 2025, sells some buildings at a gain, and earns fees for managing buildings it owns together with institutional investors.
- Is Prologis profitable?
- Yes. Prologis reported net income for common stockholders of $3,322.3 million, or $3.56 per diluted share, in FY2025, including $943.6 million of gains on real estate sales; its operating income before those gains was $3,414.3 million.
- What is Prologis's revenue by segment?
- In FY2025, Prologis's Real Estate segment had revenue of $8,197.8 million (93.3%) and its Strategic Capital segment, which manages co-investment ventures for investors, $592.4 million (6.7%); segment net operating income totaled $6,509.4 million.
- Who are Prologis's customers?
- Prologis had about 6,500 customers in its owned and managed portfolio at Dec 31, 2025; Amazon was the largest, paying 6.3% of net effective rent in the consolidated portfolio, and the top 25 customers paid 23.7%.
- Who owns Prologis?
- Prologis is widely held: BlackRock reported 10.0% in a filing of Jun 4, 2026, Vanguard Capital Management 7.52% and Vanguard Portfolio Management 5.79% in April 2026 filings, and officers and directors as a group held 0.53% on Mar 6, 2026.
- What is Prologis's FFO?
- Prologis reported GAAP net income of $3.56 per diluted share in FY2025 and Core FFOFunds from operations: a REIT's own measure that adds building depreciation back to net income. Not a GAAP figure; read it next to net income., its own non-GAAPThe company's own "adjusted" numbers, not the official (GAAP) ones. Always read them next to the official figure. Learn more measure that adds back real estate depreciation and leaves out gains on property sales, of $5.81 per diluted share.
- How much debt does Prologis have?
- Prologis had $36,832.5 million of debt at Sep 30, 2026, at a weighted average interest rate of 3.2%, and the Q3 FY2026 10-Q states ratings of A from S&P and A2 from Moody's.
- Does Prologis build data centers?
- Prologis had data centers with a total expected investment of $686 million under development in its owned and managed portfolio at Dec 31, 2025, alongside its warehouses.
Sources (8)
- Prologis, Inc. and Prologis, L.P. Form 10-K for fiscal year 2025
- Prologis Supplemental Information, Third Quarter 2026 (8-K Ex. 99.1)
- Schedule 13G/A by BlackRock, Inc. on Prologis common stock
- Schedule 13G by Vanguard Capital Management on Prologis common stock
- Schedule 13G by Vanguard Portfolio Management on Prologis common stock
- Prologis 2026 proxy statement (DEF 14A)
- Prologis Reports Fourth Quarter and Full Year 2025 Results (8-K Ex. 99.2)
- Prologis Form 10-Q for the quarter ended September 30, 2026 (Q3 FY2026)
Terms on this page
- Customer concentration
- Earnings per share (EPS)
- FFO (funds from operations)
- Market cap
- Net margin
- P/E ratio
- Revenue vs net income
Each explains the term in plain English, with the same number from other companies on Cityfort.
Go deeper
More detail from the same filings. Open any section.
13What it sells
13What it sells
What does Prologis sell?
Warehouse rental
Logistics buildings used for distribution, storage, packaging, assembly and light manufacturing, rented to about 6,500 customers. Rental revenue was $8,158.9 million in FY2025.
Development
Prologis buys land, builds new buildings and sells some of them, booking $257.7 million of gains on development properties and land in FY2025.
Strategic capital (fund management)
Ventures that own buildings alongside Prologis, with 159 investors in the private ventures and three listed vehicles in Japan, China and Mexico. Strategic capital revenue was $592.4 million in FY2025.
Data centers and energy
Data centers with a total expected investment of $686 million under development, and 1.1 GW of solar and storage on its buildings, at Dec 31, 2025.
Think of it like this
Like a landlord for warehouses: customers such as Amazon and Home Depot rent the space to hold and ship goods, and Prologis owns and looks after the buildings.
What it does
- Does: Rents logistics buildings in 20 countries on four continents
- Does: Builds new buildings and sells some of them
- Does: Manages co-investment ventures for institutional investors, for fees
What it does not do
- Does not: Run the warehouses or move the goods; its customers do
- Does not: Rent out offices, stores or homes; its buildings are logistics facilities
- Does not: Sign very long leases: leases that started in 2025 averaged 70 months
14How the money flows
14How the money flows · FY2025
How does money flow through Prologis?
Money in
- Rent from customers$8.2B
- Fees from co-investment ventures and other revenue$631M
- Gains on property sales, earnings from ventures and other gains$1.4B
The company
Prologis
$10.2B came in
Money out
- Property operating costs$2.0B
- Depreciation and amortization$2.6B
- Interest on debt$1.0B
- General and administrative$469M
- Fund management costs, other costs and income tax$524M
- Outside owners' share and preferred dividends$243M
- Net income for common stockholders$3.3B
- Customers rent warehouses from Prologis, paying $8,158.9 million of rent in FY2025.
- Investors in its co-investment ventures pay fees, part of $631.2 million of other revenue.
- Prologis also books gains when it sells buildings and land: $943.6 million in FY2025.
- Property running costs, depreciation of the buildings and interest on debt take the largest shares.
- After tax and the shares of outside owners, $3,322.3 million was left as net income for common stockholders.
15What it needs to run
15What it needs to run
What does Prologis need to run?
Land and buildings
Investments in real estate on the balance sheet were $98,759.9 million before depreciation at Sep 30, 2026, up from $53,005.2 million at Dec 31, 2021.
Borrowed money and new shares
Debt was $36,832.5 million at Sep 30, 2026, and Prologis sold 17.25 million new shares in August 2026 for about $2.4 billion. Available liquidity was about $8.8 billion.
Partners' money
Co-investment ventures with institutional investors own many of the buildings Prologis manages; Prologis's stakes in them range from 15% to 55%.
People
2,802 employees at Dec 31, 2025: 1,649 in the U.S., 657 in Europe, 286 in Asia and 210 in the rest of the Americas.
16Where growth could come from
16Where growth could come from
Where could Prologis' growth come from?
Prologis said in its Q3 FY2026 earnings release (Oct 15, 2026) that it expects 2026 net earnings per diluted share of $4.05 to $4.15, down from $4.40 to $4.55 earlier, and Core FFO, its own measure, of $6.25 to $6.29 per share. It labels this guidance a profit forecast under the UK Takeover Code because of the SEGRO offer.
Higher rent when leases end
Working38.0% rent change, Q3 FY2026
Rent on leases signed in Q3 FY2026 was 38.0% above the leases they replaced (net effective, Prologis share), a company measure. Prologis estimated its leases were about 16% below market rent at Sep 30, 2026, down from 18% at Dec 31, 2025.
Status: Working, on track against what the company said.
Development
Mixed$257.7M development gains, FY2025
Gains on selling development properties and land fell from $817.0 million in FY2021 to $257.7 million in FY2025. Prologis guided 2026 development starts of $5.0 billion to $5.75 billion on Oct 15, 2026.
Status: Mixed, partly on track.
Data centers
Early$686M under development, Dec 31, 2025
Data centers with a total expected investment of $686 million were under development. Prologis said on Jan 21, 2026 that 5.7 GW of power was secured or in advanced stages of procurement.
Status: Early, too early to judge.
SEGRO acquisition
New0.0920 Prologis shares per SEGRO share
SEGRO shareholders approved Prologis's offer on Sep 28, 2026. The Q3 FY2026 10-Q says closing is expected in the first half of 2027, subject to other conditions including regulatory approvals; the Aug 4, 2026 8-K lists the court's sanction of the scheme as a condition.
Status: New, recently announced.
Status compares progress with what the company itself said it would do: Working = on track against what the company said; Mixed = partly on track; Behind = behind the company's own plan; New = recently announced; Early = too early to judge.
Sources (7)
- Prologis Reports Third Quarter 2026 Results (8-K Ex. 99.2)
- Prologis Supplemental Information, Third Quarter 2026 (8-K Ex. 99.1)
- Prologis Form 10-Q for the quarter ended September 30, 2026 (Q3 FY2026)
- Prologis, Inc. and Prologis, L.P. Form 10-K for fiscal year 2025
- Prologis Form 10-K for fiscal year 2023
- Prologis Reports Fourth Quarter and Full Year 2025 Results (8-K Ex. 99.2)
- Prologis 8-K filed Aug 4, 2026: SEGRO offer (Rule 2.7 announcement), Co-operation Agreement, term loan
17The company's own measures (non-GAAP)
17The company's own measures · FY2025
What do Prologis' own measures show?
Official (GAAP): Net income per diluted share
$3.56
Company's own measure: Nareit FFO per share (Cityfort calculation)
$5.94
Prologis states Nareit-defined FFO only in dollars ($5,680 million in FY2025), not per share. Cityfort calculation from the FY2025 10-K: $5,680 million ÷ 956.8 million diluted shares. Nareit FFO adds back real estate depreciation and leaves out gains on property sales.
Official (GAAP): Net income per diluted share
$3.56
Company's own measure: Core FFO per diluted share
$5.81
Prologis's own measure, as its earnings releases state it. It starts from Nareit FFO and also leaves out development gains, foreign currency and derivative items, deferred taxes and debt repayment costs. It includes promotes (performance fees); without net promote income it was $5.86 in FY2025.
Official (GAAP)
No official figure measures this; it is the company's own operating measure.
Company's own measure: Cash same-store NOI growth, Q4 FY2025 (Prologis share)
5.7%
Prologis's own measure: the change in cash rent minus property costs at buildings owned in both periods, Q4 FY2025 against Q4 FY2024. The 2025 quarters were 6.2%, 4.9%, 5.2% and 5.7%; Prologis does not state a full-year figure.
These are the company's own measures, defined by the company. They are not comparable across companies, and they are not added together. Each sits beside the nearest official (GAAP) figure.
Learn: Non-GAAP measures: what a company's "adjusted" numbers leave out
Sources (10)
- Prologis Form 10-K for fiscal year 2022
- Prologis Form 10-K for fiscal year 2023
- Prologis, Inc. and Prologis, L.P. Form 10-K for fiscal year 2025
- Prologis Fourth Quarter and Full Year 2021 Earnings Results (8-K Ex. 99.2)
- Prologis Reports Strong Fourth Quarter and Full Year 2022 Earnings (8-K Ex. 99.2)
- Prologis Reports Fourth Quarter and Full Year 2023 Results (8-K Ex. 99.2)
- Prologis Reports Fourth Quarter and Full Year 2025 Results (8-K Ex. 99.2)
- Prologis Reports First Quarter 2025 Results (8-K Ex. 99.2)
- Prologis Reports Second Quarter 2025 Results (8-K Ex. 99.2)
- Prologis Reports Third Quarter 2025 Results (8-K Ex. 99.2)
18Financial strength: debt and when it is due
18Financial strength · Sep 30, 2026
How much does Prologis owe, and when is it due?
Debt due each year, US$
See the numbers
- Total debt
- $36.8B
- borrowings on the balance sheet, as reported
- Cash
- $2.3B
- cash and cash equivalents
- Net debt
- $34.6B
- Cityfort calculation from the FY2025 10-K: total debt − cash
- Fixed-rate share
- 96.0%
- share of debt at fixed interest rates, as reported
- Average interest rate
- 3.2%
- weighted average rate on the debt, as reported
Maturities are principal ($37,350.5 million in total), above the $36,832.5 million carrying value because of discounts and issuance costs; the fixed-rate share is a Cityfort calculation from the Q3 FY2026 10-Q ($35.9 billion fixed of $37.4 billion). Co-investment ventures carry their own $19.7 billion of debt (Dec 31, 2025), not included here.
Figures at Sep 30, 2026, consolidated, as reported by the company in its 10-K or 10-Q; see the dates on each source.
Learn: What is net debt? Debt minus cash, with real US companies · How to read a 10-K in 10 minutes
19Who owns it
19Who owns it · ownership as of Mar 6, 2026
Who owns Prologis?
- Officers and directors (as a group), shares
- 0.5%
Share classes
Holders of 5% or more
From the company's proxy statement (DEF 14A), later Schedule 13G filings and the share counts on its latest annual or quarterly report. Each holder row shows the date of its own filing.
Insider trades · Form 4 data as of Nov 6, 2026
What did Prologis' insiders report trading?
Prologis' insiders made 72 Form 4A filing an insider must make within two business days of buying or selling the company's shares. Learn more filings in the 12 months to Nov 6, 2026.
They reported 1 purchase (13 shares) and 9 sales (134,329 shares) in the open market or privately (codes P and S).
3 of the 9 sales were on forms with the Rule 10b5-1 plan box checked.
The same filings report 12 other share transactions (M: 6, G: 3, A: 1, C: 1, F: 1).
They also report 110 transactions in options, stock units or other derivatives.
Insiders are a company's officers, directors and owners of more than 10% of a class of its shares. Most changes in their holdings must be reported to the SEC on a Form 4 within two business days. Source: SEC Form 4 filings on EDGAR.
- P
- a purchase in the open market or privately
- S
- a sale in the open market or privately
- A
- a grant, award or other acquisition from the company under Rule 16b-3
- F
- shares withheld or handed over to pay an exercise price or tax when an award is received, exercised or vests
- M
- exercise or conversion of an option or other derivative, exempt under Rule 16b-3
- C
- conversion of a derivative security
- G
- a bona fide gift
Code meanings: General Instruction 8 of Form 4 (SEC).
All 22 transactions
Shares: A = acquired, D = disposed of. A price the filing gives only in a footnote shows as “See filing”. The 10b5-1 box is checked when at least one trade on the form was made under a Rule 10b5-1 plan. A Form 4/A replaces the form it amends. See all of Prologis' Form 4 filings on EDGAR.
Learn: How to read a proxy statement (DEF 14A): Nvidia's 2026 proxy · Form 4 insider filings: who files, the codes and the footnotes · Rule 10b5-1 trading plans: how insiders pre-schedule their trades
Sources (6)
- Prologis Form 10-Q for the quarter ended September 30, 2026 (Q3 FY2026)
- Prologis 2026 proxy statement (DEF 14A)
- Schedule 13G/A by BlackRock, Inc. on Prologis common stock
- Schedule 13G by Vanguard Capital Management on Prologis common stock
- Schedule 13G/A by The Vanguard Group on Prologis common stock (0%)
- Schedule 13G by Vanguard Portfolio Management on Prologis common stock
20What it does with profit
20What it does with profit
What does Prologis do with its profit?
Dividend per share
$4.04FY2025
Dividend paid for each share, by financial year.
$ per share
See the numbers
Money raised · Aug 7, 2026
Sold 17.25 million new common shares in an underwritten offering for about $2.4 billion of net proceeds.
$2.4B
21Governance signals
21Governance signals
What do Prologis' governance filings show?
- Auditor
- KPMG LLP
- Auditor changes
- None in the period covered
- Audit qualifications
- None reported
- Related-party dealings
- This page does not summarize related-party transactions: the related-person section of the 2026 proxy statement was not reviewed for it.
- Credit rating
- S&P Global Ratings and Moody's (as stated in the Q3 FY2026 10-Q) A (S&P) / A2 (Moody's) (Stable at both), Sep 30, 2026
A credit rating describes the company's ability to repay debt. It is not a rating of the share.
Flags to know about
disclosure
No published Nareit FFO per share
Prologis states Nareit-defined FFO in dollars and Core FFO per share, but not Nareit FFO per share; the per-share figure on this page is a Cityfort calculation from the 10-K.
disclosure
Occupancy is reported on different bases
Earnings releases give average occupancy for the owned and managed portfolio, which counts co-investment ventures at 100%, while the FY2024 and FY2025 10-Ks give year-end occupancy at Prologis's own share. This page uses the owned and managed basis.
other
Ways the share count can rise
Prologis sold 17.25 million new shares in August 2026, set up a $5.0 billion at-the-market program on Oct 30, 2026, and the SEGRO offer would issue new shares, leaving SEGRO holders with about 8.9% to 11.5% of the combined group. Units of Prologis, L.P. can also be exchanged for shares.
other · Jan 1, 2026
CEO handover
Daniel S. Letter became CEO on Jan 1, 2026; co-founder Hamid R. Moghadam became executive chairman.
other · Jun 29, 2026
New director
Alfred F. Kelly, Jr. was appointed to the board on Jun 29, 2026.
other
Legal proceedings
The FY2025 10-K and Q3 FY2026 10-Q describe legal matters as arising in the ordinary course of business and none as material.
disclosure
What the filings used do not break out
This page has no earnings call transcripts or investor slides. Prologis does not state an annual same-store NOI figure or a payout ratio, and its chart of customers by type of goods is an image without figures.
Sources (8)
- Prologis, Inc. and Prologis, L.P. Form 10-K for fiscal year 2025
- Prologis 2026 proxy statement (DEF 14A)
- Prologis Form 10-Q for the quarter ended September 30, 2026 (Q3 FY2026)
- Prologis Form 10-K for fiscal year 2024
- Prologis Reports Fourth Quarter and Full Year 2025 Results (8-K Ex. 99.2)
- Prologis 8-K filed Oct 30, 2026: $5.0 billion at-the-market equity program
- Prologis 8-K filed Aug 4, 2026: SEGRO offer (Rule 2.7 announcement), Co-operation Agreement, term loan
- Prologis 8-K filed Jul 1, 2026: Alfred F. Kelly, Jr. appointed director
22What the market paid
22What the market paid · price as of Nov 5, 2026
What did the market pay for Prologis on Nov 5, 2026?
Price as of Nov 5, 2026 (shown for education; prices change daily).
Price as of Nov 5, 2026: a $128.55 close, from Nasdaq's historical price table for PLD; Prologis's shares are listed on the NYSE. Market value = $128.55 × 950,513,000 shares (10-Q cover, Oct 26, 2026) = $122,188 million (Cityfort calculation from the Nov 5, 2026 closing price and the Q3 FY2026 10-Q). P/E is price ÷ earnings per share: 36.1 on FY2025 EPS of $3.56 (Cityfort calculation from the FY2025 10-K), and 28.4 on the $4.53 of EPS in the four quarters to Sep 30, 2026 (Cityfort calculation from the Q4 FY2025 to Q3 FY2026 supplemental packages). EPS includes gains on real estate sales. Dividend yield = $4.28 (4 × the $1.07 Q3 FY2026 dividend) ÷ $128.55 = 3.33% (Cityfort calculation from the Q3 FY2026 10-Q).
- Share price
- $128.55
- Market value (market cap)
- $122.2B
- P/E
- 36.1×
More price-based ratios · as of Nov 5, 2026
Each ratio divides a number from the company's filings by the market value or share price on Nov 5, 2026. Prices change daily, so these ratios do too.
Price to sales (P/S)
13×
$122.2B market value ÷ $9.4B revenue (four quarters to Sep 30, 2026) = 13×
Cityfort calculation from the Nov 5, 2026 closing price and the Q4 FY2025 to Q3 FY2026 earnings releases. Source: PLD historical prices, Oct 6 to Nov 5, 2026 (Nasdaq.com historical table; PLD is listed on the NYSE); Prologis Form 10-Q for the quarter ended September 30, 2026 (Q3 FY2026); Prologis, Inc. and Prologis, L.P. Form 10-K for fiscal year 2025 and 4 more
How price ratios work
Shares used for the market value: 950.51 million ($128.55 × 950.51 million shares ≈ $122.2B). Source: Prologis Form 10-Q for the quarter ended September 30, 2026 (Q3 FY2026); Prologis 2026 proxy statement (DEF 14A)
Source: PLD historical prices, Oct 6 to Nov 5, 2026 (Nasdaq.com historical table; PLD is listed on the NYSE); Prologis Form 10-Q for the quarter ended September 30, 2026 (Q3 FY2026); Prologis, Inc. and Prologis, L.P. Form 10-K for fiscal year 2025 and 4 more
Sources (8)
- PLD historical prices, Oct 6 to Nov 5, 2026 (Nasdaq.com historical table; PLD is listed on the NYSE)
- Prologis Form 10-Q for the quarter ended September 30, 2026 (Q3 FY2026)
- Prologis, Inc. and Prologis, L.P. Form 10-K for fiscal year 2025
- Prologis Supplemental Information, Fourth Quarter 2025 (8-K Ex. 99.1)
- Prologis Supplemental Information, First Quarter 2026 (8-K Ex. 99.1)
- Prologis Supplemental Information, Second Quarter 2026 (8-K Ex. 99.1)
- Prologis Supplemental Information, Third Quarter 2026 (8-K Ex. 99.1)
- Prologis 2026 proxy statement (DEF 14A)
23How it got here
23How it got here
How did Prologis get here?
1997
Milestone
Listed as AMB Property Corporation
The company that became Prologis listed its shares in 1997 and has been a REIT since then.
2011
Business-model change
Merger with ProLogis
AMB merged with ProLogis, and the combined company took the Prologis name.
2022
Business-model change
Duke Realty bought for shares
On Oct 3, 2022 Prologis bought Duke Realty in an all-stock deal, adding 494 operating properties with 144 million square feet; its share count rose from 739.8 million to 923.1 million.
2023
Milestone
Peak in fund fees
Strategic capital revenue reached $1,200.2 million in FY2023 on promotes (performance fees), then fell to $671.9 million in FY2024.
2025
Milestone
China listing
China AMC Prologis Logistics REIT listed in Shenzhen in December 2025, with Prologis owning 20.7%.
2026
Milestone
New CEO
Daniel S. Letter became CEO on Jan 1, 2026, and co-founder Hamid R. Moghadam became executive chairman.
2026
Business-model change
Offer for SEGRO
SEGRO's board rejected an all-share proposal in June 2026; a recommended offer followed on Aug 4, 2026, and SEGRO shareholders approved it on Sep 28, 2026.
Sources (8)
- Prologis, Inc. and Prologis, L.P. Form 10-K for fiscal year 2025
- Prologis 2026 proxy statement (DEF 14A)
- Prologis Form 10-K for fiscal year 2022
- Prologis Form 10-K for fiscal year 2023
- Prologis Reports Fourth Quarter and Full Year 2023 Results (8-K Ex. 99.2)
- Prologis 8-K filed Jun 24, 2026: indicative all-share proposal to SEGRO
- Prologis 8-K filed Aug 4, 2026: SEGRO offer (Rule 2.7 announcement), Co-operation Agreement, term loan
- Prologis Form 10-Q for the quarter ended September 30, 2026 (Q3 FY2026)
24Sources and changes
Where every number on this page comes from
Sources (30 documents)
- S1Prologis, Inc. and Prologis, L.P. Form 10-K for fiscal year 2025 · Prologis, Inc. (SEC EDGAR) · Tier 1: company or exchange filing · Feb 13, 2026
- S2Prologis Form 10-K for fiscal year 2023 · Prologis, Inc. (SEC EDGAR) · Tier 1: company or exchange filing · Feb 13, 2024
- S3Prologis Form 10-K for fiscal year 2022 · Prologis, Inc. (SEC EDGAR) · Tier 1: company or exchange filing · Feb 14, 2023
- S4Prologis Form 10-K for fiscal year 2024 · Prologis, Inc. (SEC EDGAR) · Tier 1: company or exchange filing · Feb 14, 2025
- S5Prologis Form 10-Q for the quarter ended September 30, 2026 (Q3 FY2026) · Prologis, Inc. (SEC EDGAR) · Tier 1: company or exchange filing · Oct 28, 2026
- S6Prologis Reports Third Quarter 2026 Results (8-K Ex. 99.2) · Prologis, Inc. (SEC EDGAR) · Tier 1: company or exchange filing · Oct 15, 2026
- S7Prologis Supplemental Information, Third Quarter 2026 (8-K Ex. 99.1) · Prologis, Inc. (SEC EDGAR) · Tier 1: company or exchange filing · Oct 15, 2026
- S8Prologis Reports Second Quarter 2026 Results (8-K Ex. 99.2) · Prologis, Inc. (SEC EDGAR) · Tier 1: company or exchange filing · Jul 16, 2026
- S9Prologis Supplemental Information, Second Quarter 2026 (8-K Ex. 99.1) · Prologis, Inc. (SEC EDGAR) · Tier 1: company or exchange filing · Jul 16, 2026
- S10Prologis Reports First Quarter 2026 Results (8-K Ex. 99.2) · Prologis, Inc. (SEC EDGAR) · Tier 1: company or exchange filing · Apr 16, 2026
- S11Prologis Supplemental Information, First Quarter 2026 (8-K Ex. 99.1) · Prologis, Inc. (SEC EDGAR) · Tier 1: company or exchange filing · Apr 16, 2026
- S12Prologis Reports Fourth Quarter and Full Year 2025 Results (8-K Ex. 99.2) · Prologis, Inc. (SEC EDGAR) · Tier 1: company or exchange filing · Jan 21, 2026
- S13Prologis Supplemental Information, Fourth Quarter 2025 (8-K Ex. 99.1) · Prologis, Inc. (SEC EDGAR) · Tier 1: company or exchange filing · Jan 21, 2026
- S14Prologis Reports Fourth Quarter and Full Year 2024 Results (8-K Ex. 99.2) · Prologis, Inc. (SEC EDGAR) · Tier 1: company or exchange filing · Jan 21, 2025
- S15Prologis Reports Third Quarter 2025 Results (8-K Ex. 99.2) · Prologis, Inc. (SEC EDGAR) · Tier 1: company or exchange filing · Oct 15, 2025
- S16Prologis Reports Second Quarter 2025 Results (8-K Ex. 99.2) · Prologis, Inc. (SEC EDGAR) · Tier 1: company or exchange filing · Jul 16, 2025
- S17Prologis Reports First Quarter 2025 Results (8-K Ex. 99.2) · Prologis, Inc. (SEC EDGAR) · Tier 1: company or exchange filing · Apr 16, 2025
- S18Prologis Reports Fourth Quarter and Full Year 2023 Results (8-K Ex. 99.2) · Prologis, Inc. (SEC EDGAR) · Tier 1: company or exchange filing · Jan 17, 2024
- S19Prologis Reports Strong Fourth Quarter and Full Year 2022 Earnings (8-K Ex. 99.2) · Prologis, Inc. (SEC EDGAR) · Tier 1: company or exchange filing · Jan 18, 2023
- S20Prologis Fourth Quarter and Full Year 2021 Earnings Results (8-K Ex. 99.2) · Prologis, Inc. (SEC EDGAR) · Tier 1: company or exchange filing · Jan 19, 2022
- S21Prologis 2026 proxy statement (DEF 14A) · Prologis, Inc. (SEC EDGAR) · Tier 1: company or exchange filing · Mar 19, 2026
- S22Prologis 8-K filed Aug 4, 2026: SEGRO offer (Rule 2.7 announcement), Co-operation Agreement, term loan · Prologis, Inc. (SEC EDGAR) · Tier 1: company or exchange filing · Aug 4, 2026
- S23Prologis 8-K filed Jun 24, 2026: indicative all-share proposal to SEGRO · Prologis, Inc. (SEC EDGAR) · Tier 1: company or exchange filing · Jun 24, 2026
- S24Prologis 8-K filed Jul 1, 2026: Alfred F. Kelly, Jr. appointed director · Prologis, Inc. (SEC EDGAR) · Tier 1: company or exchange filing · Jul 1, 2026
- S25Prologis 8-K filed Oct 30, 2026: $5.0 billion at-the-market equity program · Prologis, Inc. (SEC EDGAR) · Tier 1: company or exchange filing · Oct 30, 2026
- S26Schedule 13G/A by BlackRock, Inc. on Prologis common stock · SEC EDGAR (filed by holder) · Tier 1: company or exchange filing · Jun 4, 2026
- S27Schedule 13G by Vanguard Capital Management on Prologis common stock · SEC EDGAR (filed by holder) · Tier 1: company or exchange filing · Apr 30, 2026
- S28Schedule 13G by Vanguard Portfolio Management on Prologis common stock · SEC EDGAR (filed by holder) · Tier 1: company or exchange filing · Apr 29, 2026
- S29Schedule 13G/A by The Vanguard Group on Prologis common stock (0%) · SEC EDGAR (filed by holder) · Tier 1: company or exchange filing · Mar 27, 2026
- S30PLD historical prices, Oct 6 to Nov 5, 2026 (Nasdaq.com historical table; PLD is listed on the NYSE) · Nasdaq, Inc. · Tier 1: company or exchange filing · Nov 6, 2026
Changes to this page (v1 · Nov 6, 2026)
- v1 · Nov 6, 2026First version, through Q3 FY2026 (quarter ended Sep 30, 2026). (first version)
Numbers come only from tier 1 and tier 2 sources. Read how we research.
Disclaimer
For learning only. Cityfort is not a registered investment adviser or broker-dealer and does not recommend buying or selling any security. Prices shown are dated and may be out of date.
Investing in securities involves risk, including loss of capital. Before making any investment decision, do your own research and consider consulting a registered investment adviser or other qualified professional.
Cityfort, its owners and contributors may or may not hold securities of companies covered. Cityfort is not paid by any company it covers. Content is not an offer or solicitation to buy or sell any security, including in any initial public offering.
Read the positions policyRead the full disclaimerHide the full disclaimer
Cityfort publishes general educational content that explains how listed companies work. Cityfort is not registered with the US Securities and Exchange Commission or any state securities regulator as an investment adviser, and is not a broker-dealer or a member of FINRA. Cityfort does not provide investment, tax or legal advice, recommendations, ratings, price targets or any opinion on whether to buy, sell or hold any security. Nothing on the site is tailored to any person's circumstances.
All information is taken from publicly available sources, mainly company filings with the SEC, which are listed on each page with dates. We work to keep it accurate and correct errors publicly, but we do not guarantee that it is complete, accurate or up to date. Any market price or price-based ratio shown is dated, may be out of date by the time you read it, and is included only to explain concepts.
Statements by company management, including forward-looking statements and guidance, are reported as the company's statements, with their date and source; they are not our forecasts. Adjusted (non-GAAP) figures are the company's own measures and are shown next to the official (GAAP) figures.