Consumer Discretionary · NASDAQ: EXPE
Expedia Group: how the business works
Expedia Group runs Expedia, Hotels.com and Vrbo, earning $14.7 billion of revenue in FY2025 on $119.6 billion of trips booked through its sites and partners.
By Hardik Bhandare · Checked against filings: . Editorial policy. Corrections
Follow Expedia Group
Email me when Expedia Group's page is updated after earnings.
We'll send a confirmation email first. See our privacy policy.
Expedia Group, Inc. · Seattle, Washington
Updated for Q3 FY2026 · checked
- Revenue, FY2025
- $14.7B
- Net income, FY2025
- $1.29B
- Gross bookings, FY2025
- $119.6B
- Room nights booked, FY2025
- 415.4 million
- Employees, Dec 31, 2025
- About 16,000
The short version
Expedia Group in 5 points
1 · What it sells
Expedia Group runs Expedia, Hotels.com and Vrbo, where travelers booked $119.6 billion of hotels, rentals, flights and other trips in FY2025, bringing in $14.7 billion of revenue.
2 · Who pays it
In FY2025, travelers paying Expedia upfront gave 69.6% of revenue, commissions and fees on bookings passed to airlines and hotels 21.6%, and advertisers and other payers 8.8%.
3 · What it keeps from $100
Of every $100 that came in during FY2025, including interest income, Expedia kept $8.6 as net income; operating income was $1,871 million, after direct selling and marketing took 49.9% of revenue.
4 · Where the operating profit comes from
The B2C consumer brands made $2,798 million of segment Adjusted EBITDAOperating profit before wear-and-tear charges (depreciation and amortization). As a margin: per $100 of sales. (Expedia's own profit measure, before depreciation, stock-based payPay given as shares instead of cash, which spreads ownership more thinly. Learn more and some other costs) in FY2025 and the B2B partner business $1,257 million, both before corporate costs.
5 · The one thing to watch
B2B gross bookings grew 19% to $11.1 billion in Q3 FY2026, while B2C gross bookings grew 7% to $22.9 billion.
Sources: From Expedia Group's FY2025 10-K, Q3 FY2026 10-Q and Q3 FY2026 earnings release · checked
01Where the money goes · FY2025
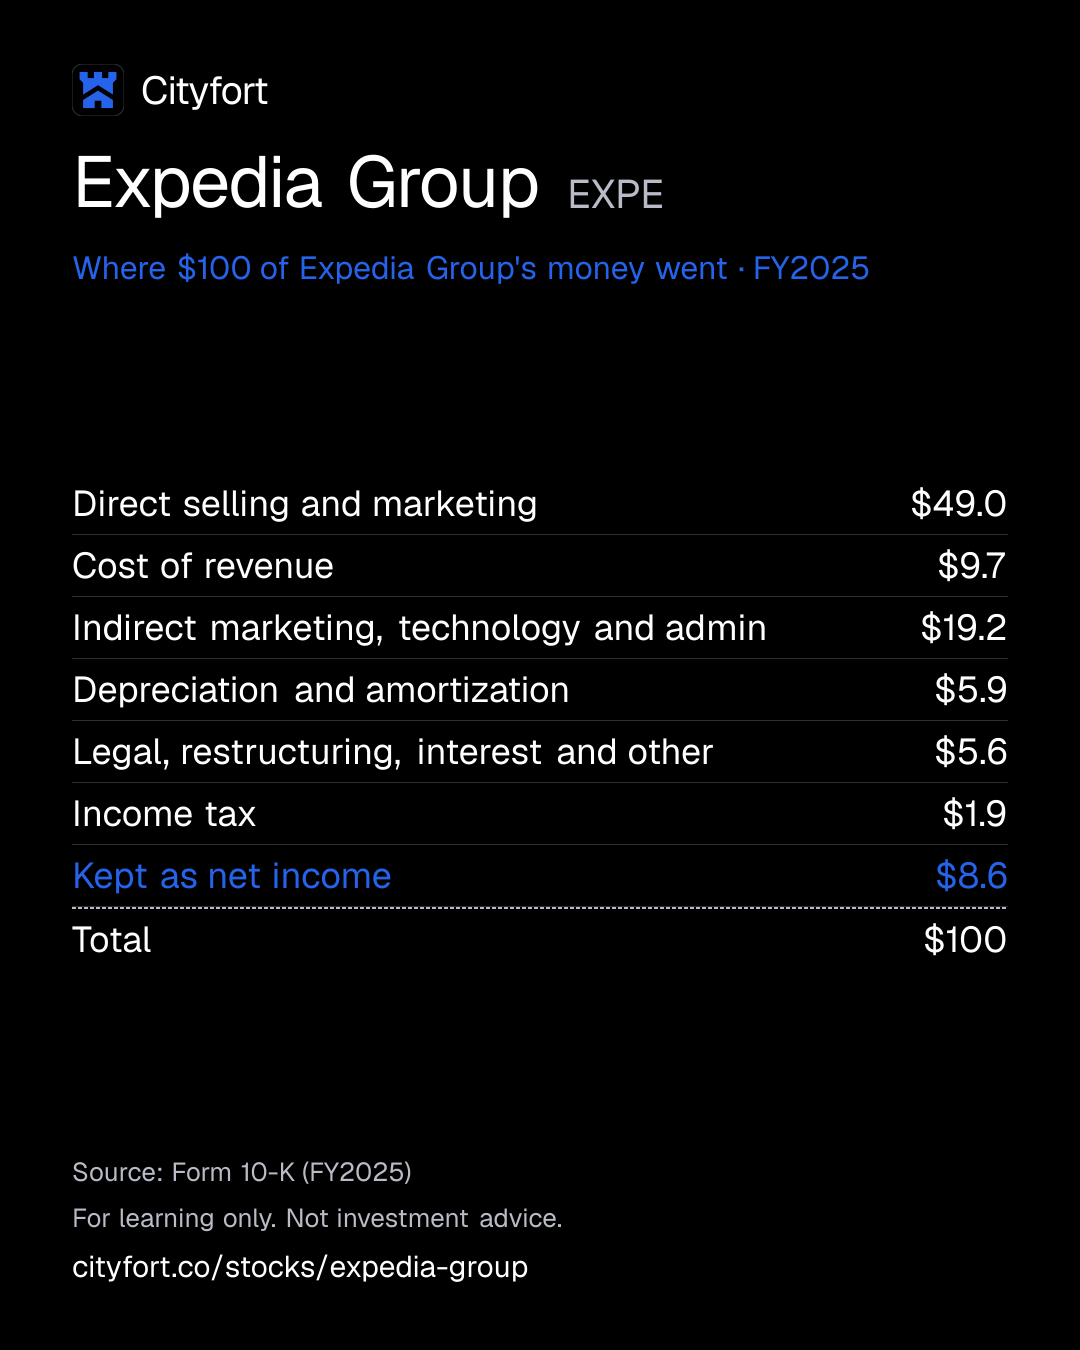
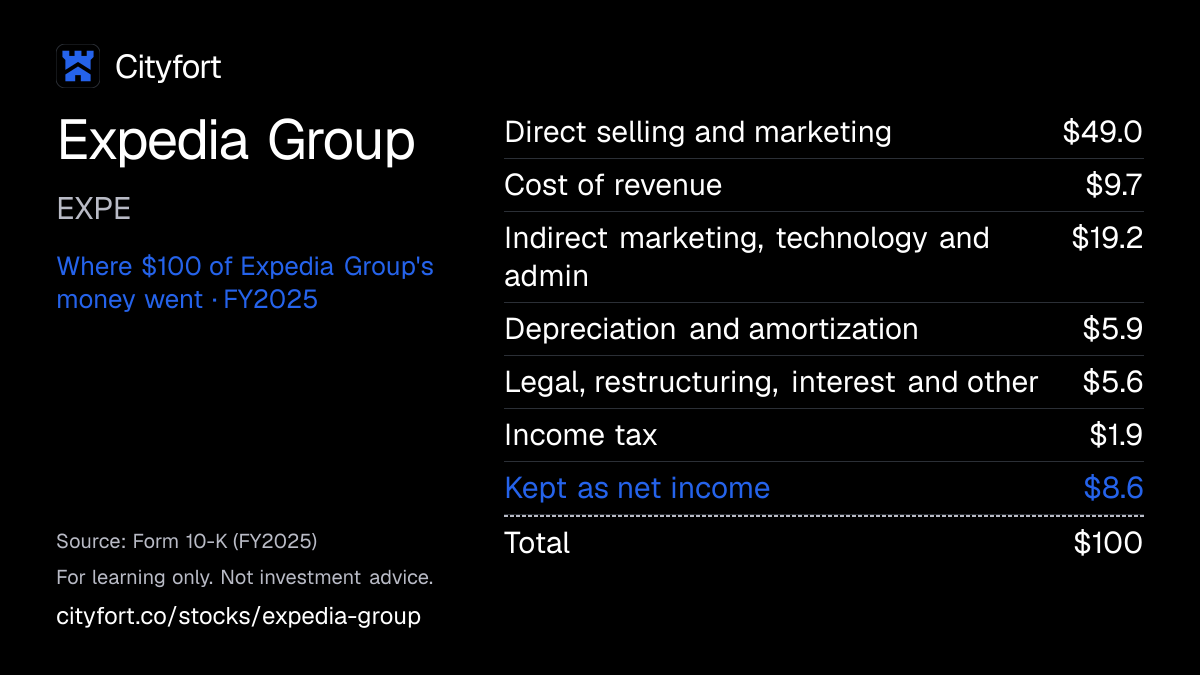
Where does $100 of Expedia Group's money go?
Expedia Group · FY2025
Receipt for every $100
| Direct selling and marketing | $49.0 |
|---|---|
| Cost of revenue | $9.7 |
| Indirect marketing, technology and admin | $19.2 |
| Depreciation and amortization | $5.9 |
| Legal, restructuring, interest and other | $5.6 |
| Income tax | $1.9 |
| Kept as net income | $8.6 |
| Total | $100 |
Each line = amount ÷ total money in × 100. Lines may not add to exactly $100 because of rounding.
How this is worked out
Cityfort calculation from the FY2025 10-K. Of every $100 that came in during FY2025 (revenue $14,733 million + interest income $255 million = $14,988 million): each line = line ÷ $14,988 million × 100.
Save this receipt as an image
Embed this receipt or the key numbers
Paste this code into a blog or website to show the card you choose, with a link back to this page.
Each week: the next company due to report earnings, explained in 5 points.
No tips. Unsubscribe anytime.
We'll send a confirmation email. See our privacy policy.
02The business in one line
What does Expedia Group do?
Travelers, airlines and hotels pay Expedia Group a cut of each trip booked, and advertisers pay for ads. About half of that money goes on marketing to win travelers; the rest covers other costs and profit.
- In FY2025, travelers paying Expedia upfront (the merchant model) gave 69.6% of revenue, commissions and fees on bookings passed to suppliers 21.6%, and advertising and other 8.8%.
- Direct selling and marketing cost $7.3 billion in FY2025, 49.9% of revenue. Expedia kept $8.80 of net income per $100 of revenue that year.
03Who pays it
Who pays Expedia Group?
Travelers paying Expedia upfront (merchant model)
69.6%
of revenue
Expedia is the merchant of record: travelers pay it, usually when they book, and it pays the hotel or other supplier. $10,256 million in FY2025.
Suppliers and travelers paying commissions or fees (agency model)
21.6%
of revenue
Expedia passes the booking to the airline or hotel and earns a commission or ticketing fee. Most agency bookings are flights. $3,183 million in FY2025.
Advertisers and other
8.8%
of revenue
Travel and non-travel firms that buy ads on Expedia's sites and on trivago, plus media and other revenue. $1,294 million in FY2025.
- Travelers paying Expedia upfront (merchant model)69.6%
- Suppliers and travelers paying commissions or fees (agency model)21.6%
- Advertisers and other8.8%
How spread out the customers are
The FY2025 10-K names no single customer above 10% of revenue. No country other than the United States accounted for more than 10% of revenue.
Sources (1)
04How it makes money
How does Expedia Group make money?
Expedia earns a slice of every trip it books and spends about half its revenue to win those bookings.
Revenue was $14.7 billion in FY2025 on $119.6 billion of trips booked. Direct selling and marketing cost $7.3 billion, 49.9% of revenue. Profit rises when bookings grow faster than marketing and fixed costs.
Net income kept per $100 of revenue
$0.1$8.8
FY2021 to FY2025
- Hotels, rental owners and airlines list rooms and seats on Expedia's sites.
- Expedia pays for search ads, TV and partner commissions to bring travelers in.
- Travelers book, and Expedia keeps about $12.30 of every $100 booked (FY2025).
- Merchant-model travelers pay upfront and suppliers are paid later, so cash builds before the travel season.
- In FY2025 technology and admin costs fell while revenue rose 7.6%.
↺ Step 5 feeds back into step 1.
05Business segments · FY2025
Which businesses make up Expedia Group?
B2C
64.3%Sells travel straight to travelers through Expedia, Hotels.com, Vrbo and brands such as Orbitz and Travelocity. Segment Adjusted EBITDA, before corporate costs, was $2,798 million.
Revenue $9.5B ($9,474M) · Operating profit $2.2B ($2,240M)
B2B
32.9%Supplies hotel rooms and booking technology to airlines, travel agents, retailers and banks, which sell it to their customers. Segment Adjusted EBITDA was $1,257 million.
Revenue $4.8B ($4,842M) · Operating profit $1.0B ($1,028M)
trivago
2.8%A hotel price-comparison site, about 59.2% owned, that earns advertising fees for sending users to booking sites. Revenue shown is from outside customers only.
Revenue $417M · Operating profit $15M
How the mix changed
- B2C
- B2B
- trivago
Revenue by segment, FY2023 to FY2025.
US$
See the numbers
Sources (1)
06The numbers · Consolidated · US$
How has Expedia Group done?
Revenue
$14.7BFY2025
Revenue rose every year, from $8.6 billion in FY2021 to $14.7 billion in FY2025.
US$
See the numbers
Net income
$1.3BFY2025
Net income rose from $12 million in FY2021 to $1.29 billion in FY2025, though the first quarter was a loss in each of FY2024, FY2025 and FY2026.
US$
See the numbers
Net income for every $100 of revenue
$8.8FY2025
Expedia kept $8.80 of net income per $100 of revenue in FY2025, up from $0.10 in FY2021.
Net margin: $ of net income per $100 of revenue
See the numbers
Free cash flow
$3.1BFY2025
Operating cash flow was above net income every year. FY2025 free cash flow was $3.1 billion after $770 million of capital spending; stock-based pay was $398 million.
US$ · cash from operations minus spending on plants and equipment
See the numbers
See all yearly numbers
EBITDA here = operating income plus depreciation and amortization (from the cash flow statement). Fiscal years are the company's own: Fiscal year ends Dec 31. Net income is the share belonging to the company's owners.
Learn: Fiscal years that don't end in December: Nvidia's FY2027 explained · Stock-based compensation and dilution: pay that becomes shares
Sources (15)
- Form 10-K for FY2021
- Form 10-K for FY2022
- Form 10-K for FY2023
- Form 10-K for FY2024
- Form 10-K for FY2025
- Form 10-Q for Q1 FY2024
- Form 10-Q for Q2 FY2024
- Form 10-Q for Q3 FY2024
- Q4 FY2025 earnings release (8-K Ex. 99.1)
- Form 10-Q for Q1 FY2025
- Form 10-Q for Q2 FY2025
- Form 10-Q for Q3 FY2025
- Form 10-Q for Q1 FY2026
- Form 10-Q for Q2 FY2026
- Form 10-Q for Q3 FY2026
07Who runs it
Who runs Expedia Group, and did they deliver?
Barry Diller
Chairman and Senior Executive
Holds all Class B shares and 32.6% of votes (Apr 20, 2026). Also Chairman and Senior Executive of IAC.
Ariane Gorin
Chief Executive Officer · since 2024
Employment agreement effective Feb 7, 2024.
Derek Andersen
Chief Financial Officer · since 2026
Succeeded Scott Schenkel on May 11, 2026, a change announced Apr 23, 2026.
Robert Dzielak
Chief Legal and People Officer
Lance Soliday
Chief Accounting Officer · since 2024
In the role since Apr 1, 2024.
What they said, and what happened
3 delivered · 1 too early to tell
Said on Feb 12, 2026
Q1 FY2026 outlook: gross bookings of $34.6–35.2 billion and revenue of $3.32–3.37 billion.
DeliveredWhat happened
Reported gross bookings of $35.5 billion and revenue of $3,426 million, both above the range.
Said on May 7, 2026
Q2 FY2026 outlook: gross bookings of $32.5–33.1 billion and revenue of $4.11–4.19 billion.
DeliveredWhat happened
Reported gross bookings of $33.9 billion and revenue of $4,315 million, both above the range.
Said on Aug 5, 2026
Q3 FY2026 outlook: gross bookings of $32.2–32.8 billion, revenue of $4.65–4.75 billion and Adjusted EBITDA of $1.51–1.56 billion.
DeliveredWhat happened
Reported gross bookings of $34.0 billion, revenue of $4,938 million and Adjusted EBITDA of $1,689 million, all above the range.
Said on Nov 4, 2026
FY2026 outlook: revenue of $16.37–16.43 billion and gross bookings of $131.4–131.9 billion.
Too early to tellWhat happened
FY2026 results are not yet out.
08What could go wrong
What could go wrong for Expedia Group?
- Competition
Reliance on search engines for traffic
Much of Expedia's traffic comes from search engines such as Google, through paid keywords and free results. The FY2025 10-K says Google has added its own travel search, which may reduce that traffic.
Watch Direct selling and marketing as a share of revenue: 49.9% in FY2025.
- Competition
Competition from Booking.com, Airbnb and AI tools
The Q3 FY2026 10-Q names Airbnb, Vrbo and Booking.com as the leaders in alternative stays. It also says generative AI tools are being used to build competing trip-planning offerings.
Watch B2C gross bookings growth: +7% in Q3 FY2026, against +19% for B2B.
- Demand
Travel demand can drop suddenly
The FY2025 10-K lists pandemics, economic downturns and other events that cut travel among its risks. Expedia's net income was $12 million in FY2021, against $1,294 million in FY2025.
Watch Room nights growth in the quarterly releases: +7% in Q3 FY2026.
- Governance
One shareholder holds about a third of the votes
Barry Diller holds all Class B shares, at 10 votes each, and 32.6% of the votes (Apr 20, 2026). The FY2025 10-K says he can influence, and potentially control, mergers and other major corporate actions.
Watch Class B ownership and voting power in each year's proxy statementThe yearly filing about shareholder votes, the board and executive pay. Learn more.
- Legal
Tax and legal claims
US local governments have sued online travel companies, including Expedia brands, alleging unpaid hotel occupancy and other taxes. Expedia says its settlement reserve is not material. In Dec 2025 it paid $156 million to settle an Italian withholding-tax claim for 2017–2023; talks on later years continue. An Israeli class action filed in 2018 alleges limits on hotel price competition; class certification is pending.
Watch The "legal reserves, occupancy tax and other" cost line: $185 million in FY2025.
- Currency
Currency swings
40.9% of FY2025 revenue came from outside the United States. In Q1 FY2026 Expedia started hedging part of its expected foreign-currency revenue to limit the effect of exchange-rate moves.
Watch Revenue from non-US points of sale: $2,093 million in Q3 FY2026.
- Cash and liquidity
Cash swings with the travel season
Travelers pay upfront and Expedia pays suppliers later. Deferred merchant bookings were $12.6 billion at Sep 30, 2026, against $5.0 billion of cash and cash equivalents. Operating cash flow was negative $1,157 million in Q3 FY2026; for the first nine months of 2026 it was $4,252 million.
Watch Deferred merchant bookings and operating cash flow in each 10-Q.
09Supporters vs. critics
What do supporters and critics point to?
What supporters point to
- Revenue rose every year, from $8.6 billion in FY2021 to $14.7 billion in FY2025, and net income from $12 million to $1.29 billion.
- Reported gross bookings and revenue came in above the company's own outlook ranges in each of Q1, Q2 and Q3 FY2026.
- B2B gross bookings grew 19% in Q3 FY2026, and B2B revenue rose 23% to $1,708 million.
- FY2025 free cash flow was $3.1 billion. At Sep 30, 2026 cash and short-term investments were $107 million more than debt (Cityfort calculation from the Q3 FY2026 earnings release).
- Expedia reinstated its dividend in Feb 2025 and bought back 9.0 million shares in FY2025.
What critics point to
- Direct selling and marketing took 49.9% of FY2025 revenue, and the FY2025 10-K says Google's own travel search may reduce the traffic Expedia gets from it.
- The first quarter was a net loss in each of FY2024, FY2025 and FY2026, and operating cash flow was negative $1,157 million in Q3 FY2026.
- Barry Diller holds 32.6% of the votes through 10-vote Class B shares (Apr 20, 2026), and the FY2025 10-K says he can influence major corporate actions.
- Debt was 3.3 times Expedia Group stockholders' equity at Sep 30, 2026 (Cityfort calculation from the Q3 FY2026 earnings release).
- US local governments have sued online travel companies, including Expedia brands, alleging unpaid hotel occupancy and other taxes.
10What to watch next
What should you watch next at Expedia Group?
Next event
Q4 FY2026 results
Date not announced yet.
Q4 FY2026 against the outlook
On Nov 4, 2026 Expedia gave a FY2026 outlook of $16.37–16.43 billion of revenue and $131.4–131.9 billion of gross bookings. The Q4 release will show the full year.
B2B against B2C
B2B gross bookings grew 19% in Q3 FY2026 and B2C 7%. B2B was 32.9% of FY2025 revenue.
Marketing cost and search traffic
Direct selling and marketing was 49.9% of FY2025 revenue. The FY2026 10-K will show the full-year figure and what Expedia then says about Google.
Cash held for travelers
Deferred merchant bookings were $12.6 billion at Sep 30, 2026, up from $10.4 billion at Dec 31, 2025, against $5.0 billion of cash and cash equivalents. The FY2026 10-K will show the year-end figure.
11Key facts
Key facts about Expedia Group
- What does Expedia Group do?
- Expedia Group runs online travel booking sites and apps, mainly Expedia, Hotels.com and Vrbo, for hotels, vacation rentals, flights, rental cars and cruises. It had $14.7 billion of revenue in FY2025 on $119.6 billion of gross bookings, the total value of travel booked.
- How does Expedia Group make money?
- Expedia Group keeps a cut of each trip booked. In FY2025, merchant revenue, where travelers pay Expedia Group and it pays the hotel or other supplier, was 69.6% of revenue; agency commissions and fees were 21.6%; and advertising and other revenue 8.8%.
- What are Expedia Group's segments?
- Expedia Group reports three segments. In FY2025 B2C, its consumer brands such as Expedia, Hotels.com and Vrbo, had $9,474 million of revenue; B2B, which supplies travel to airlines, banks and other firms, $4,842 million; and trivago, a hotel price-comparison site about 59.2% owned, $417 million.
- Is Expedia Group profitable?
- Yes. Expedia Group's net income was $1,294 million in FY2025, up from $1,234 million in FY2024 and $12 million in FY2021. Its operating income was $1,871 million in FY2025. The first quarter of FY2024, FY2025 and FY2026 each ended in a net loss.
- How big is Expedia Group?
- Expedia Group had revenue of $14.7 billion in FY2025, up 7.6% from FY2024, and travelers booked 415.4 million room nights through it that year. It had about 16,000 employees in nearly 50 countries at Dec 31, 2025.
- Where does Expedia Group earn its revenue?
- Expedia Group earned 59.1% of its FY2025 revenue through US points of sale and 40.9% through all other countries.
- Who owns Expedia Group?
- Expedia Group's chairman Barry Diller holds all of its 10-vote Class B shares and 32.6% of the votes, according to the 2026 proxy (Apr 20, 2026). The same proxy shows The Vanguard Group with 13.3% and BlackRock with 8.7% of Expedia Group's common stock.
- How much cash does Expedia Group return to shareholders?
- Expedia Group bought back $1,662 million of its shares in FY2025 and about $1.5 billion in the first nine months of 2026. It reinstated its quarterly dividend at $0.40 a share in Feb 2025 and raised it to $0.48 in Feb 2026.
- What was Expedia Group's latest quarter?
- In Q3 FY2026 (July to September 2026), Expedia Group's revenue was $4,938 million, up from $4,412 million in Q3 FY2025, and net income was $1,030 million, against $959 million. Gross bookings were $34.0 billion in the quarter.
Terms on this page
- Capital expenditures (capex)
- Debt-to-equity
- Dividend payout ratio
- Earnings per share (EPS)
- EBITDA
- Free cash flow
- Interest coverage
- Net debt
- Net margin
- Revenue vs net income
Each explains the term in plain English, with the same number from other companies on Cityfort.
Go deeper
More detail from the same filings. Open any section.
12What it sells
12What it sells
What does Expedia Group sell?
Lodging
Hotel rooms and vacation rentals. Lodging brought in $11,752 million, 80% of FY2025 revenue.
Air
Flight tickets, on which Expedia mostly earns commissions and ticketing fees. Air revenue was $407 million in FY2025.
Advertising and media
Hotels and other travel firms pay to be shown to Expedia's users. Expedia Group advertising was $758 million in FY2025 and trivago advertising $417 million.
Other travel products
Car rentals, travel insurance, activities and cruises, $1,399 million of FY2025 revenue.
B2B travel supply
Airlines, travel agents, online retailers, corporate travel managers and banks use Expedia's technology and hotel rooms to sell travel to their own customers.
Think of it like this
Like an online travel agent: it takes your booking, passes it to the hotel or airline, and keeps a cut.
What it does
- Does: Takes bookings for hotels, rentals, flights, cars and cruises on its own sites and apps
- Does: Supplies travel bookings and technology to other companies (its B2B segment)
- Does: Sells advertising to hotels and other travel firms
- Does: Owns about 59.2% of trivago, a separately listed hotel price-comparison site (Dec 31, 2025)
What it does not do
- Does not: Own the hotels it sells: it contracts for rates and rooms and bears no inventory risk, the FY2025 10-K says
- Does not: Keep the full trip value: FY2025 revenue was $14.7 billion on $119.6 billion of gross bookings
- Does not: Run corporate travel management since selling Egencia to American Express Global Business Travel in Nov 2021
Sources (1)
13How the money flows
13How the money flows · FY2025
How does money flow through Expedia Group?
Money in
- Revenue$14.7B
- Interest income$255M
The company
Expedia Group
$15.0B came in
Money out
- Direct selling and marketing (search-engine traffic, TV, affiliate and B2B partner commissions)$7.3B
- Cost of revenue (customer support, payment processing, cloud and data centers)$1.5B
- Indirect marketing staff, technology and admin$2.9B
- Depreciation and amortization$887M
- Legal and tax reserves, restructuring, interest, other losses and trivago minority share$834M
- Income tax$290M
- Net income attributable to Expedia Group$1.3B
- Expedia recorded $14.7 billion of revenue in FY2025, plus $255 million of interest income on its cash.
- Direct selling and marketing took $7.3 billion: search-engine traffic, TV and print ads, affiliate fees and commissions to B2B partners.
- Customer support, payment processing and cloud costs took $1.5 billion. Marketing staff, technology and admin took another $2.9 billion.
- Depreciation, legal and tax reserves and restructuring took $1.2 billion, leaving $1.9 billion of operating income.
- Interest, other losses, trivago's minority owners and $290 million of tax took the rest, leaving $1.29 billion of net income.
Sources (1)
14What it needs to run
14What it needs to run
What does Expedia Group need to run?
Hotels, rentals and airlines
About 3.6 million lodging properties were on offer at the end of 2025, including 2.4 million Vrbo rentals, plus over 500 airlines.
Traffic from search engines
Many travelers arrive from search engines such as Google, through paid travel keywords and free results.
One technology platform
Hotels.com and Vrbo moved onto the Expedia front-end in 2023, so the brands share one system.
People
About 16,000 employees in nearly 50 countries at Dec 31, 2025.
Travelers' upfront payments
Money paid before trips, held as deferred merchant bookings: $12.6 billion at Sep 30, 2026.
15Where it sells
15Where it sells · FY2025
Where does Expedia Group sell?
- United States59.1%
- All other countries40.9%
Sources (1)
16Competitors and what protects it
16Competitors and what protects it
Who does Expedia Group compete with?
Booking Holdings
NASDAQ: BKNG
Runs Booking.com, which the Q3 FY2026 10-Q names with Airbnb and Vrbo as the leaders in vacation rentals and other alternative stays.
Airbnb
NASDAQ: ABNB
Competes with Vrbo for rental listings and guests; the Q3 FY2026 10-Q names it among the leaders in alternative accommodation.
Google (Alphabet)
NASDAQ: GOOGL
Sends Expedia much of its traffic, but has added its own travel search features, which the FY2025 10-K says may reduce traffic to Expedia's sites.
Hotels and airlines selling direct
Suppliers sell through their own websites and apps to the same travelers, the FY2025 10-K says.
AI travel assistants
The Q3 FY2026 10-Q says generative AI tools are being used to build competing trip-planning and assistance offerings.
What protects the business
Each strength is scored 1 (weak) to 5 (strong) for the business, with the reason. It is not a rating of the share.
- Breadth of supply4 of 5
About 3.6 million lodging properties and over 500 airlines were on offer at the end of 2025.
- Scale of bookings4 of 5
Travelers booked $119.6 billion of travel and 415.4 million room nights through Expedia in FY2025.
- B2B technology3 of 5
Other companies booked $35.7 billion of travel through Expedia in FY2025, up from $24.6 billion in FY2023.
- Shared loyalty program3 of 5
One Key lets travelers earn and spend rewards across Expedia, Hotels.com and Vrbo in the US and UK.
Weak spot
Paying for traffic
Direct selling and marketing cost $7.3 billion in FY2025, 49.9% of revenue. Search engines such as Google, a main traffic source, are adding their own travel search.
17Where growth could come from
17Where growth could come from
Where could Expedia Group's growth come from?
Expedia's Nov 4, 2026 earnings release gave a FY2026 outlook of $131.4–131.9 billion of gross bookings (about 10% growth) and $16.37–16.43 billion of revenue (11–12% growth), with Adjusted EBITDA margin up 1.8–2.0 percentage points. On Aug 5, 2026 the company had given $129.5–130.8 billion and $16.05–16.22 billion.
B2B partners
Working+19% gross bookings, Q3 FY2026
B2B gross bookings were $11.1 billion in Q3 FY2026, and B2B revenue rose 23% to $1,708 million.
Status: Working, on track against what the company said.
Consumer brands (B2C)
Working+7% gross bookings, Q3 FY2026
B2C gross bookings were $22.9 billion in Q3 FY2026 and B2C revenue rose 6% to $3,065 million. CEO Ariane Gorin pointed to growth in consumer brands in the Aug 5, 2026 release.
Status: Working, on track against what the company said.
Advertising
Working$758 million, FY2025
Expedia Group advertising revenue rose from $483 million in FY2023 to $758 million in FY2025.
Status: Working, on track against what the company said.
Artificial intelligence
EarlyNo separate figure disclosed
CEO Ariane Gorin said in the Nov 4, 2026 release that AI "is opening further opportunities across our business". The company reports no revenue figure for it.
Status: Early, too early to judge.
Status compares progress with what the company itself said it would do: Working = on track against what the company said; Mixed = partly on track; Behind = behind the company's own plan; New = recently announced; Early = too early to judge.
18The company's own measures (non-GAAP)
18The company's own measures · FY2025 and Q3 FY2026
What do Expedia Group's own measures show?
Official (GAAP): Revenue, FY2025
$14.7B
Company's own measure: Gross bookings, FY2025
$119.6B
Expedia's measure of the total retail value of travel booked through its sites and partners. It is not revenue; revenue was 12.3% of it.
Official (GAAP)
No official figure measures this; it is the company's own operating measure.
Company's own measure: Booked room nights, FY2025
415.4 million
Up 8% from 383.9 million in FY2024. Q3 FY2026 room nights were 115.7 million, up 7%.
Official (GAAP): Operating income, FY2025
$1.9B
Company's own measure: Adjusted EBITDA, FY2025
$3.5B
Adds back depreciation and amortization ($887 million), stock-based pay ($398 million), legal reserves, occupancy tax and other ($185 million), restructuring ($100 million) and a $60 million loss on revenue hedges.
Official (GAAP): Operating income, Q3 FY2026
$1.3B
Company's own measure: Adjusted EBITDA, Q3 FY2026
$1.7B
Same definition. The Adjusted EBITDA margin was 34.2%, against 32.9% in Q3 FY2025.
Official (GAAP): Diluted EPS, FY2025
$9.81
Company's own measure: Adjusted EPS, FY2025
$15.86
Expedia's adjusted earnings per share from its Q4 FY2025 earnings release. FY2024 was $12.11, against diluted EPS of $8.95.
Official (GAAP): Diluted EPS, Q3 FY2026
$8.42
Company's own measure: Adjusted EPS, Q3 FY2026
$9.39
Up 24% from $7.57 in Q3 FY2025.
These are the company's own measures, defined by the company. They are not comparable across companies, and they are not added together. Each sits beside the nearest official (GAAP) figure.
Learn: Non-GAAP measures: what a company's "adjusted" numbers leave out · Stock-based compensation and dilution: pay that becomes shares
19Financial strength and debt
19Financial strength · Sep 30, 2026
How much debt does Expedia Group have?
- Total debt$5.5B
- Cash and investments$5.6B
- Net cash (cash minus debt)$107M
- Net worth (shareholders' money)$1.7B
- Debt to equity
- 3.3×
- $ of debt for every $1 of shareholders' money
- Interest cover
- 6.3×
- how many times operating profit covers interest
- Net cash of $107 million: cash and cash equivalents ($5,040 million) plus short-term investments ($527 million), minus debt at carrying value ($749 million due within a year plus $4,711 million long-term). Restricted cash is left out. Cityfort calculation from the Q3 FY2026 earnings release. On the same basis there was net debt of $428 million at Dec 31, 2025 (Cityfort calculation from the FY2025 10-K).
- Much of the cash is travelers' money paid before their trips. Deferred merchant bookings were $12.6 billion at Sep 30, 2026, up from $10.4 billion at Dec 31, 2025.
- In Feb 2026 Expedia repaid $750 million of 5.0% notes and settled its 0% convertible notes for about $1.1 billion in cash, as its Nov 12, 2025 8-K said it would. In Apr 2026 it sold $1.0 billion of 5.500% notes due 2036.
- A $2.5 billion revolving credit line, signed Mar 27, 2026 and due Mar 2031, had no loans outstanding when signed.
- In FY2025 operating income of $1,871 million covered interest expense of $299 million 6.3 times (Cityfort calculation from the FY2025 10-K). Debt-to-equity is debt ÷ Expedia Group stockholders' equity of $1,652 million at Sep 30, 2026 (Cityfort calculation from the Q3 FY2026 earnings release).
20Who owns it
20Who owns it · ownership as of Apr 20, 2026
Who owns Expedia Group?
- Officers and directors (as a group), shares
- 5.2%
- Officers and directors (as a group), votes
- 33.0%
Shares vs votes by class
Expedia Group has more than one class of shares, and the classes carry different votes. The share of votes a class holds can differ a lot from its share of the shares.
- Common stock: share of all votes67.3%
- Class B common stock: share of all votes32.7%
Each class's part of all votes = its shares outstanding × votes per share ÷ the total for all classes.
Share classes
Holders of 5% or more
From the company's proxy statement (DEF 14A), later Schedule 13G filings and the share counts on its latest annual or quarterly report. Each holder row shows the date of its own filing.
Learn: Dual-class shares: when votes and ownership don't match · How to read a proxy statement (DEF 14A): Nvidia's 2026 proxy · Form 4 insider filings: who files, the codes and the footnotes
21What it does with profit
21What it does with profit
What does Expedia Group do with its profit?
Dividend per share
$1.60FY2025
Dividend paid for each share, by financial year.
$ per share
See the numbers
Buyback · Dec 31, 2023
19.1 million shares repurchased in FY2023 at an average $106.07
$2.0B
Buyback · Dec 31, 2024
12.1 million shares repurchased in FY2024 at an average $133.85
$1.6B
Buyback · Dec 31, 2025
9.0 million shares repurchased in FY2025 at an average $184.76
$1.7B
Buyback · Sep 30, 2026
About 6.2 million shares repurchased in the first nine months of 2026 at an average $239.47
$1.5B
Money raised · Apr 8, 2026
5.500% senior notes due 2036
$1.0B
22Governance signals
22Governance signals
What do Expedia Group's governance filings show?
- Auditor
- Ernst & Young LLP
- Auditor changes
- None in the period covered
- Audit qualifications
- None reported
- Related-party dealings
- Barry Diller chairs both Expedia Group and IAC, so the two are related parties. At Dec 31, 2025 each owned 50% of two aircraft used by both. Payments for use of an IAC-owned aircraft, sold in Q4 2025, were not material.
- Credit rating
- Moody's, S&P Global Ratings and Fitch (as stated in the Q3 FY2026 10-Q) Baa2 (Moody's) / BBB (S&P) / BBB (Fitch) (outlook Positive (Moody's); Stable (S&P and Fitch)), Sep 30, 2026
A credit rating describes the company's ability to repay debt. It is not a rating of the share.
23How it got here
23How it got here
How did Expedia Group get here?
2011
Business-model change
TripAdvisor spun off
On Dec 20, 2011 Expedia spun off TripAdvisor as a separate listed company.
2019
Milestone
Liberty Expedia acquired
Buying Liberty Expedia Holdings came with a governance agreement that limits how Class B shares can be used in a takeover.
2020
Business-model change
One platform for all brands
Expedia moved to a single platform model, running marketing and technology across its whole brand portfolio.
2021
Business-model change
Egencia sold
In Nov 2021 it sold its corporate travel business, Egencia, to American Express Global Business Travel, with a 10-year lodging supply deal.
2023
Milestone
Brands on one front-end
Hotels.com and Vrbo moved onto the Expedia front-end stack. One Key, a shared loyalty program, launched in the US and reached the UK in 2024.
2025
Milestone
Dividend reinstated
Expedia reinstated a quarterly dividend of $0.40 on Feb 3, 2025, after paying none in 2023 and 2024.
2026
Milestone
New credit line and buyback
A $2.5 billion revolving credit line was signed in Mar 2026, and a second $5 billion buyback program followed in May 2026.
24Sources and changes
Where every number on this page comes from
Sources (22 documents)
- S1Form 10-Q for Q3 FY2026 · SEC EDGAR · Tier 1: company or exchange filing · Nov 5, 2026
- S2Form 10-Q for Q2 FY2026 · SEC EDGAR · Tier 1: company or exchange filing · Aug 6, 2026
- S3Form 10-Q for Q1 FY2026 · SEC EDGAR · Tier 1: company or exchange filing · May 8, 2026
- S4Form 10-K for FY2025 · SEC EDGAR · Tier 1: company or exchange filing · Feb 13, 2026
- S5Form 10-Q for Q3 FY2025 · SEC EDGAR · Tier 1: company or exchange filing · Nov 7, 2025
- S6Form 10-Q for Q2 FY2025 · SEC EDGAR · Tier 1: company or exchange filing · Aug 8, 2025
- S7Form 10-Q for Q1 FY2025 · SEC EDGAR · Tier 1: company or exchange filing · May 9, 2025
- S8Form 10-K for FY2024 · SEC EDGAR · Tier 1: company or exchange filing · Feb 7, 2025
- S9Form 10-Q for Q3 FY2024 · SEC EDGAR · Tier 1: company or exchange filing · Nov 8, 2024
- S10Form 10-Q for Q2 FY2024 · SEC EDGAR · Tier 1: company or exchange filing · Aug 9, 2024
- S11Form 10-Q for Q1 FY2024 · SEC EDGAR · Tier 1: company or exchange filing · May 3, 2024
- S12Form 10-K for FY2023 · SEC EDGAR · Tier 1: company or exchange filing · Feb 9, 2024
- S13Form 10-K for FY2022 · SEC EDGAR · Tier 1: company or exchange filing · Feb 10, 2023
- S14Form 10-K for FY2021 · SEC EDGAR · Tier 1: company or exchange filing · Feb 11, 2022
- S152026 proxy statement (DEF 14A, record date Apr 20, 2026) · Expedia Group, Inc. via SEC EDGAR · Tier 1: company or exchange filing · Apr 29, 2026
- S16Q3 FY2026 earnings release (8-K Ex. 99.1) · Expedia Group, Inc. via SEC EDGAR · Tier 1: company or exchange filing · Nov 4, 2026
- S17Q2 FY2026 earnings release (8-K Ex. 99.1) · Expedia Group, Inc. via SEC EDGAR · Tier 1: company or exchange filing · Aug 5, 2026
- S18Q1 FY2026 earnings release (8-K Ex. 99.1) · Expedia Group, Inc. via SEC EDGAR · Tier 1: company or exchange filing · May 7, 2026
- S19Q4 FY2025 earnings release (8-K Ex. 99.1) · Expedia Group, Inc. via SEC EDGAR · Tier 1: company or exchange filing · Feb 12, 2026
- S208-K filed Mar 30, 2026 (credit agreement and supplemental indentures) · Expedia Group, Inc. via SEC EDGAR · Tier 1: company or exchange filing · Mar 30, 2026
- S218-K filed Apr 10, 2026 (5.500% senior notes due 2036) · Expedia Group, Inc. via SEC EDGAR · Tier 1: company or exchange filing · Apr 10, 2026
- S228-K filed Nov 12, 2025 (0.00% convertible notes due 2026, cash settlement) · Expedia Group, Inc. via SEC EDGAR · Tier 1: company or exchange filing · Nov 12, 2025
Changes to this page (v1 · Nov 20, 2026)
- v1 · Nov 20, 2026First version. (first version)
Numbers come only from tier 1 and tier 2 sources. Read how we research.
Disclaimer
For learning only. Cityfort is not a registered investment adviser or broker-dealer and does not recommend buying or selling any security. Prices shown are dated and may be out of date.
Investing in securities involves risk, including loss of capital. Before making any investment decision, do your own research and consider consulting a registered investment adviser or other qualified professional.
Cityfort, its owners and contributors may or may not hold securities of companies covered. Cityfort is not paid by any company it covers. Content is not an offer or solicitation to buy or sell any security, including in any initial public offering.
Read the positions policyRead the full disclaimerHide the full disclaimer
Cityfort publishes general educational content that explains how listed companies work. Cityfort is not registered with the US Securities and Exchange Commission or any state securities regulator as an investment adviser, and is not a broker-dealer or a member of FINRA. Cityfort does not provide investment, tax or legal advice, recommendations, ratings, price targets or any opinion on whether to buy, sell or hold any security. Nothing on the site is tailored to any person's circumstances.
All information is taken from publicly available sources, mainly company filings with the SEC, which are listed on each page with dates. We work to keep it accurate and correct errors publicly, but we do not guarantee that it is complete, accurate or up to date. Any market price or price-based ratio shown is dated, may be out of date by the time you read it, and is included only to explain concepts.
Statements by company management, including forward-looking statements and guidance, are reported as the company's statements, with their date and source; they are not our forecasts. Adjusted (non-GAAP) figures are the company's own measures and are shown next to the official (GAAP) figures.