Communication Services · NYSE: AMC
AMC Entertainment: how the business works
AMC Entertainment runs movie theaters in the US and Europe and earns money from tickets, food and drinks. FY2025 revenue was $4.85 billion.
By Hardik Bhandare · Checked against filings: . Editorial policy. Corrections
Follow AMC Entertainment
Email me when AMC Entertainment's page is updated after earnings.
We'll send a confirmation email first. See our privacy policy.
AMC Entertainment Holdings, Inc. · Leawood, Kansas · Founded 1920
Updated for Q3 FY2026 · checked
- Revenue, FY2025
- $4.85B
- Net loss, FY2025
- $632.4M
- Theaters and screens, Sep 30, 2026
- 840 / 9,472
- Attendance, FY2025
- 219.4 million
- Employees, Dec 31, 2025
- 33,311
The short version
AMC Entertainment in 5 points
1 · What it sells
AMC Entertainment runs movie theaters in the US and Europe, 840 with 9,472 screens on Sep 30, 2026, selling tickets, food and drinks for FY2025 revenue of $4,848.9 million.
2 · Who pays it
Moviegoers pay almost all of it: in FY2025 tickets gave 54.7% of revenue, food and drinks 34.5% and other theater income such as advertising 10.8%.
3 · What it keeps from $100
Of every $100 that came in during FY2025, costs were $113.0, so AMC lost $13.0, mostly to interest and $202.3 million of losses on retiring debt; its operating loss was $0.4 per $100 of revenue.
4 · Where the operating profit comes from
By AMC's segment measure, Adjusted EBITDAOperating profit before wear-and-tear charges (depreciation and amortization). As a margin: per $100 of sales., U.S. markets gave $346.0 million of the $387.5 million total in FY2025, while the company as a whole had a $17.4 million operating loss.
5 · The one thing to watch
AMC's shares outstanding rose 74.0% in 2026, from 512.9 million on Dec 31, 2025 to 892.6 million on Sep 30, 2026, as it sold new shares and swapped debt for stock.
Sources: From AMC's FY2025 10-K, Q3 FY2026 10-Q and Q3 FY2026 earnings release · checked
See the full receipt and the management scorecard below
01Where the money goes · FY2025
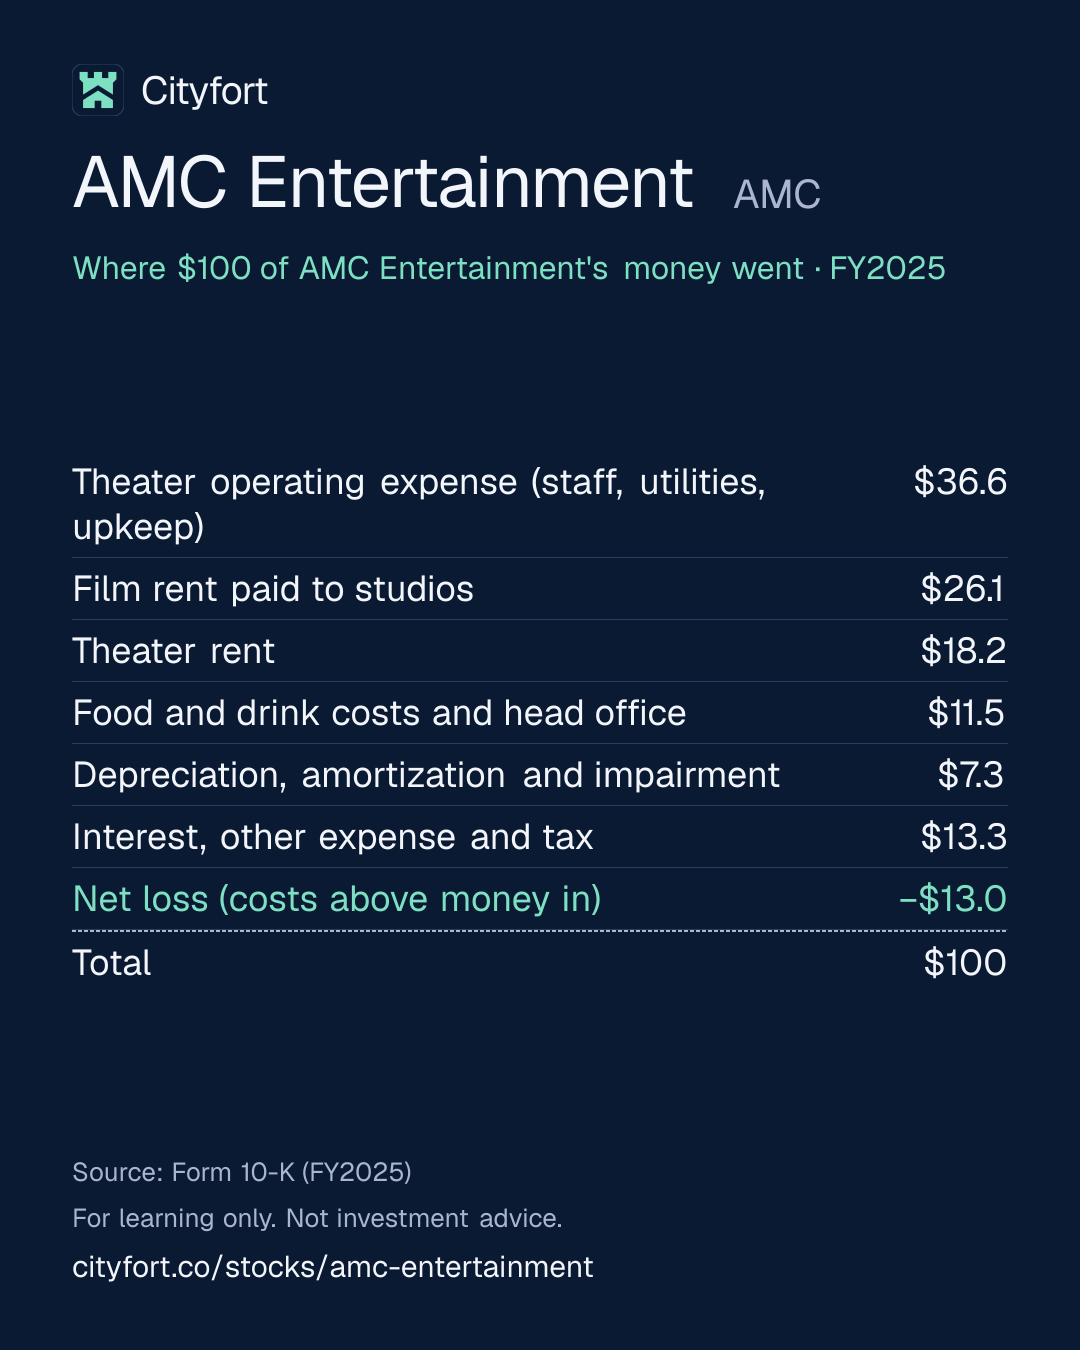
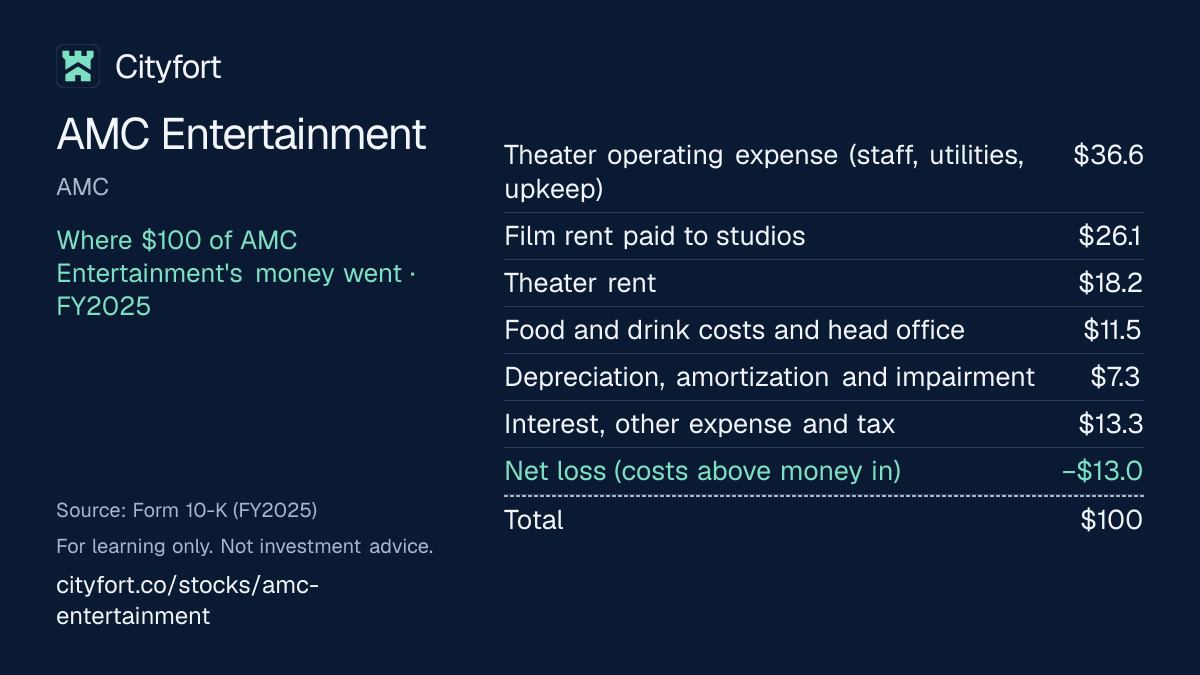
Where does $100 of AMC Entertainment's money go?
AMC Entertainment · FY2025
Receipt for every $100
| Theater operating expense (staff, utilities, upkeep) | $36.6 |
|---|---|
| Film rent paid to studios | $26.1 |
| Theater rent | $18.2 |
| Food and drink costs and head office | $11.5 |
| Depreciation, amortization and impairment | $7.3 |
| Interest, other expense and tax | $13.3 |
| Net loss (costs above money in) | −$13.0 |
| Total | $100 |
Each line = amount ÷ total money in × 100. Lines may not add to exactly $100 because of rounding.
How this is worked out
Cityfort calculation from the FY2025 10-K. Of every $100 that came in during FY2025 (revenue $4,848.9 million + investment income $32.1 million = $4,881.0 million), costs were $113.0, so the last line is a net loss of $13.0. Before interest, other expense and tax, the operating loss was $0.4 per $100 of revenue. Other expense includes $202.3 million of losses on retiring debt, partly offset by derivative and currency gains.
Save this receipt as an image:
1080 × 1350 PNG for Instagram, LinkedIn1200 × 675 PNG for X
Embed this receipt
Paste this code into a blog or website to show the receipt, with a link back to this page:
Each week: one company explained in 5 points, picked by earnings date.
Free, no tips, unsubscribe anytime.
We'll send a confirmation email. See our privacy policy.
02The business in one line
What does AMC Entertainment do?
Moviegoers pay AMC for tickets, popcorn and drinks; most of the money goes to film studios, theater staff and rent, and in FY2025 interest on its debt turned a $17.4 million operating loss into a $632.4 million net loss.
- In FY2025, tickets gave 54.7% of AMC's $4,848.9 million revenue, food and drinks 34.5% and other theater income 10.8%.
- Interest cost $530.2 million in FY2025. AMC has also sold new shares: shares outstanding rose from 512.9 million to 892.6 million in the first nine months of 2026.
03Who pays it
Who pays AMC Entertainment?
Moviegoers buying tickets
55%
of revenue
Admissions revenue of $2,652.8 million in FY2025, from 219.4 million visits.
Moviegoers buying food and drinks
35%
of revenue
Food and beverage revenue of $1,671.3 million in FY2025.
Advertisers, card partners and other payers
11%
of revenue
Other theater revenue of $524.8 million in FY2025: advertising, ticket fees, expired gift cards and package tickets, retail and a co-branded credit card.
- Moviegoers buying tickets55%
- Moviegoers buying food and drinks35%
- Advertisers, card partners and other payers11%
How spread out the customers are
Revenue comes from millions of moviegoers, not a few customers. The concentration is on the supply side: films from the seven largest studios gave about 83% of AMC's US admissions revenue in FY2025. US theaters gave 76.4% of revenue and European theaters 23.6%.
04Why it makes money
Why does AMC Entertainment make money?
Busy quarters make money and quiet ones lose it, because rent, staff and interest bills arrive either way
In Q1 FY2026, 47.6 million visits left an operating loss of $45.7 million. In Q3 FY2026, 74.9 million visits gave operating income of $248.7 million, after $221.2 million of rent. Interest of $130.0 million in Q3 FY2026 is owed whatever the attendance.
Operating result per $100 of revenue
−$36.8−$0.4
FY2021 to FY2025
- Studios release films
- Visitors buy tickets, food and drinks
- AMC pays studios film rent, 48.1% of ticket revenue in FY2025
- Rent, staff and interest are paid in busy and quiet months alike
- More visits spread those costs; fewer visits leave a loss
↺ Step 5 feeds back into step 1.
05Business segments · FY2025
Which businesses make up AMC Entertainment?
U.S. markets
76%533 theaters with 7,072 screens in 41 states and Washington, D.C. (Dec 31, 2025). Segment Adjusted EBITDA, AMC's segment measure, was $346.0 million in FY2025, 89.3% of the $387.5 million total (Cityfort calculation from the FY2025 10-K).
Revenue $3.7B
International markets
24%322 theaters with 2,568 screens in 10 European countries, under the Odeon, UCI and Nordic brands; the UK has the most, 103. Segment Adjusted EBITDA was $41.5 million in FY2025.
Revenue $1.1B
How the mix changed
- U.S. markets
- International markets
Revenue by segment, FY2021 to FY2025.
US$
See the numbers
06The numbers · Consolidated · US$
How has AMC Entertainment done?
Revenue
$4.8BFY2025
Revenue rose from $2,527.9 million in FY2021 to $4,848.9 million in FY2025, with a 3.6% dip in FY2024, and was $1,711.1 million in Q3 FY2026, up 31.6% from a year earlier.
US$
See the numbers
Net profit
−$632MFY2025
AMC reported a net loss every year from FY2021 to FY2025, $632.4 million in FY2025 including $202.3 million of losses on retiring debt; Q3 FY2026 net income of $109.3 million was its first quarterly profit in the 12 quarters shown.
US$
See the numbers
Profit kept per $100 of revenue
−$13.0FY2025
The operating result per $100 of revenue went from a $36.8 loss in FY2021 to a $0.4 loss in FY2025, while interest took $10.9 of every $100 of FY2025 revenue.
$ of profit per $100 of revenue (net margin)
See the numbers
Free cash flow
−$366MFY2025
Free cash flow was negative every year, from minus $706.5 million in FY2021 to minus $365.9 million in FY2025; AMC's Q3 FY2026 earnings release shows $124.7 million for the first nine months of 2026.
US$ · cash from operations minus spending on plants and equipment
See the numbers
See all yearly numbers
EBITDA here = operating income plus depreciation and amortization (from the cash flow statement). Fiscal years are the company's own (Fiscal year ends on Dec 31 (AMC's fiscal year is the calendar year)). Net profit is the share belonging to the company's owners.
Download AMC Entertainment's yearly and quarterly numbers (CSV, with source ids)
Learn: Fiscal years that don't end in December: Nvidia's FY2027 explained · Stock-based compensation and dilution: pay that becomes shares
Sources (11)
- Form 10-K, fiscal year 2023 (ended Dec 31, 2023)
- Form 10-K, fiscal year 2025 (ended Dec 31, 2025)
- Earnings release, Q4 and full year 2024 (8-K Ex. 99.1)
- Earnings release, Q1 2025 (8-K Ex. 99.1)
- Earnings release, Q2 2025 (8-K Ex. 99.1)
- Earnings release, Q3 2025 (8-K Ex. 99.1)
- Earnings release, Q4 and full year 2025 (8-K Ex. 99.1)
- Earnings release, Q1 2026 (8-K Ex. 99.1)
- Earnings release, Q2 2026 (8-K Ex. 99.1)
- Earnings release, Q3 2026 (8-K Ex. 99.1)
- Form 10-Q, Q3 2026 (quarter ended Sep 30, 2026)
07Who runs it
Who runs AMC Entertainment, and did they deliver?
Adam M. Aron
Chairman, chief executive officer and president · since 2016
CEO and president since January 2016, chairman since July 2021. FY2025 total pay was $14,975,072; AMC reported a CEO pay ratio of 1,174 to 1, with a median employee paid $12,756, mostly part-time staff.
Sean D. Goodman
Executive vice president, international operations, chief financial officer and treasurer
FY2025 total pay was $4.90 million.
08What could go wrong
What could go wrong for AMC Entertainment?
- Debt
Heavy debt and interest
Corporate borrowings were $3,747.4 million on Sep 30, 2026. Interest took $530.2 million in FY2025, 10.9% of revenue. The October 2026 refinancing carries rates of 8.875% on the new notes and 11.25% on the second-lien loan.
Watch Quarterly interest expense ($130.0 million in Q3 FY2026) and cash ($751.9 million on Sep 30, 2026).
- Cash and liquidity
Losses and cash burn
AMC lost money every year from FY2021 to FY2025 and its free cash flowCash from operations minus spending on buildings and equipment. Learn more was negative each year. Its Q3 FY2026 10-Q says "historical cash burn rates are not sustainable long-term". Its 10-K warns holders "could suffer a total loss" without more attendance or liquidity.
Watch Free cash flow ($124.7 million in the first nine months of 2026) and net income each quarter.
- Other
Dilution from new shares
Shares outstanding rose from 512.9 million on Dec 31, 2025 to 892.6 million on Sep 30, 2026. AMC had 143,258,701 authorized shares not issued or reserved on Nov 3, 2026, and $116.1 million of notes that can be exchanged for shares.
Watch The share count on each 10-Q cover (892.6 million on Nov 3, 2026).
- Concentration
Dependence on a few studios
Films from the seven largest studios gave about 83% of US admissions revenue in FY2025. AMC cannot control which films are made or when they are released.
Watch Attendance each quarter (74.9 million visits in Q3 FY2026).
- Competition
Streaming and shorter theater windows
AMC's 10-K names streaming, premium video-on-demand and shorter periods of theater-only release as risks to attendance. FY2025 attendance was 219.4 million, against 356.4 million in FY2019.
Watch Yearly attendance and the average US ticket price ($12.78 in FY2025).
- Legal
Stockholder lawsuits
A Delaware suit by two stockholders against AMC, Adam Aron and current and former directors concerns the 2023 stockholder settlement. It seeks about $4.2 million in damages and about $18 million in disgorgement; the defendants' motion to dismiss was pending according to the Q3 FY2026 10-Q. A federal suit over AMC Preferred Equity Units is now an individual claim of about $40,500, which AMC says it no longer considers material.
Watch A court ruling on the motion to dismiss in Masoner v. AMC, or a settlement.
Sources (6)
- Form 10-Q, Q3 2026 (quarter ended Sep 30, 2026)
- Form 10-K, fiscal year 2025 (ended Dec 31, 2025)
- Earnings release, Q3 2026 (8-K Ex. 99.1)
- Form 8-K, Oct 5, 2026 refinancing closing (Ex. 99.1 press release)
- Form 10-K, fiscal year 2023 (ended Dec 31, 2023)
- Earnings release, Q4 and full year 2025 (8-K Ex. 99.1)
09Both sides
What do supporters and critics point to?
What supporters point to
- Q3 FY2026 revenue was $1,711.1 million, up 31.6% from a year earlier, and net income was $109.3 million.
- Attendance rose to 74.9 million visits in Q3 FY2026 from 58.4 million a year earlier.
- The Oct 5, 2026 refinancing moved about $3.97 billion of debt to 2031 and 2033, from mostly 2029.
- Free cash flow was $124.7 million in the first nine months of 2026, after negative years from FY2021 to FY2025.
- AMC says it is the largest US IMAX exhibitor; it had 224 IMAX screens, 186 of them in the US, on Dec 31, 2025.
What critics point to
- AMC reported a net loss every year from FY2021 to FY2025, $632.4 million in FY2025.
- Shares outstanding rose 74.0% in 2026, to 892.6 million on Sep 30, 2026.
- Interest took $530.2 million in FY2025, 10.9% of revenue, and the new second-lien loan carries 11.25%.
- Stockholders' equity was negative, at minus $1,343.1 million on Sep 30, 2026.
- FY2025 attendance of 219.4 million was below FY2019's 356.4 million.
10What to watch next
What should you watch next at AMC Entertainment?
Next event
Q4 FY2026 results
Date not announced yet.
Attendance and revenue
Q4 FY2026 visits and revenue against Q4 FY2025's 56.3 million visits and $1,288.3 million of revenue.
Interest after the refinancing
Interest expense in the first quarters after the Oct 5, 2026 refinancing, against $130.0 million in Q3 FY2026.
Share count
Further share sales or note exchanges, from 892.6 million shares on Nov 3, 2026.
11Key dates
What are the key dates for AMC Entertainment?
| Event | Date | Source |
|---|---|---|
| Q4 FY2026 and fiscal 2026 endThe Q4 FY2026 results date is not announced in the documents read. | Form 10-K, fiscal year 2025 (ended Dec 31, 2025) | |
| First quarterly payment on the first-lien term loan0.25% of the $850.0 million loan each quarter. | Form 10-Q, Q3 2026 (quarter ended Sep 30, 2026) | |
| First-lien term loan due$850.0 million. | Form 10-Q, Q3 2026 (quarter ended Sep 30, 2026) | |
| 8.875% first-lien notes due$2,000.0 million. | Form 10-Q, Q3 2026 (quarter ended Sep 30, 2026); Form 8-K, Oct 5, 2026 refinancing closing (Ex. 99.1 press release) | |
| Second-lien term loan due$1,120.0 million at 11.25%. | Form 10-Q, Q3 2026 (quarter ended Sep 30, 2026) |
12Key facts
Key facts about AMC Entertainment
- What does AMC Entertainment do?
- AMC Entertainment Holdings runs movie theaters in the US and Europe: 840 theaters with 9,472 screens on Sep 30, 2026. AMC sells movie tickets, food and drinks, and counted 219.4 million visits in FY2025 (the year to Dec 31, 2025).
- How does AMC Entertainment make money?
- AMC Entertainment makes money from movie tickets (54.7% of FY2025 revenue), food and drinks (34.5%) and other theater income such as advertising and ticket fees (10.8%). AMC's FY2025 revenue was $4,848.9 million, and it paid film studios $1,275.2 million, 48.1% of ticket revenue.
- What is AMC Entertainment's business model?
- AMC Entertainment's business model is to license films from studios, show them in mostly leased theaters and sell food and drinks to the audience. AMC's largest FY2025 costs were theater operating expense ($1,786.0 million), film rent paid to studios ($1,275.2 million) and theater rent ($887.3 million).
- Is AMC Entertainment profitable?
- AMC Entertainment reported a net loss every year from FY2021 to FY2025, including $632.4 million in FY2025, when interest cost $530.2 million. AMC reported net income of $109.3 million in Q3 FY2026 (the quarter to Sep 30, 2026), but a net loss of $19.2 million for the first nine months of 2026.
- What is AMC Entertainment's revenue by segment?
- AMC Entertainment reports two segments. In FY2025 U.S. markets earned $3,706.1 million (76.4% of revenue) and International markets, its theaters in 10 European countries, earned $1,142.8 million (23.6%).
- How much does AMC Entertainment make from movie tickets?
- AMC Entertainment's admissions (ticket) revenue was $2,652.8 million in FY2025, from 219.4 million visits. AMC's average US ticket price was $12.78 in FY2025 and $13.55 in Q3 FY2026.
- How much does AMC Entertainment make from food and drinks?
- AMC Entertainment's food and beverage revenue was $1,671.3 million in FY2025, 34.5% of revenue, against $327.0 million of food and beverage costs. AMC's US visitors spent an average of $8.57 each on food and drinks in FY2025.
- How big is AMC Entertainment?
- AMC Entertainment had FY2025 revenue of $4,848.9 million and 33,311 employees on Dec 31, 2025, of whom 30,380 were part-time. AMC's revenue for the 12 months to Sep 30, 2026 was $5,641.5 million (Cityfort calculation from the Q4 FY2025 and Q1 FY2026 to Q3 FY2026 earnings releases).
- How much debt does AMC Entertainment have?
- AMC Entertainment had $3,747.4 million of corporate borrowings (carrying value) and $751.9 million of cash on Sep 30, 2026. On Oct 5, 2026 AMC refinanced about $3.97 billion of debt with new borrowings due in 2031 and 2033.
- Who owns AMC Entertainment?
- AMC Entertainment has one class of stock, with 892.6 million shares outstanding on Nov 3, 2026, and no controlling holder. In recent Schedule 13GA filing by anyone who owns more than 5% of a company's shares and does not seek control. Learn more filings BlackRock reported 7.6%, Peconic Partners 6.3% (both as of Sep 30, 2026), Discovery Capital Management 5.8% (Jun 30, 2026) and Vanguard Capital Management 5.19% (Sep 30, 2026).
Sources (11)
- Earnings release, Q3 2026 (8-K Ex. 99.1)
- Earnings release, Q4 and full year 2025 (8-K Ex. 99.1)
- Form 10-K, fiscal year 2025 (ended Dec 31, 2025)
- Earnings release, Q1 2026 (8-K Ex. 99.1)
- Earnings release, Q2 2026 (8-K Ex. 99.1)
- Form 10-Q, Q3 2026 (quarter ended Sep 30, 2026)
- Form 8-K, Oct 5, 2026 refinancing closing (Ex. 99.1 press release)
- Schedule 13G/A, BlackRock, Inc. (event date Sep 30, 2026)
- Schedule 13G, Peconic Partners LLC (event date Sep 30, 2026)
- Schedule 13G/A, Discovery Capital Management, LLC (event date Jun 30, 2026)
- Schedule 13G, Vanguard Capital Management (event date Sep 30, 2026)
Terms on this page
- Capital expenditures (capex)
- Earnings per share (EPS)
- EBITDA
- Free cash flow
- Market cap
- Net debt
- Net margin
- Revenue vs net income
Each explains the term in plain English, with the same number from other companies on Cityfort.
Go deeper
More detail from the same filings. Open any section.
13What it sells
13What it sells
What does AMC Entertainment sell?
Movie tickets (admissions)
Ticket revenue was $2,652.8 million in FY2025. The average US ticket price was $12.78 and the international one $10.39.
Food and drinks
Popcorn, drinks and other food sold in theaters: $1,671.3 million of revenue in FY2025. US visitors spent $8.57 each on average.
Premium screens and seats
On Dec 31, 2025 AMC had 224 IMAX screens, 181 Dolby Cinema screens and 162 of its own premium large-format screens. Recliner seats were in 368 US theaters.
AMC Stubs loyalty program
About 39 million member households. Stubs members made about 51% of US visits in FY2025.
Other theater income
Advertising, ticket fees, expired gift cards and package tickets, retail sales and a co-branded credit card: $524.8 million in FY2025.
Think of it like this
Like a concert hall that does not write the music: studios make the films, and AMC licenses them to show, paying a share of ticket sales as film rent.
What it does
- Does: Shows films in 840 theaters in the US and 10 European countries
- Does: Sells food and drinks in its theaters
- Does: Leases most of its theaters from landlords
- Does: Runs a loyalty program, AMC Stubs
What it does not do
- Does not: Does not make the films: it licenses them from studios such as Disney, Warner Bros. and Universal
- Does not: Does not run a streaming service
- Does not: Does not pay a dividend
- Does not: Does not own its IMAX and Dolby screen technology: it partners with those companies
14How the money flows
14How the money flows · FY2025
How does money flow through AMC Entertainment?
Money in
- Revenue (tickets, food and drinks, other theater income)$4.8B
- Investment income$32.1M
The company
AMC Entertainment
$4.9B came in
Money out
- Theater operating expense (staff, utilities, upkeep)$1.8B
- Film rent paid to studios$1.3B
- Theater rent$887M
- Food and drink costs $327.0M and head-office costs $233.9M$561M
- Depreciation, amortization $313.4M and impairment $43.5M$357M
- Interest $530.2M, other expense $112.4M (mainly losses on retiring debt) and tax $4.5M$647M
- Net loss attributable to AMC−$632M
- Moviegoers paid $2,652.8 million for tickets and $1,671.3 million for food and drinks in FY2025; other theater income added $524.8 million.
- AMC paid studios $1,275.2 million of film rent, 48.1% of ticket revenue, and spent $327.0 million on the food and drinks it sold.
- Running theaters cost $1,786.0 million, rent $887.3 million and head office $233.9 million; depreciation and impairment added $356.9 million.
- That left an operating loss of $17.4 million.
- Interest of $530.2 million, other expense of $112.4 million and tax of $4.5 million, less $32.1 million of investment income, gave a net loss of $632.4 million.
15What it needs to run
15What it needs to run
What does AMC Entertainment need to run?
Films from studios
AMC licenses films film by film. The seven largest studios supplied films behind about 83% of US admissions revenue in FY2025; in Europe the five largest supplied about 76%.
Leased theaters
Rent was $887.3 million in FY2025. Operating lease liabilities were $3,761.9 million on Sep 30, 2026.
Theater staff
33,311 employees on Dec 31, 2025, of whom 30,380 were part-time and 23,777 worked in the US.
Premium screen partners
AMC says it is the largest US IMAX exhibitor, with a 56% market share. It had 224 IMAX screens (186 in the US) and 181 Dolby Cinema screens on Dec 31, 2025.
Borrowed money
Corporate borrowings were $3,747.4 million (carrying value) on Sep 30, 2026, refinanced on Oct 5, 2026.
16Competitors and what protects it
16Competitors and what protects it
Who does AMC Entertainment compete with?
Regal Entertainment Group
Named in AMC's FY2025 10-K as one of the three largest US and Canada exhibitors by box office revenue.
Cinemark Holdings
NYSE: CNK
Named in AMC's FY2025 10-K as one of the three largest US and Canada exhibitors, and used in AMC's stock performance peer group.
Streaming and home viewing
AMC's 10-K says it competes with streaming, television, video-on-demand and pay-per-view services, and with other leisure such as sports, concerts and video games.
What protects the business
Each strength is scored 1 (weak) to 5 (strong) for the business, with the reason. It is not a rating of the share.
- Number and location of theaters4 of 5
855 theaters with 9,640 screens in 11 countries on Dec 31, 2025; about 49% of the US population lived within 10 miles of an AMC theater, by AMC's count.
- Premium screens3 of 5
AMC says it is the largest US IMAX exhibitor, with a 56% market share. It had 224 IMAX screens (186 in the US) and 181 Dolby Cinema screens on Dec 31, 2025.
- Loyalty program3 of 5
About 39 million AMC Stubs member households, who made about 51% of US visits in FY2025.
Weak spot
Depends on a few studios and on films people want to see
Films from seven studios gave about 83% of US admissions revenue in FY2025. AMC's 10-K names shorter theatrical windows, streaming and premium video-on-demand as risks to attendance.
17Where growth could come from
17Where growth could come from
Where could AMC Entertainment's growth come from?
AMC gives no numeric revenue, attendance or profit guidance in the earnings releases and filings read for this page. In its Q3 FY2026 earnings release (Nov 4, 2026), AMC said the major credit rating agencies had "meaningfully upgraded our credit rating".
Attendance
Mixed74.9 million visits, Q3 FY2026
Q3 FY2026 visits rose from 58.4 million a year earlier. FY2025 attendance was 219.4 million, against 356.4 million in FY2019.
Status: Mixed, partly on track.
Spending per visit
WorkingUS ticket $13.55, Q3 FY2026
The average US ticket price rose from $12.86 in Q3 FY2025, and US food and drink spending per visitor from $8.55 to $8.85.
Status: Working, on track against what the company said.
International theaters
Working$412.0 million revenue, Q3 FY2026
International revenue rose from $294.3 million a year earlier, and segment Adjusted EBITDA from $11.3 million to $72.5 million.
Status: Working, on track against what the company said.
Premium screens
Working224 IMAX, 181 Dolby Cinema
AMC had 224 IMAX, 181 Dolby Cinema and 162 of its own premium large-format screens on Dec 31, 2025, and recliners in 368 US theaters.
Status: Working, on track against what the company said.
Debt refinancing
NewAbout $3.97 billion, Oct 5, 2026
New first-lien notes and term loans due 2031 and a second-lien term loan due 2033 replaced debt due mostly in 2029.
Status: New, recently announced.
Status compares progress with what the company itself said it would do: Working = on track against what the company said; Mixed = partly on track; Behind = behind the company's own plan; New = recently announced; Early = too early to judge.
Sources (7)
- Earnings release, Q3 2026 (8-K Ex. 99.1)
- Earnings release, Q3 2025 (8-K Ex. 99.1)
- Earnings release, Q4 and full year 2025 (8-K Ex. 99.1)
- Form 10-K, fiscal year 2023 (ended Dec 31, 2023)
- Form 10-K, fiscal year 2025 (ended Dec 31, 2025)
- Form 10-Q, Q3 2026 (quarter ended Sep 30, 2026)
- Form 8-K, Oct 5, 2026 refinancing closing (Ex. 99.1 press release)
18The company's own measures (non-GAAP)
18The company's own measures · FY2025 and Q3 FY2026
What do AMC Entertainment's own measures show?
Official (GAAP): Net loss, FY2025
−$632M
Company's own measure: Adjusted EBITDA, FY2025
$388M
AMC's measure adds back tax, interest, depreciation and amortization, and leaves out items such as impairments, stock-based payPay given as shares instead of cash, which spreads ownership more thinly. Learn more and debt-retirement losses. AMC changed the definition in 2024 and again in Q1 FY2026; FY2023 was $425.8 million under the old one and $454.3 million under the 2024 one.
Official (GAAP): Net income, Q3 FY2026
$109M
Company's own measure: Adjusted EBITDA, Q3 FY2026
$348M
Adds back $9.5 million of tax, $130.0 million of interest and $75.8 million of depreciation and amortization, and leaves out $20.7 million of stock-based pay and other items. From Q1 FY2026 it also adds back net periodic pension cost, which changed 2025 quarters by $0.3 million or less.
Official (GAAP): Net income, Q3 FY2026
$109M
Company's own measure: Adjusted net earnings, Q3 FY2026
$117M
AMC's measure of net income without items it considers not part of ongoing operations. A year earlier it was minus $110.0 million.
Official (GAAP): Revenue, Q3 FY2026 (US$ million)
$1.7B
Company's own measure: Attendance, Q3 FY2026
74.9 million visits
Visits counted by AMC across all its theaters: 52.1 million in the US and 22.8 million internationally, up from 58.4 million in Q3 FY2025.
These are the company's own measures, defined by the company. They are not comparable across companies, and they are not added together. Each sits beside the nearest official (GAAP) figure.
Learn: Non-GAAP measures: what a company's "adjusted" numbers leave out · Stock-based compensation and dilution: pay that becomes shares
19Financial strength and debt
19Financial strength · Sep 30, 2026
How much debt does AMC Entertainment have?
- Total debt$3.7B
- Cash and investments$752M
- Net debt (debt minus cash)$3.0B
- Net worth (shareholders' money)−$1.3B
- Net debt = corporate borrowings $3,747.4 million (carrying value) − cash $751.9 million = $2,995.5 million (Cityfort calculation from the Q3 FY2026 10-Q). On a principal basis borrowings were $3,782.6 million.
- On Oct 5, 2026, after the quarter, AMC refinanced about $3.97 billion: $2,000.0 million of 8.875% first-lien notes due Oct 15, 2031, an $850.0 million first-lien term loan due Oct 5, 2031 and a $1,120.0 million 11.25% second-lien term loan due Oct 5, 2033.
- Before that refinancing, $3,202.8 million of the $3,782.6 million principal was due in 2029. Exchangeable notes due 2030, $116.1 million of principal, remain and can be swapped for shares.
- Not counted as debt: $3,761.9 million of operating lease liabilities for theaters and $50.7 million of finance lease liabilities.
- Debt-to-equity is not shown because equity is negative. Interest expense was $530.2 million in FY2025 and $130.0 million in Q3 FY2026.
Sources (6)
- Form 10-Q, Q3 2026 (quarter ended Sep 30, 2026)
- Form 8-K, Oct 5, 2026 refinancing closing (Ex. 99.1 press release)
- Form 10-K, fiscal year 2025 (ended Dec 31, 2025)
- Earnings release, Q3 2026 (8-K Ex. 99.1)
- Form 10-K, fiscal year 2023 (ended Dec 31, 2023)
- XBRL company facts (Dec 31, 2021 balance sheet as filed in the FY2022 Form 10-K, accession 0001411579-23-000038)
20Who owns it
20Who owns it · ownership as of Jul 31, 2026
Who owns AMC Entertainment?
Share classes
Holders of 5% or more
From the company's proxy statement (DEF 14A), later Schedule 13G filings and the share counts on its latest annual or quarterly report. Each holder row shows the date of its own filing.
Insider trades · Form 4 data as of Nov 6, 2026
What did AMC Entertainment's insiders report trading?
AMC Entertainment's insiders made 37 Form 4A filing an insider must make within two business days of buying or selling the company's shares. Learn more filings in the 12 months to Nov 6, 2026.
They reported 1 purchase (250,000 shares) and no sales in the open market or privately (codes P and S).
The same filings report 45 other share transactions (A: 18, F: 18, M: 9).
They also report 36 transactions in options, stock units or other derivatives.
Insiders are a company's officers, directors and owners of more than 10% of a class of its shares. Most changes in their holdings must be reported to the SEC on a Form 4 within two business days. Source: SEC Form 4 filings on EDGAR.
- P
- a purchase in the open market or privately
- S
- a sale in the open market or privately
- A
- a grant, award or other acquisition from the company under Rule 16b-3
- F
- shares withheld or handed over to pay an exercise price or tax when an award is received, exercised or vests
- M
- exercise or conversion of an option or other derivative, exempt under Rule 16b-3
Code meanings: General Instruction 8 of Form 4 (SEC).
The latest 25 of 46 transactions
Shares: A = acquired, D = disposed of. A price the filing gives only in a footnote shows as “See filing”. The 10b5-1 box is checked when at least one trade on the form was made under a Rule 10b5-1 plan. A Form 4/A replaces the form it amends. See all of AMC Entertainment's Form 4 filings on EDGAR.
Learn: How to read a proxy statement (DEF 14A): Nvidia's 2026 proxy · Form 4 insider filings: who files, the codes and the footnotes · Rule 10b5-1 trading plans: how insiders pre-schedule their trades
Sources (6)
- Form 10-Q, Q3 2026 (quarter ended Sep 30, 2026)
- Form 10-K, fiscal year 2025 (ended Dec 31, 2025)
- Schedule 13G/A, BlackRock, Inc. (event date Sep 30, 2026)
- Schedule 13G, Peconic Partners LLC (event date Sep 30, 2026)
- Schedule 13G/A, Discovery Capital Management, LLC (event date Jun 30, 2026)
- Schedule 13G, Vanguard Capital Management (event date Sep 30, 2026)
21What it does with profit
21What it does with profit
What does AMC Entertainment do with its profit?
Money raised · Dec 31, 2021
Net proceeds from issuing shares during FY2021 (cash flow statement).
$1.8B
Money raised · Dec 31, 2022
Net proceeds from issuing equity during FY2022 (cash flow statement).
$220M
Money raised · Dec 31, 2023
Net proceeds from issuing equity during FY2023 (cash flow statement).
$833M
Money raised · Dec 31, 2024
Net proceeds from issuing shares during FY2024 (cash flow statement).
$255M
Money raised · Dec 31, 2025
Net proceeds from issuing shares during FY2025 (cash flow statement).
$170M
Money raised · Jun 30, 2026
Shares sold at market prices (an at-the-market program) in Q1 and Q2 FY2026: 105.3 million shares for $150.0 million gross.
$150M
Money raised · Jun 30, 2026
Registered direct offering in June 2026: 95.25 million shares for $200.0 million gross. AMC also issued 142.1 million shares in May 2026 in exchange for exchangeable notes, and 33.1 million as consent fees in Q1 FY2026.
$200M
Money raised · Oct 5, 2026
Refinancing of about 97% of AMC's debt: $2,000.0 million of first-lien notes, an $850.0 million first-lien term loan and a $1,120.0 million second-lien term loan.
$4.0B
22Governance signals
22Governance signals
What do AMC Entertainment's governance filings show?
- Auditor
- Ernst & Young LLP, since 2020
- Auditor changes
- None in the period covered
- Audit qualifications
- None reported
- Related-party dealings
- AMC's 2026 proxy statement says there have been no related person transactions since Jan 1, 2025.
- Credit rating
- No public credit rating found in a search of rating agency sites on Nov 7, 2026
Flags to know about
other · Nov 3, 2026
Large and continuing share issuance
AMC has issued 887.4 million shares since Jan 1, 2020, adjusted for its 1-for-10 reverse split of Aug 24, 2023, according to its Q3 FY2026 10-Q. On Nov 3, 2026 it had 143,258,701 authorized shares not issued or reserved.
other · Sep 24, 2026
Board changes failed despite most votes in favor
At the Sep 24, 2026 annual meeting, proposals to declassify the board, allow action by written consent and remove the limit on calling special meetings failed: over 97% of votes cast were in favor, but each needed a majority of outstanding shares. Holders approved raising the 2024 equity incentive plan from 25 million to 50 million shares.
other · Aug 10, 2026
Stockholder lawsuits
Simons v. AMC, filed Oct 31, 2025 in federal court in New York by a former AMC Preferred Equity Unit holder, alleges securities-law violations. It began as a class action claiming at least $178 million. On Jun 8, 2026 the plaintiff dropped the class claims. His amended complaint of Aug 10, 2026 seeks about $40,500 for himself only, and AMC says it no longer considers the case material. Masoner v. AMC, filed Dec 5, 2025 in Delaware by two stockholders against AMC, Adam Aron and board members, concerns the 2023 stockholder settlement. It seeks about $4.2 million in damages and about $18 million in disgorgement. An amended complaint of Mar 24, 2026 added current and former directors as defendants. The defendants' motion to dismiss, filed Apr 8, 2026, was still pending according to the Q3 FY2026 10-Q.
disclosure · Nov 4, 2026
Adjusted EBITDA definition changed twice
AMC changed its Adjusted EBITDA definition in 2024 and again in Q1 FY2026, so figures from different years are not fully comparable. AMC gives no numeric guidance in its earnings releases.
Sources (6)
- Definitive proxy statement (DEF 14A), 2026 annual meeting
- Form 10-K, fiscal year 2025 (ended Dec 31, 2025)
- Form 10-Q, Q3 2026 (quarter ended Sep 30, 2026)
- Form 8-K, Oct 5, 2026 refinancing closing (Ex. 99.1 press release)
- Earnings release, Q3 2026 (8-K Ex. 99.1)
- Form 8-K, 2026 annual meeting voting results (Items 5.02, 5.07)
23What the market paid
23What the market paid · price as of Nov 5, 2026
What did the market pay for AMC Entertainment on Nov 5, 2026?
Price as of Nov 5, 2026 (shown for education; prices change daily).
Price as of Nov 5, 2026: AMC shares closed at $3.08, from Nasdaq's historical price table; the shares are listed on the NYSE. Market value = $3.08 × 892.6 million shares (Nov 3, 2026) = about $2,749.2 million (Cityfort calculation from the Nov 5, 2026 closing price and the Q3 FY2026 10-Q cover). P/E (price ÷ earnings per share) is not shown because AMC reported a net loss for FY2025 and for the 12 months to Sep 30, 2026. P/B is not shown because stockholders' equity is negative. The same table shows a close of $3.52 on Nov 4, 2026, the day Q3 FY2026 results were released.
- Share price
- $3.08
- Market value (market cap)
- $2.7B
More price-based ratios · as of Nov 5, 2026
Each ratio divides a number from the company's filings by the market value or share price on Nov 5, 2026. Prices change daily, so these ratios do too.
Price to sales (P/S)
0.5×
$2.7B market value ÷ $5.6B revenue (four quarters to Sep 30, 2026) = 0.5×
Cityfort calculation from the Nov 5, 2026 closing price and the Q4 FY2025 to Q3 FY2026 10-Qs and earnings releases. Source: AMC historical prices, Oct 29 to Nov 5, 2026 (Nasdaq.com historical table; AMC is listed on the NYSE); Form 10-Q, Q3 2026 (quarter ended Sep 30, 2026); Earnings release, Q4 and full year 2025 (8-K Ex. 99.1) and 3 more
How price ratios workFree cash flow yield
−13.3%
−$366M free cash flow (FY2025) ÷ $2.7B market value = −13.3%
Cityfort calculation from the FY2025 10-K and the Nov 5, 2026 closing price. Source: AMC historical prices, Oct 29 to Nov 5, 2026 (Nasdaq.com historical table; AMC is listed on the NYSE); Form 10-Q, Q3 2026 (quarter ended Sep 30, 2026); Form 10-K, fiscal year 2025 (ended Dec 31, 2025)
What free cash flow means
Shares used for the market value: 892.6 million ($3.08 × 892.6 million shares ≈ $2.7B). Source: Form 10-Q, Q3 2026 (quarter ended Sep 30, 2026); Form 10-K, fiscal year 2025 (ended Dec 31, 2025)
Source: AMC historical prices, Oct 29 to Nov 5, 2026 (Nasdaq.com historical table; AMC is listed on the NYSE); Form 10-Q, Q3 2026 (quarter ended Sep 30, 2026)
Sources (7)
- AMC historical prices, Oct 29 to Nov 5, 2026 (Nasdaq.com historical table; AMC is listed on the NYSE)
- Form 10-Q, Q3 2026 (quarter ended Sep 30, 2026)
- Earnings release, Q4 and full year 2025 (8-K Ex. 99.1)
- Earnings release, Q1 2026 (8-K Ex. 99.1)
- Earnings release, Q2 2026 (8-K Ex. 99.1)
- Earnings release, Q3 2026 (8-K Ex. 99.1)
- Form 10-K, fiscal year 2025 (ended Dec 31, 2025)
24How it got here
24How it got here
How did AMC Entertainment get here?
1920
Milestone
Founded in Kansas City
AMC's business began in Kansas City in 1920. The current holding company was incorporated in Delaware in 2007.
2013
Milestone
Listed on the NYSE
AMC shares began trading on the NYSE on Dec 18, 2013.
2021
Crisis
Large loss, funded by new shares
FY2021 revenue was $2,527.9 million and the net loss $1,269.1 million. AMC raised $1,801.1 million of net proceeds from issuing shares that year.
2023
Milestone
Reverse split and conversion of preferred units
AMC combined every 10 shares into one on Aug 24, 2023 and converted its AMC Preferred Equity Units into common stock. Shares outstanding were 260.6 million at the end of 2023.
2025
Crisis
Debt swaps add to the loss
The FY2025 net loss of $632.4 million included $202.3 million of losses on retiring debt. Shares outstanding reached 512.9 million.
2026
Milestone
First quarterly profit in 12 quarters
Q3 FY2026 net income was $109.3 million on revenue of $1,711.1 million, after shares outstanding rose to 892.6 million.
2026
Business-model change
Debt refinanced to 2031 and 2033
On Oct 5, 2026 AMC refinanced about $3.97 billion of debt, replacing borrowings due mostly in 2029.
25Sources and changes
Where every number on this page comes from
Sources (21 documents)
- S1Form 10-K, fiscal year 2025 (ended Dec 31, 2025) · AMC Entertainment Holdings, Inc. (SEC EDGAR) · Tier 1: company or exchange filing · Feb 23, 2026
- S2Form 10-K, fiscal year 2023 (ended Dec 31, 2023) · AMC Entertainment Holdings, Inc. (SEC EDGAR) · Tier 1: company or exchange filing · Feb 28, 2024
- S3XBRL company facts (Dec 31, 2021 balance sheet as filed in the FY2022 Form 10-K, accession 0001411579-23-000038) · U.S. Securities and Exchange Commission (data.sec.gov) · Tier 1: company or exchange filing · Feb 28, 2023
- S4Form 10-Q, Q3 2026 (quarter ended Sep 30, 2026) · AMC Entertainment Holdings, Inc. (SEC EDGAR) · Tier 1: company or exchange filing · Nov 4, 2026
- S5Earnings release, Q3 2026 (8-K Ex. 99.1) · AMC Entertainment Holdings, Inc. (SEC EDGAR) · Tier 1: company or exchange filing · Nov 4, 2026
- S6Earnings release, Q2 2026 (8-K Ex. 99.1) · AMC Entertainment Holdings, Inc. (SEC EDGAR) · Tier 1: company or exchange filing · Jul 20, 2026
- S7Earnings release, Q1 2026 (8-K Ex. 99.1) · AMC Entertainment Holdings, Inc. (SEC EDGAR) · Tier 1: company or exchange filing · May 5, 2026
- S8Earnings release, Q4 and full year 2025 (8-K Ex. 99.1) · AMC Entertainment Holdings, Inc. (SEC EDGAR) · Tier 1: company or exchange filing · Feb 23, 2026
- S9Earnings release, Q3 2025 (8-K Ex. 99.1) · AMC Entertainment Holdings, Inc. (SEC EDGAR) · Tier 1: company or exchange filing · Nov 5, 2025
- S10Earnings release, Q2 2025 (8-K Ex. 99.1) · AMC Entertainment Holdings, Inc. (SEC EDGAR) · Tier 1: company or exchange filing · Aug 11, 2025
- S11Earnings release, Q1 2025 (8-K Ex. 99.1) · AMC Entertainment Holdings, Inc. (SEC EDGAR) · Tier 1: company or exchange filing · May 7, 2025
- S12Earnings release, Q4 and full year 2024 (8-K Ex. 99.1) · AMC Entertainment Holdings, Inc. (SEC EDGAR) · Tier 1: company or exchange filing · Feb 25, 2025
- S13Definitive proxy statement (DEF 14A), 2026 annual meeting · AMC Entertainment Holdings, Inc. (SEC EDGAR) · Tier 1: company or exchange filing · Aug 10, 2026
- S14Form 8-K, Oct 5, 2026 refinancing closing (Ex. 99.1 press release) · AMC Entertainment Holdings, Inc. (SEC EDGAR) · Tier 1: company or exchange filing · Oct 6, 2026
- S15Form 8-K, 2026 annual meeting voting results (Items 5.02, 5.07) · AMC Entertainment Holdings, Inc. (SEC EDGAR) · Tier 1: company or exchange filing · Sep 24, 2026
- S16Schedule 13G/A, BlackRock, Inc. (event date Sep 30, 2026) · BlackRock, Inc. (SEC EDGAR) · Tier 1: company or exchange filing · Oct 27, 2026
- S17Schedule 13G, Peconic Partners LLC (event date Sep 30, 2026) · Peconic Partners LLC (SEC EDGAR) · Tier 1: company or exchange filing · Nov 2, 2026
- S18Schedule 13G, Vanguard Capital Management (event date Sep 30, 2026) · Vanguard Capital Management (SEC EDGAR) · Tier 1: company or exchange filing · Oct 30, 2026
- S19Schedule 13G/A, Discovery Capital Management, LLC (event date Jun 30, 2026) · Discovery Capital Management, LLC (SEC EDGAR) · Tier 1: company or exchange filing · Aug 14, 2026
- S20Schedule 13G/A, Pentwater Capital Management LP (event date Jun 30, 2026: 0.3%) · Pentwater Capital Management LP (SEC EDGAR) · Tier 1: company or exchange filing · Aug 14, 2026
- S21AMC historical prices, Oct 29 to Nov 5, 2026 (Nasdaq.com historical table; AMC is listed on the NYSE) · Nasdaq, Inc. · Tier 1: company or exchange filing · Nov 6, 2026
Changes to this page (v1 · Nov 6, 2026)
- v1 · Nov 6, 2026First version (US edition), from the FY2025 and FY2023 10-Ks, FY2022 XBRL filing data, the Q3 FY2026 10-Q, earnings releases from Q4 FY2024 to Q3 FY2026, the 2026 proxy statement, two 8-Ks and Schedule 13G filings. (first version)
Numbers come only from tier 1 and tier 2 sources. Read how we research.
Disclaimer
For learning only. Cityfort is not a registered investment adviser or broker-dealer and does not recommend buying or selling any security. Prices shown are dated and may be out of date.
Investing in securities involves risk, including loss of capital. Before making any investment decision, do your own research and consider consulting a registered investment adviser or other qualified professional.
Cityfort, its owners and contributors may or may not hold securities of companies covered. Cityfort is not paid by any company it covers. Content is not an offer or solicitation to buy or sell any security, including in any initial public offering.
Read the positions policyRead the full disclaimerHide the full disclaimer
Cityfort publishes general educational content that explains how listed companies work. Cityfort is not registered with the US Securities and Exchange Commission or any state securities regulator as an investment adviser, and is not a broker-dealer or a member of FINRA. Cityfort does not provide investment, tax or legal advice, recommendations, ratings, price targets or any opinion on whether to buy, sell or hold any security. Nothing on the site is tailored to any person's circumstances.
All information is taken from publicly available sources, mainly company filings with the SEC, which are listed on each page with dates. We work to keep it accurate and correct errors publicly, but we do not guarantee that it is complete, accurate or up to date. Any market price or price-based ratio shown is dated, may be out of date by the time you read it, and is included only to explain concepts.
Statements by company management, including forward-looking statements and guidance, are reported as the company's statements, with their date and source; they are not our forecasts. Adjusted (non-GAAP) figures are the company's own measures and are shown next to the official (GAAP) figures.